Proceeding Paper

It Can’t Get No Worse: Using Twitter Data to Improve GDP Estimates for Developing Countries †

Economics, Carnegie Mellon University in Qatar, Ar-Rayyan P.O. Box 24866, Qatar
Presented at the 9th International Conference on Time Series and Forecasting, Gran Canaria, Spain, 12–14 July 2023.
Eng. Proc. 2023, 39(1), 49; https://doi.org/10.3390/engproc2023039049
Published: 4 July 2023
(This article belongs to the Proceedings of The 9th International Conference on Time Series and Forecasting)

Abstract

:
This paper shows that we can use social media data to improve the accuracy of GDP estimates at the country level for developing countries. I use all publicly available image tweets from 2012 and 2013 to estimate GDP at the country level for developing countries. First, I find that one can explain 76% of the cross-country variation in GDP with the volume of tweets sent from each country. I then show that the residuals on these Twitter-GDP estimates are significantly larger for countries with allegedly poor data quality. I then use Nigeria as a case study to show that this method delivers much more timely and accurate estimates than those presented by official statistic agencies.

1. Introduction

On 7 April 2014, the Nigerian Bureau of Statistics declared that their 2013 gross domestic product (GDP) estimates were being revised upward from USD 269 billion to USD 510 billion [1]. Overnight, the Nigerian economy had grown by 89 percent and was now the largest economy in Africa, overtaking South Africa in the process.
However, this sudden increase in GDP was not a result of successful economic policies or benevolent external conditions. Instead, it was a product of a national accounting process known as rebasing. Until 2014, Nigeria’s GDP was constructed by sampling businesses weighed in accordance to the importance each sector had on the Nigerian economy in 1990. Evidently, in the ensuing years, the economy morphed. This made emerging industries vastly underrepresented in the country’s GDP estimate, and vice versa. In this sense, the new and updated estimate was expected to more closely reflect the true GDP of the Nigerian economy. However, it also meant that up until that point, policymakers, investors, and everyone else making economic decisions based on the old GDP estimates were relying on grossly inaccurate economic data.
This example, of which there are several others in the past few years (e.g., Zambia in 2010, Kenya and Tanzania in 2013, and Uganda in 2014 just to name a few examples from other African countries. In each of these cases, the revised figures where 13–28% higher than the previous estimates), sheds light on how complicated it is to put together national statistics and how (oftentimes) inaccurate official GDP estimates are.
The inaccuracy of GDP measurements at the country level tends to be accentuated in developing countries. This is due to several factors. First, statistical offices in developing countries tend to have fewer resources to construct these estimates. Second, given that developing countries tend to have relatively large informal sectors, they are oftentimes included in official estimates [2]. Given that informal companies many times do not keep proper accounting books, this generally complicates matters because informal companies tend to provide inaccurate financial statements. These conditions leave statistical offices in developing countries with a complicated task, to put together a reliable estimate of the size of the countries’ economy, which includes a sizeable sector that generally does not count with reliable data and to put together this estimate with limited resources. The inaccuracy of GDP measurements at the country level tends to be accentuated in developing countries. This is due to several factors. First, statistical offices in developing countries tend to have fewer resources to construct these estimates. Second, given that developing countries tend to have relatively large informal sectors, they are oftentimes included in official estimates [2]. Given that informal companies many times do not keep proper accounting books, they tend to provide inaccurate statements of their own finances.
These conditions leave statistical offices in developing countries with a complicated task, to use their limited resources to put together a reliable estimate of the size of the countries’ economy from a sample of (mostly) unreliable firm-level data. This leads economists like [2] to conclude that GDP statistics from African countries are “best guesses of aggregate production”.
These concerns and limitations have motivated efforts to find proxies that may estimate economic activity. Several authors have proposed using satellite night-light images to estimate GDP at the country level or sub-national level (A thorough overview can be found in [3]). The use of night-lights has motivated economists to look for other proxies to measure economic activity. Ref. [4] estimate the German business cycle at a monthly level by measuring toll activity on important highways by heavy transport vehicles. On their part, Ref. [5] use Google Trends search data to estimate economic activity. Finally, in a paper closely related to this one, Ref. [6] suggests the use of social media data for estimating GDP, both at the national and sub-national level. The paper shows how social media can be used as a supplement to official GDP estimates to improve their accuracy. Given their accuracy and availability, these alternative estimates could also serve as a tool for non-governmental agencies and international organizations to corroborate official GDP estimates.
This paper proposes a way in which statistic agencies and international organization can use social media data to improve the accuracy of their economic measurements. In particular, I use all publicly available tweets with images sent in 2012 and 2013 to estimate GDP at the country level for developing countries. I find that one can accurately estimate GDP at the country level by using the volume of tweets shared from each location. I then gather World Bank data on the quality and fidelity of the official economic data released by each country and find that the residuals of the Twitter-GDP estimates for countries with allegedly poor data quality tend to be larger than for countries that are considered to have more reliable economic data. I finalize by using the aforementioned rebasing case of Nigeria as an example of how social media data offers valuable information in finding the true level of economic activity for a developing country. For 2012 and 2013, I find that the GDP estimate using Twitter data is in fact quite close to the greatly revised estimate.

2. Materials and Methods

The Twitter data for this paper were obtained directly from Twitter. The dataset was awarded via the 2014 Twitter Data Grant submission, which was awarded to the Cultural Analytics Lab directed by Lev Manovich. The dataset contains all Twitter posts containing geo-tagged images between 1 January 2012 and 31 December 2013. As per [7], approximately 20% of tweets are geographically located, while [8] reports that 42% of tweets contain an image. However, the latter analysis was limited to 1 million tweets sent by US West Coast users, which could skew the results. To account for this, the author collected 10,000 tweets randomly in December 2018 using the Twitter API. Among this set, 4.9% of tweets were geo-located, and 22.8% contained images.
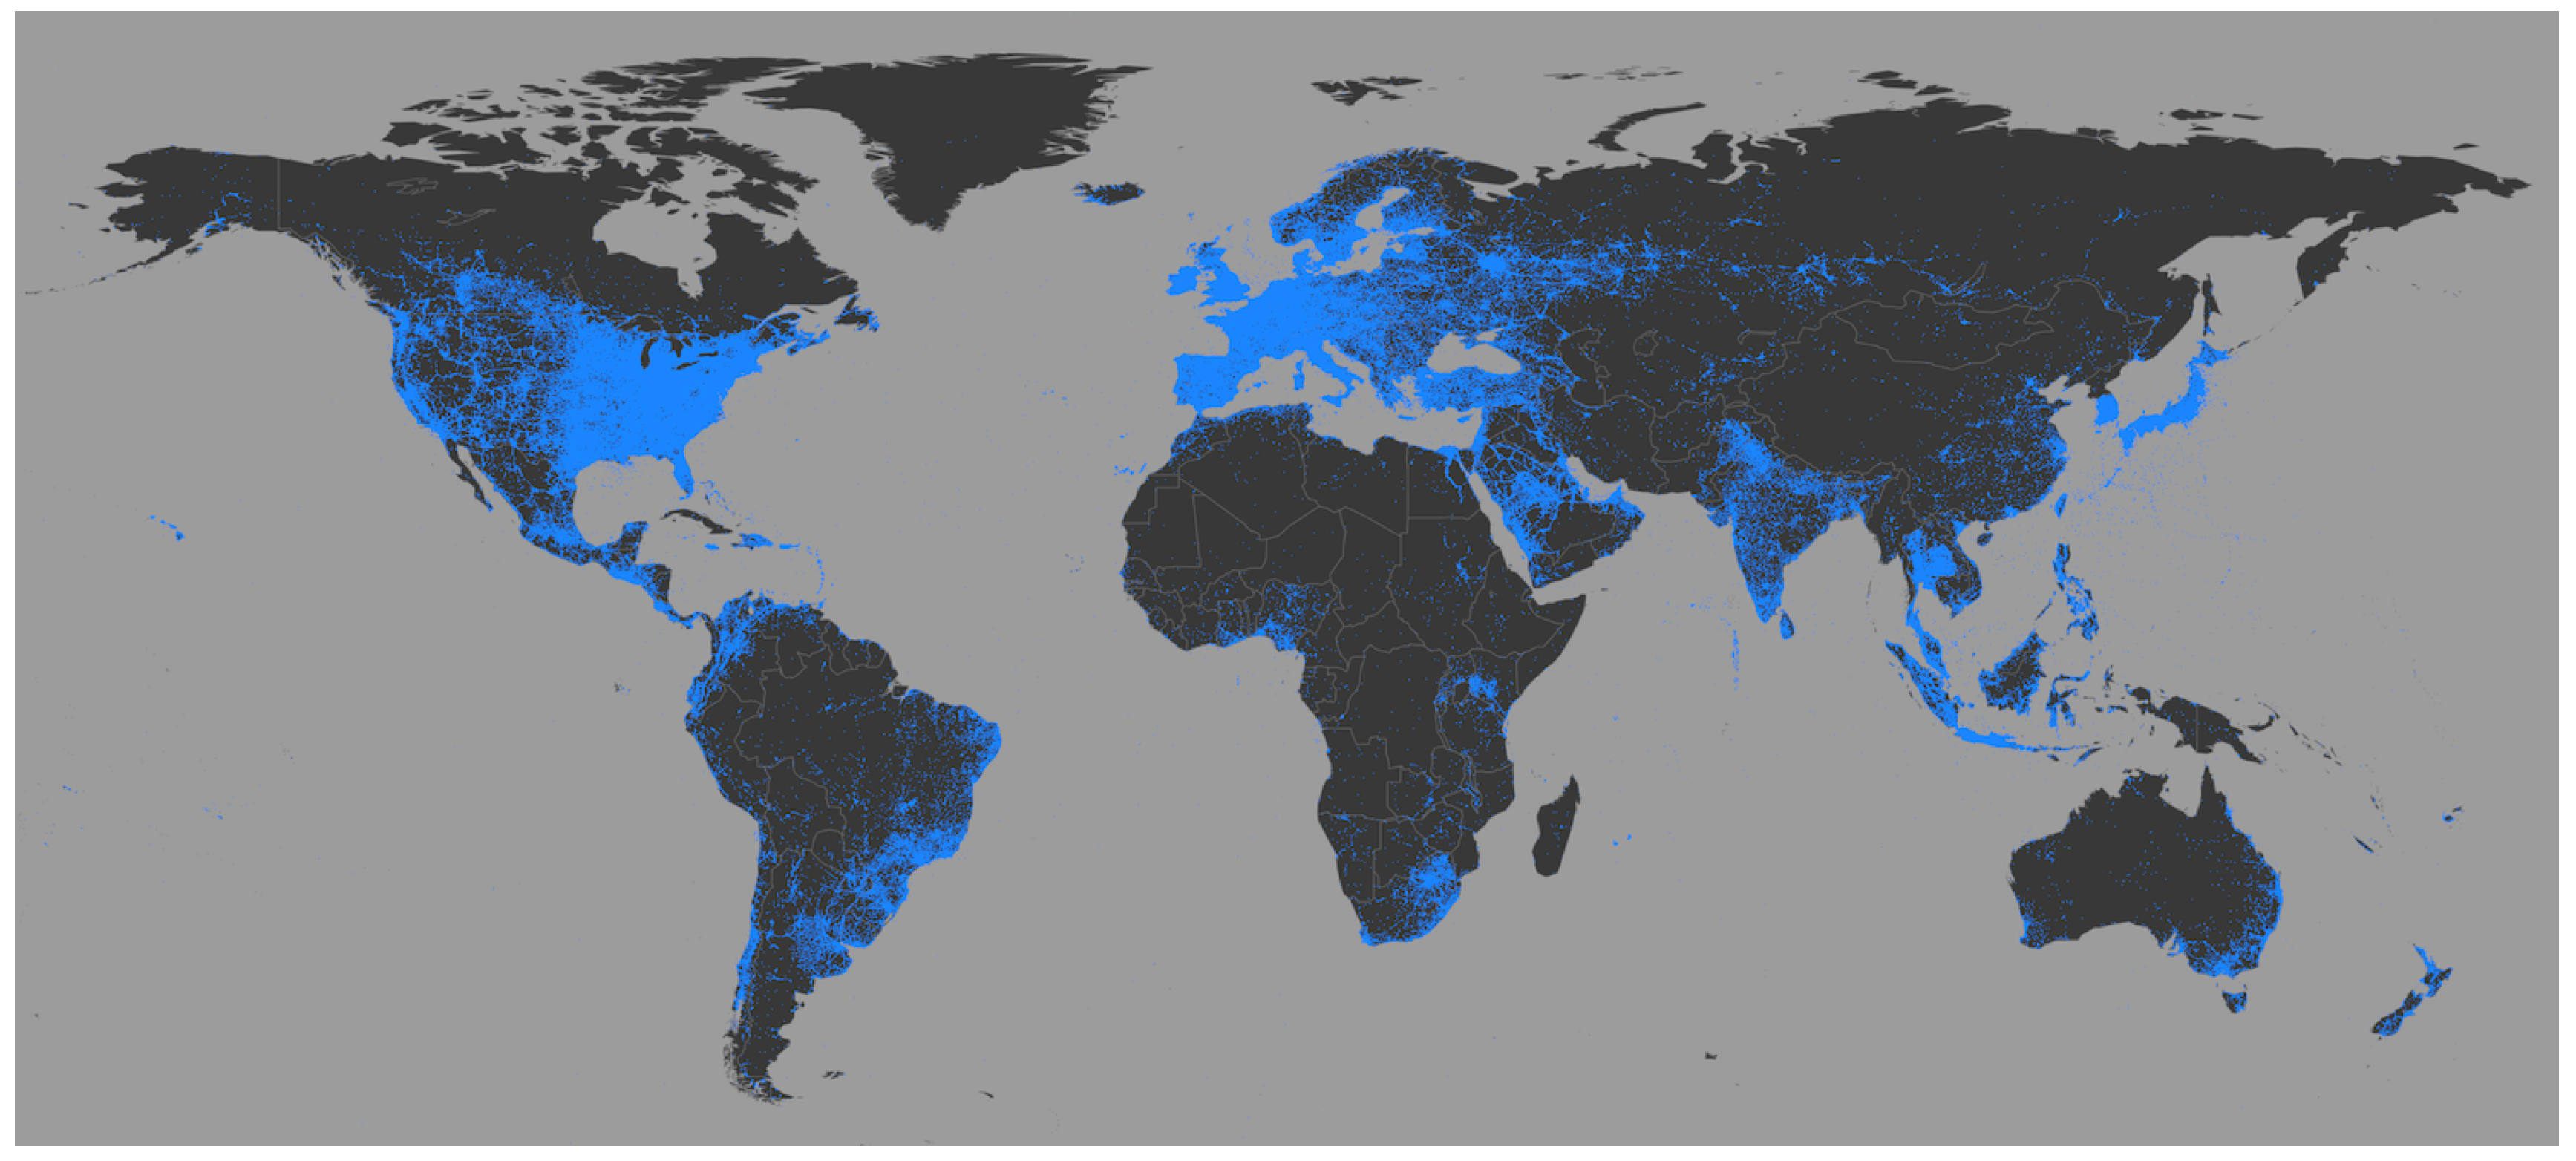
The dataset contains 140 million tweets from all over the world, each with a unique Twitter user ID, the latitude and longitude from where the tweet was sent from (with 5 decimal points for a precision of 1.1 m), the tweet’s date and time, the image tweeted, and any accompanying text. Figure 1 shows a map indicating the location from where all image tweets were sent from.
Bots that sent over five tweets in a minute were removed to prevent them from biasing the data. However, this did not significantly alter the results presented in Section 3.
Table 1 summarizes the Twitter data by year and by income group (based on the World Bank’s classification) for developing countries. The data show that the average number of tweets per country rose from around 50,000 in 2012 to almost 250,000 in 2013, suggesting an increase in image tweets. Additionally, while countries with higher incomes had more tweets on average, the growth rates of tweet numbers from 2012 to 2013 were higher among lower income countries.

3. Results

3.1. Estimating GDP from Tweets

In order to suggest that social media data can serve as a proxy for estimating economic activity in developing countries, I first show that annual GDP can be accurately estimated using solely the volume of tweets sent from each country.
I use the precise location (latitude–longitude) to geocode the country of origin where each post was sent from, aggregate the volume of tweets by country per year and estimate
ln G D P i , t = β 0 + α t + β 1 ln P o p u l a t i o n i , t + β 2 ln T w e e t s i , t + ε i , t ,
where the explained variable is the natural log of GDP of country i in year t. The coefficient we are most interested in is β 2 , which shows the relevance of the number of image tweets taken from that country in each of those years for estimating GDP. In Equation (1), we control for the population size in each country and include year fixed effects ( α t ) to control for any differences in the use of Twitter from one year to the other, as well as changes in global economic conditions.
The corresponding estimates are reported in Table 2. There are 122 developing countries in the dataset with data on GDP, Twitter and population for both years. I also remove countries in which Twitter was banned for a period of time during any of these years, such as China and Iran. In column 1, I regress the natural log of GDP solely on the number of image tweets sent from each country as well as country fixed effects. This is the baseline regression. The coefficient of interest on l n ( T w e e t s ) is positive and highly significant and the R 2 is 0.76. Columns 2–4 run the same model separately for countries in each income group. In all cases, the coefficient of interest is positive and statistically significant at the 1% level. The R 2 varies from 0.53 to 0.75 depending on the income group. Column 5 controls for the population estimate for each of these countries in the regression. Column 5 shows this model when we include all developing countries. Relative to column 2, the coefficient on tweets declines but remains positive and statistically significant and the R 2 increases to 0.9. Columns 6–8 run this model separately for countries in each income group. In all cases, the coefficient of interest is positive and statistically significant (either at the 1% level or 5% level for upper-middle income countries) and the R 2 varies between 0.89 and 0.98.
Table 2 shows that the volume of image tweets sent in a year is a valuable measure for estimating GDP at the country level, being able to explain 76% of the cross-country variation in GDP on its own. Figure 2 plots the residuals of Equation (1) against the fitted values, enabling us to study the distribution of the residuals. The figure indicates that they seem to be randomly distributed around zero.

3.2. Data Quality Issues

Section 1 showed that GDP estimates have been criticized for being inaccurate, particularly in developing countries. If this is the case, it would imply that Equation (1) is fitting the data to the GDP reported by countries, which is not necessarily the true and accurate GDP of these countries. Hence, it is possible that a portion of the differences between the Twitter-GDP and official GDP estimates arise due to measurement error in official GDP estimates. In this case, data from tweets could be used by statistical agencies as a complementary measure to produce more accurate estimates.
To examine this, I will incorporate a measure of data quality developed by the World Bank. The World Bank’s Statistical Capacity Indicator is a composite score assessing the capacity of a country’s statistical system. It is based on a diagnostic framework assessing areas including methodology, data sources, and periodicity and timeliness. The overall score is a simple average of all three area scores on a scale of 0–100, where higher values indicate better data quality assessment.
Given that the World Bank works solely with low-income, lower-middle income, and upper-middle income countries, the data available for such measures are restricted to these countries. There are 140 countries for which there is an indicator on the quality of the data, as well as GDP, Twitter, population, and percent of population with access to the Internet.
I will then collect the residuals of Equation (1) using the subset data and run the following regression
R e s i d u a l s i , t 2 = β 0 + β 1 D a t a Q u a l i t y i , t + ε i , t ,
where I will regress the squared residuals for country i in year t on the data quality index and GDP. The coefficient of interest is β 1 ; a negative and statistically significant coefficient would indicate that the residuals in my baseline model in Equation (1) are larger for countries with low data quality, and vice versa. Table 3 shows that the data quality indicator coefficient is in fact negative and statistically significant at the 1% confidence level. This indicates that GDP estimates under the baseline model are more accurate for countries with high-quality data, and vice versa.

3.3. Example: Nigeria’s Rebasing

In April 2014, the Nigerian Bureau of Statistics announced that they were changing the base year for their GDP calculations from 1990 to 2010. Authorities explained that the change was made to reflect the new structure of the economy, which currently relied more heavily on the financial and communication sectors, among others [1]. Interestingly though, the revised GDP estimates for 2012 and 2013 (the two most recent years) were larger by roughly 90% each year.
These revisions, which are not infrequent (according to a statement from the Nigeria’s Bureau of Statistics, they are considering to rebase their GDP estimates again [9]) enable us to see if GDP estimates could be more accurate if we were to rely on GDP estimates based on volume of tweets.
For this exercise, we gather the coefficients calculated in Equation (1) to estimate Nigeria’s GDP for 2012 and 2013 based on the volume of image tweets sent from the country in each of those years. We then compare these estimates to both the original (i.e., the one using the old series) and the revised (i.e., the one using the new series) official GDP estimates for those years.
Table 4 shows these different estimates. We see that the Twitter-GDP estimates are closer to the revised estimates, than the old series estimates are. While the revised estimates are 93 and 90% higher than the original estimates, respectively, they are 45 and 49% higher than the Twitter-GDP estimates, respectively.

4. Discussion

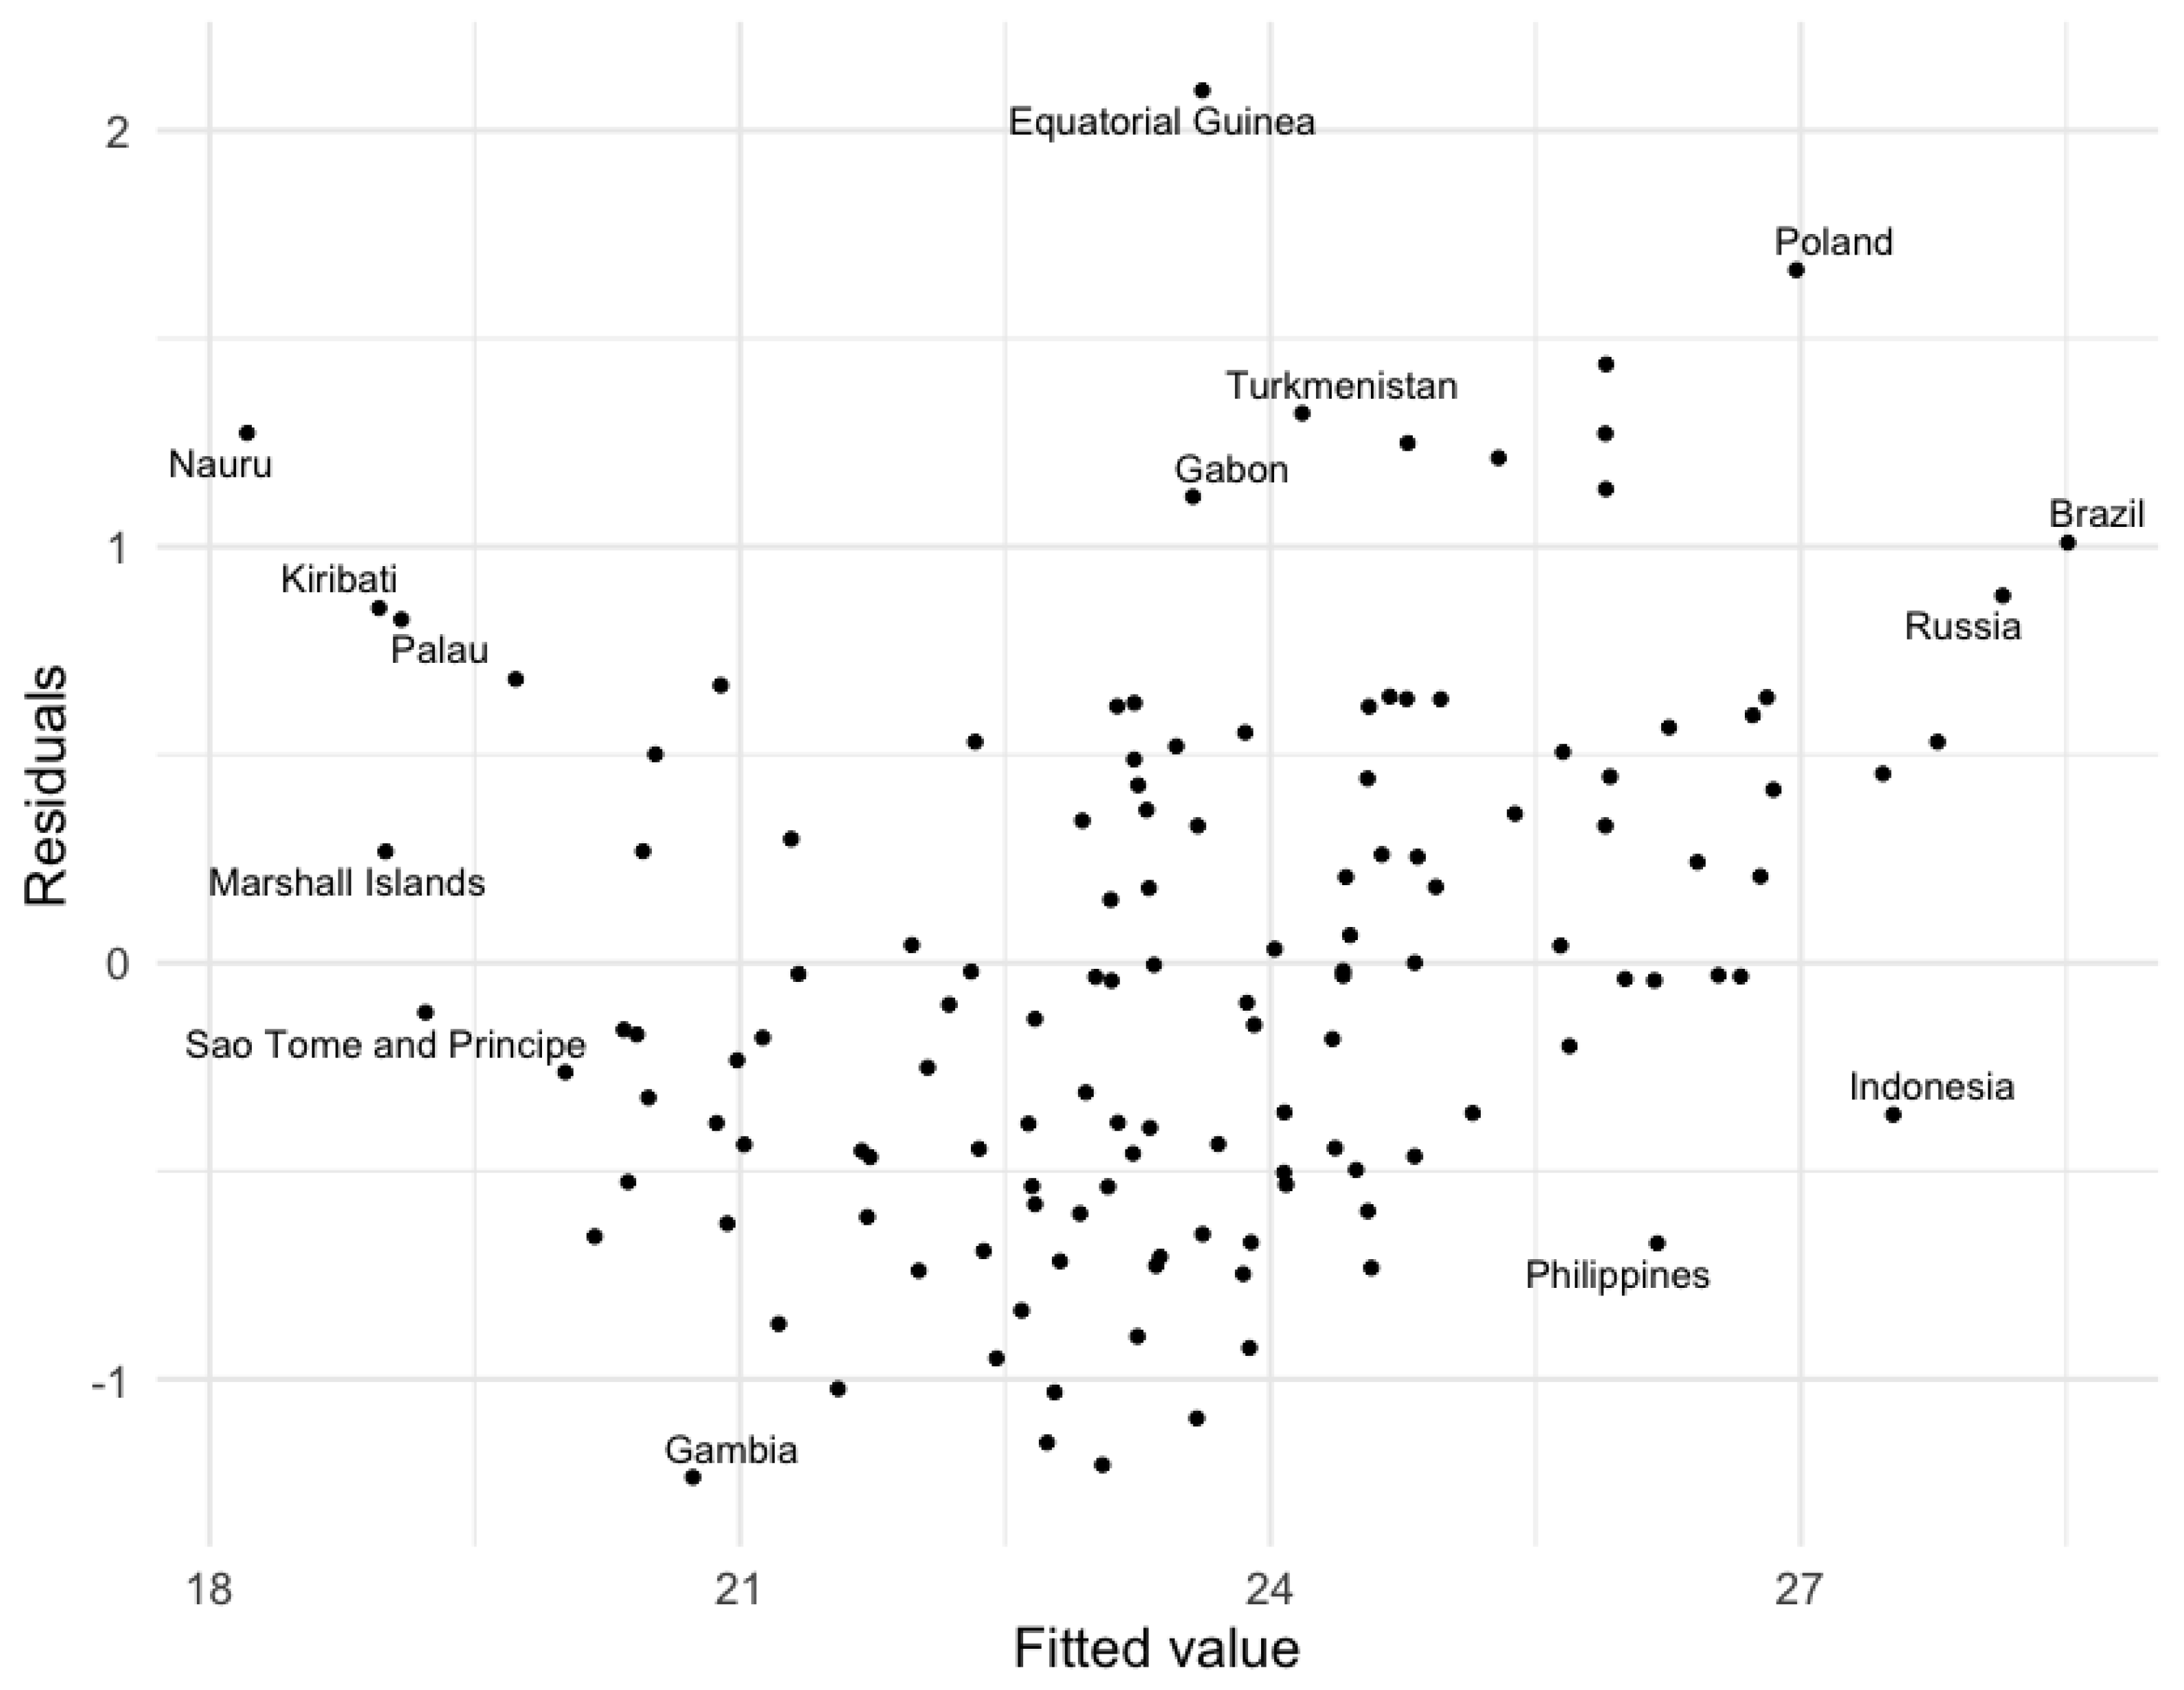
The main goal of this paper is to study whether social media data from Twitter could be used as a proxy for estimating GDP for developing countries. In particular, this paper analyzes whether social media data can be used to improve the accuracy of official GDP estimates for low-income countries. First, I find that the volume of image tweets sent from a country, together with the population, can explain roughly 90% of the cross-country variation in GDP for developing countries. This is pretty much in line with what others have found for using social media to estimate economic activity [5,6].
As discussed in Section 1, developing countries tend to have highly inaccurate official GDP estimates. Hence, it is possible that a significant share of the differences between the Twitter-GDP and official GDP estimates arise due to measurement errors in these official GDP estimates. If this is in fact the case, data from tweets could be used by statistical agencies as a complementary measure to produce more accurate estimates. I study this by collecting the residuals in the baseline model and then running a regression on a measure of data quality in each country. The negative coefficient on the data quality index in Equation (2) suggests that there is information to be captured from Twitter data that could help close the gap between estimated GDP and the true GDP. Social media data could thus be used as a complement to survey data to increase the accuracy of GDP estimates.
Furthermore, given that the measurement errors stemming from official GDP estimates and Twitter-GDP estimates are not correlated, we can use both measures together to improve their accuracy [10]. This was also one of the motivating factors to push for the use of night-lights to improve GDP measurements in [11].
A word of caution should be expressed before incorporating social media (or related) data to produce official statistics. While these data sources could represent valuable information, it is troublesome to incorporate measures that only represent a proxy. In other words, it is important to understand the underlying mechanism relating economic activity and social media posts. Ref. [6] explores the underlying mechanism between tweets and economic activity and finds evidence to suggest that social media posts are often used by users to showcase consumption of goods and services to their network of followers. Thus, a larger number of posts represents a larger share of consumption, which is a significant part of what drives the economy.
Nonetheless, the frequency with which users post on social media and reasons why they choose to do so can evolve and change quickly. A much deeper understanding of these mechanisms are needed before governments and statistic agencies rely on these measures when putting together official measures. Given that people are generating increasingly large volumes of data on social media applications (and related software), it would be sensible to research these more carefully to see if they can help us obtain more accurate measurements on the state of the economy.

Funding

This research received no external funding.

Institutional Review Board Statement

Not applicable.

Informed Consent Statement

Not applicable.

Data Availability Statement

Restrictions apply to the availability of these data. The data were awarded via the 2014 Twitter Data Grant submission, which was awarded to the Cultural Analytics Lab directed by Lev Manovich. Aggregated data are available from the author upon request.

Acknowledgments

I am grateful to David Jaeger, Francesc Ortega, and Lev Manovich for their useful comments and suggestions.

Conflicts of Interest

The author declares no conflict of interest.

Abbreviations

The following abbreviations are used in this manuscript:
GDPGross Domestic Product

References

  1. Blas, J.; Wallis, W. Nigeria Almost Doubles GDP in Recalculation. Financial Times, 7 April 2014; Volume 7, p. 8. [Google Scholar]
  2. Jerven, M. Poor Numbers: How We Are Misled by African Development Statistics and What to Do about It; Cornell University Press: Ithaca, NY, USA, 2013. [Google Scholar]
  3. Donaldson, D.; Storeygard, A. The View from Above: Applications of Satellite Data in Economics. J. Econ. Perspect. 2016, 30, 171–198. [Google Scholar] [CrossRef] [Green Version]
  4. Askitas, N.; Zimmermann, K.F. Nowcasting Business Cycles Using Toll Data. J. Forecast. 2013, 32, 299–306. [Google Scholar] [CrossRef] [Green Version]
  5. Woloszko, N. Tracking Activity in Real Time with Google Trends; OECD Economics Department Working Papers 1634; OECD Publishing: Paris, France, 2020. [Google Scholar] [CrossRef]
  6. Indaco, A. From twitter to GDP: Estimating economic activity from social media. Reg. Sci. Urban Econ. 2020, 85, 103591. [Google Scholar] [CrossRef]
  7. Weidemann, C.; Swift, J. Social media location intelligence: The next privacy battle—An ArcGIS add-in and analysis of geospatial data collected from Twitter.com. Int. J. Geoinform. 2013, 9, 21–27. [Google Scholar]
  8. Lee, K. What Analyzing 1 Million Tweets Taught Us. 2015. Available online: https://thenextweb.com/socialmedia/2015/11/03/what-analyzing-1-million-tweets-taught-us/ (accessed on 2 October 2018).
  9. Eboh, C. Nigeria to Rebase GDP to Determine Structure of Economy. Available online: https://www.reuters.com/article/nigeria-economy-rebasing-idAFL8N2K960S (accessed on 2 January 2021).
  10. Rao, B.L.S.P. Identifiability in Stochastic Models: Characterization of Probability Distributions; Academic Press: Cambridge, MA, USA, 1992. [Google Scholar]
  11. Henderson, J.V.; Storeygard, A.; Weil, D.N. Measuring Economic Growth from Outer Space. Am. Econ. Rev. 2012, 102, 994–1028. [Google Scholar] [CrossRef] [PubMed] [Green Version]
Figure 1. This figure shows the location from where image tweets in our data were sent from. Each blue dot represents an image tweet sent from that location. The map gives an overall indication of the countries and regions with more Twitter activity.
Engproc 39 00049 g001
Figure 2. This figure enables us to study the distribution of the residuals from our main specification from Equation (1). The figure plots the residuals of tweets on GDP, against the fitted values of that model. For clarity, only 10% of the observations in the lowest density regions are labeled.
Engproc 39 00049 g002
Table 1. Twitter data summary statistics: Mean and SD.
20122013
Tweets52,219.1245,805.3
(148,147.3)(782,123.6)
Upper-middle (51)89,123406,004.9
(201,367.9)(836,887.4)
Lower-middle (43)37,394.5209,938.9
(106,230.9)(929,686.9)
Low (28)735.93602.5
(898.9)(4370.9)
Notes: Top row shows the mean number of tweets per country and standard deviation in brackets for all developing countries in the dataset. The bottom half of the table shows the mean number of tweets and the standard deviation by country in each income group. The number of countries per income group is shown in brackets.
Table 2. Estimating country GDP for developing countries.
( 1 ) ( 2 ) ( 3 ) ( 4 ) ( 5 ) ( 6 ) ( 7 ) ( 8 )
Countries:AllLowLower-MiddleUpper-MiddleAllLowLower-MiddleUpper-Middle
ln(Tweets) 0.60 *** 0.42 *** 0.58 *** 0.67 *** 0.13 *** 0.37 *** 0.16 *** 0.05 **
( 0.02 ) ( 0.06 ) ( 0.04 ) ( 0.04 ) ( 0.02 ) ( 0.04 ) ( 0.03 ) ( 0.03 )
ln(Population) 0.51 *** 0.82 *** 0.78 *** 0.98 ***
( 0.02 ) ( 0.07 ) ( 0.04 ) ( 0.03 )
R 2 0.760.530.710.750.900.900.960.98
Adj. R 2 0.760.510.710.740.900.890.950.98
Num. obs.24456861022445686102
RMSE1.010.671.011.290.650.310.400.38
*** p < 0.01 , ** p < 0.05 . Notes: The dependent variable in all columns is the log of GDP. Using the World Bank classification, columns 2–4 and 6–8 estimate the log of GDP for the subset of low, lower-middle, and upper-middle income countries separately. Columns 5–8 control for the log of population in each country. All models include year fixed effects. Standard errors are included in parenthesis.
Table 3. Data quality issues.
Dep. var.:Residual 2
Data Quality 0.01 ***
( < 0.01 )
R 2 0.04
Adj. R 2 0.03
Num. obs.244
RMSE1.30
*** p < 0.01 . Notes: The dependent variable in columns 1–4 is the log of GDP; and in column 5 the residual squared. Using the World Bank classification, columns 1–4 estimate the log of GDP for the subset of low-income, low-middle, and upper-middle income countries combined. In column (5), I will collect the squared residuals of the estimation in column 4 and regress them on the data quality index and the log of tweets.
Table 4. Data quality issues.
20122013
Tweets64,674311,557
GDP estimates  (billions of USD)
Twitter-GDP319.9343.8
Old series240.3269.6
New series453.9509.9
Notes: First row shows the number of image tweets sent from Nigeria in 2012 and 2013, respectively. The following row shows the estimated GDP using the coefficients calculated in Equation (1) and the number of tweets. The following two rows show the official GDP estimates, using the old series as well as the new revised series. All GDP estimates are in billions of USD.
Disclaimer/Publisher’s Note: The statements, opinions and data contained in all publications are solely those of the individual author(s) and contributor(s) and not of MDPI and/or the editor(s). MDPI and/or the editor(s) disclaim responsibility for any injury to people or property resulting from any ideas, methods, instructions or products referred to in the content.

