Abstract
Nonstationary is one of the prominent phenomena in the current hydrological time series due to climate change and urban expansion. In this study, using the long time series rainfall data from rain gauges and satellite rainfall data, the trend and abrupt change of rainfall in the Taihu Lake basin, China, are examined by the Mann–Kendall (MK) test and the Pettitt test, using rain gague data. For seven water conservancy zones in this basin, the intensity–duration–frequency curves (IDFs) are obtained using satellite rainfall and the stochastic storm transposition (SST) method, providing a method for rainfall frequency analysis based on nonstationary assumption. The IDFs results between the conventional frequency analysis method with the stationary assumption and the SST-based method are compared. The results show an overall increasing trend of annual total rainfall in the Taihu Lake Basin, with significant changes at most stations. The SST-based results show a significant difference of IDFs in seven conservancy zones, which are linked to nonstationary changes in rainfall series. Our results provide an important reference for understanding the nonstationary changes and nonstationary frequency analysis of extreme rainfall in the Taihu Lake basin.
1. Introduction
With global warming and rapid urbanization, extreme hydrometeorological events, such as extreme rainfall/flood occur more frequently, with increasing intensity and severe damage in urban areas [1]. It results in the potential need to update the current design standard for hydraulic infrastructure to protect human life and property [2]. To this end, the nonstationarity-based frequency analysis of hydrological time series is of vital importance. The Taihu Lake basin contains several mega-cities and large and medium-sized cities with highly developed urban economies and highly concentrated populations [3,4]. As the urbanization process in the Taihu Lake basin further accelerates, the scale of cities expands, the area of rivers and lakes decreases dramatically, and the flood storage capacity of the basin is greatly affected. At the same time, flooding caused by extreme precipitation has become one of the key issues affecting the safe and orderly development of the region [5].
Current research on the characteristics of storms in the Taihu Lake basin is mainly based on hydrological data from ground stations [6]. However, due to the fixed location, small number, and uneven distribution of hydrological stations, the actual maximum rainfall is likely to be “missed” and the spatial heterogeneity of rainfall is difficult reflect [7]. Therefore, in the traditional urban design storm, the assumption of a spatially uniform rainfall distribution is often used to simplify the calculation [8]. However, as urbanization has accelerated in recent years, the differences in the spatial and temporal distribution of rainfall have further intensified, and it is necessary to consider the spatial distribution of rainfall to ensure the reliability of the design storm results. In this study, taking the Taihu Lake basin, which has experienced rapid urbanization in recent years, as an example, we examine the nonstationary changes in extreme rainfall time series and then propose a nonstationary-based frequency analysis.
Stochastic storm transposition (SST) is a regional rainfall frequency analysis method based on a combination of regional probabilistic resampling and spatial transformation of storms and is now widely used in various regions of the United States [9,10,11,12]. The main principle to delineate a storm-shift area with a target region as the core is to select a series of extreme rainfall events within the area as a “storm catalog”, simulate and extend the storm sequence based on a combination of probabilistic resampling and geographic shifts, and then perform frequency analysis. The main advantage of this method is that it avoids the assumption of consistency of time series required by traditional methods and, at the same time, describes the spatial variability of rainfall in addition to its intensity and magnitude, reducing the uncertainty of the design storms.
Several studies have shown that high-resolution precipitation data combined with SST methods can improve the accuracy of calculations in rainfall/flood studies. For example, Zhou [12] used 16a radar data (2000–2015) for an urban area design storm study in the Baltimore metropolitan area, USA; Wright [10] used 10a radar data (2001–2010) for a flood study in the Little Sugar Creek Watershed, USA; and Zhuang [13] used 21a radar data (2000–2020) for an urban area design storm study in Shanghai, China, all of which have been well used. This paper analyzes the spatial and temporal distribution characteristics of each conservancy zone in the Taihu Lake basin based on high-resolution satellite rainfall data and also uses the SST method for storm frequency analysis, the results of which can provide a basis for flood control planning and disaster prevention and mitigation in the basin.
2. Materials and Methods
2.1. Study Area and Data
The Taihu Lake basin is located between 118°55′~122°12′ E and 30°06′~31°53′ N. It has a total area of 36,900 km2 and is dominated by plains, which account for 4/6 of the total area; water surface accounts for 1/6; and hills account for 1/6. This study is based on the Taihu Lake basin conservancy zone as the study unit.
A total of 9 rain gauges were selected as representative rain gauges for each of the 7 conservancy zones in the Taihu Lake basin, and the 60-year (1961–2020) daily rainfall time series was used for the study. The locations of the rain gauges are shown in Figure 1.
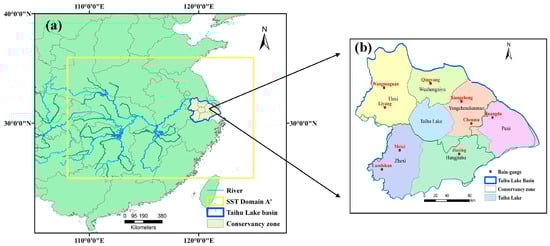
Figure 1.
Location of the study region (a). The distribution of the seven conservancy zones in Taihu Lake Basin and the location of the 9 representative rain gauges (b).
In this paper, the GPM-IMERG gridded satellite rainfall data are provided by NASA were used to study and analyze the data from 1 January 2001 to 31 December 2020, with a temporal resolution of 30 min and a spatial resolution of 0.1° × 0.1°. It has been shown that this dataset has good adaptation in China.
2.2. Research Methods
2.2.1. Nonstationary Analysis
In this paper, the Mann–Kendal test [14,15] and the Pettitt [16] variation point analysis method were used to test the trend and abrupt change points of the rainfall series, respectively, and the spatial heterogeneity and non-coherence analysis of the extreme rainfall indicators were conducted. All the above methods are widely used in the analysis of time series; the specific methods can be seen in references [16,17,18].
2.2.2. Stochastic Storm Transposition (SST) Method
The main steps in applying the SST method to a regional design storm study are summarized as follows [19]. A more detailed description of the SST method can be found in the literature [20].
(1) A region including the study area is defined as the transposition domain area A’, and it is determined that the transposition of the storm will be carried out within this area. The transposition domain should contain enough storm events, and its shape can be defined as a rectangular area or an arbitrary shape. It is usually determined based on a comprehensive analysis of the regional hydro-meteorological and geographical characteristics. The outline in Figure 2 is the selected transposition domain in this paper.
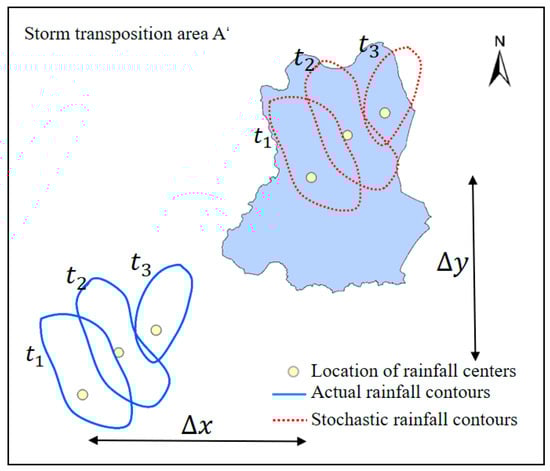
Figure 2.
Depiction of stochastic storm transposition procedures for a single storm, taking the Huxi Conservancy zone as an example.
(2) The maximum m storms (no overlapping time between rainfall events) in the transposition domain are selected from the n-year satellite rainfall series to form a subset containing spatial and temporal rainfall data as the “Storm catalog”. When A’ is a “homogeneous area”, which means that the storm has uniform characteristics in all parts of the area, the probability of storm occurrence is the same in all parts of the area. When the displacement area A’ is a “heterogeneity area”, it means that there is spatial heterogeneity in the distribution of storms in the area. The probability of storm occurrence in different parts of the transposition domain is different, and the probability magnitude is different. The probability of occurrence of storm events differs from one place to another within the transposition domin, and the probability can be determined by the location (longitude and latitude) of m storms based on the non-parametric estimation method of Gaussian kernel density. In this paper, we calculate the probability of storms shown in the figure based on the premise that the transposition domain is a “heterogeneity area”.
(3) Simulation of the “annual maximum storms” sequence. This means that storms are randomly selected from the storm catalog. The random variable is assumed to follow the Poisson distribution. The parameter of the Poisson distribution is , such as in the storm catalog in the paper; if rainfall events and years of rainfall data, then . The relative movement and evolution of the entire storm field in all periods are not changed; only the spatial location of the storm occurrence is changed (see Figure 2). After shifting, the maximum value of t–h rainfall accumulation in the target watershed A was retained as the “annual maximum storms”.
(4) Process (3) is repeated N times to construct the “annual maximum storms” sequence with a duration of t–h for N years. If we assume that the above process is repeated times, we can obtain the annual maximum storm sequence of 500a. At this time, the range of the recurrence period is 1~500a. Note that since the shifted storms are randomly selected from the storm catalog, the shifting process is also called “resampling”. Therefore, the cumulative rainfall calculated in target area A for each resampling process will not be repeated. After resampling, the “annual maximum storms” sequence is obtained for N years. The annual exceedance probability of each storm i is , and the recurrence period . The calculation results can be plotted as empirical IDF curves or input to hydrological models.
3. Results and Discussion
3.1. Nonstationary Analysis
3.1.1. Annual Rainfall Analysis
From 1960 to 2020, the annual total rainfall of rain gauges in the seven water conservancy zones in the Taihu Lake basin ranged from 521 to 2338 mm, and the average annual rainfall ranged from 1075 to 1580 mm, with a decreasing trend from southwest to northeast. The MK test showed that the annual total rainfall in more than 80% of the water conservancy zones showed non-stationary changes and an overall increasing trend. From the Pettitt test results, the annual total rainfall mainly changed abruptly in 1979 and 2008, among which the Meixi, Jiaxing, Huangdu, and Chenmu rain gauges located in the southeastern part of the Taihu Lake basin all had abrupt changes in 1979, and the Wangmuguan, Liyang, and Laoshikan rain gauges located in the western part of the Taihu Lake basin all had abrupt changes in 2008. The rainfall sequence was tested with a significance level of 0.05, and 37.5% of the rain gauges that passed the significance level test were all urban rain gauges with a high urbanization level (Table 1). The results of the nonstationary analysis are shown in Figure 3.

Table 1.
The results of the nonstationary analysis of the annual total rainfall of rain gauges in the seven water conservancy zones in Taihu Lake basin.
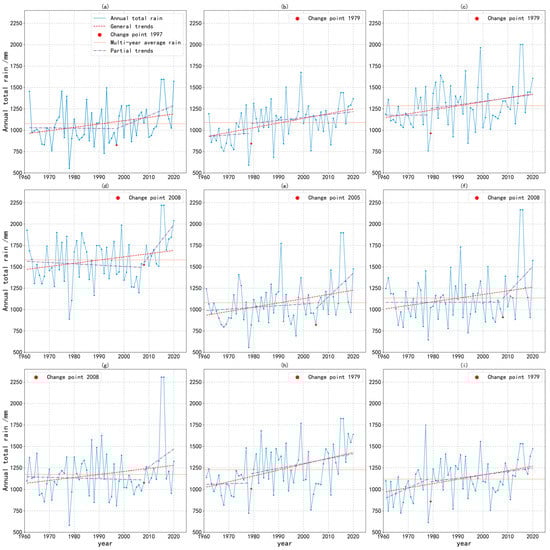
Figure 3.
The results of nonstationary analysis of the annual total rainfall of each representative rain gauge in the seven water conservancy zones in Taihu Lake basin. Analysis results for Xiangchen (a); Chenmu (b) rain-gauges in Yangchendianmao water conservancy zone; Meixi (c); Laoshikan (d) rain-gauges in Zhexi water conservancy zone; Qingyang (e) rain-gaugs in Wuchengxiyu water conservancy zone; Wangmuguan (f); Liyang (g) rain-gauges in Huxi water conservancy zone; Jiaxing (h) rain-gauge in Hangjiahu water conservancy zone; Huangdu (i) rain-gauge in Puxi water conservancy zone.
3.1.2. Extreme Rainfall Analysis
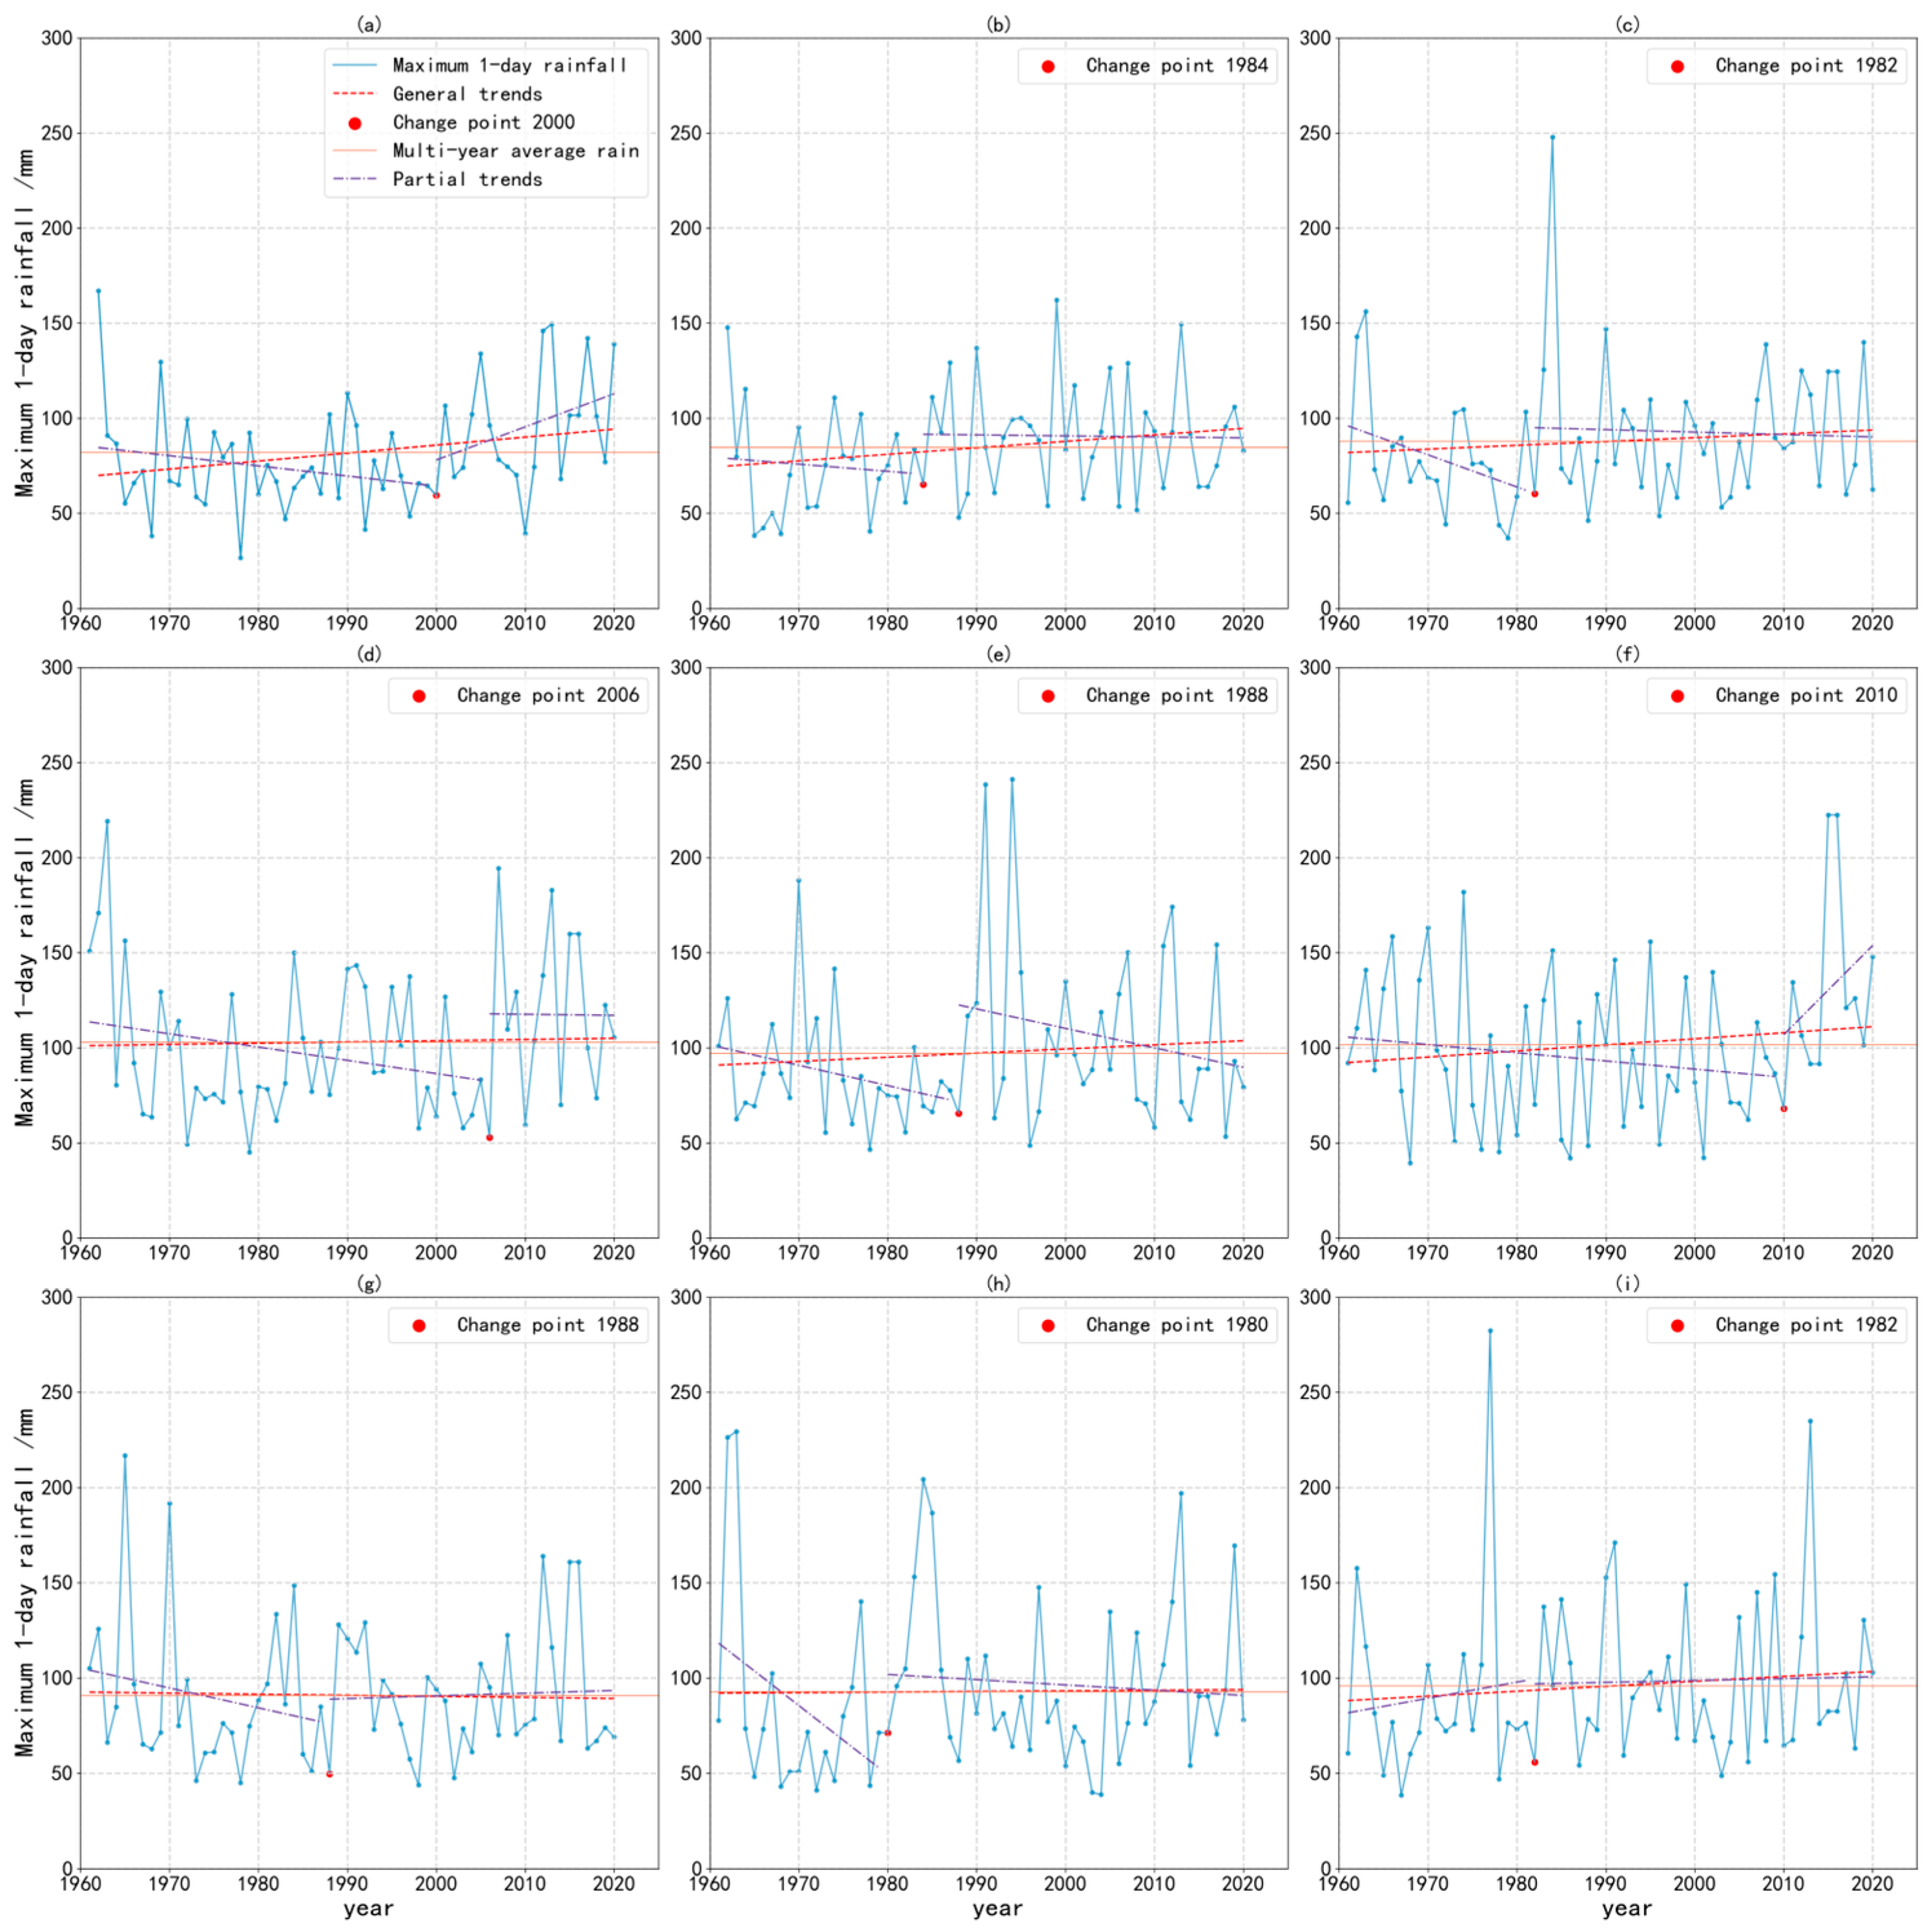
Taking the annual maximum 1-day rainfall (Rx1d) as an example, shown in Figure 4, we analyzed the extreme rainfall characteristics of the seven water conservancy zones in the Taihu Lake basin. The Rx1d at each station from 1960 to 2020 ranged from 27 to 176 mm, and comparing the Chenmu, Xiangcheng, and Huangdu stations with the Meixi and Laoshikan stations, we can obtain that the frequency of extreme rainfall is higher in areas with more urbanization. The average frequency and intensity of heavy rainfall and extreme precipitation events in the rest of the water conservancy zones, except Huxi, have shown an overall upward trend over the past 60 years, and a significant upward trend in the past 5 years, with an overall pattern of decreasing extreme rainfall from southwest to northeast, which is consistent with spatial variation in annual total rainfall.
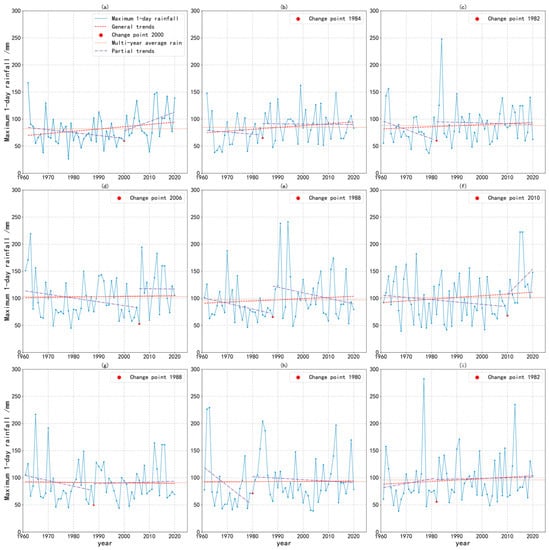
Figure 4.
The results of nonstationary analysis of the annual maximum 1-day rainfall of each representative rain gauge in the seven water conservancy zones in Taihu Lake basin, showing average rainfall, change point, the trend of rainfall before and after the change, and the overall trend of rainfall. Analysis results for Xiangchen (a); Chenmu (b) rain-gauges in Yangchendianmao water conservancy zone; Meixi (c); Laoshikan (d) rain-gauges in Zhexi water conservancy zone; Qingyang (e) rain-gaugs in Wuchengxiyu water conservancy zone; Wangmuguan (f); Liyang (g) rain-gauges in Huxi water conservancy zone; Jiaxing; (h) rain-gauge in Hangjiahu water conservancy zone; Huangdu (i) rain-gauge in Puxi water conservancy zone.
3.2. SST-Based Rainfall Frequency Analysis
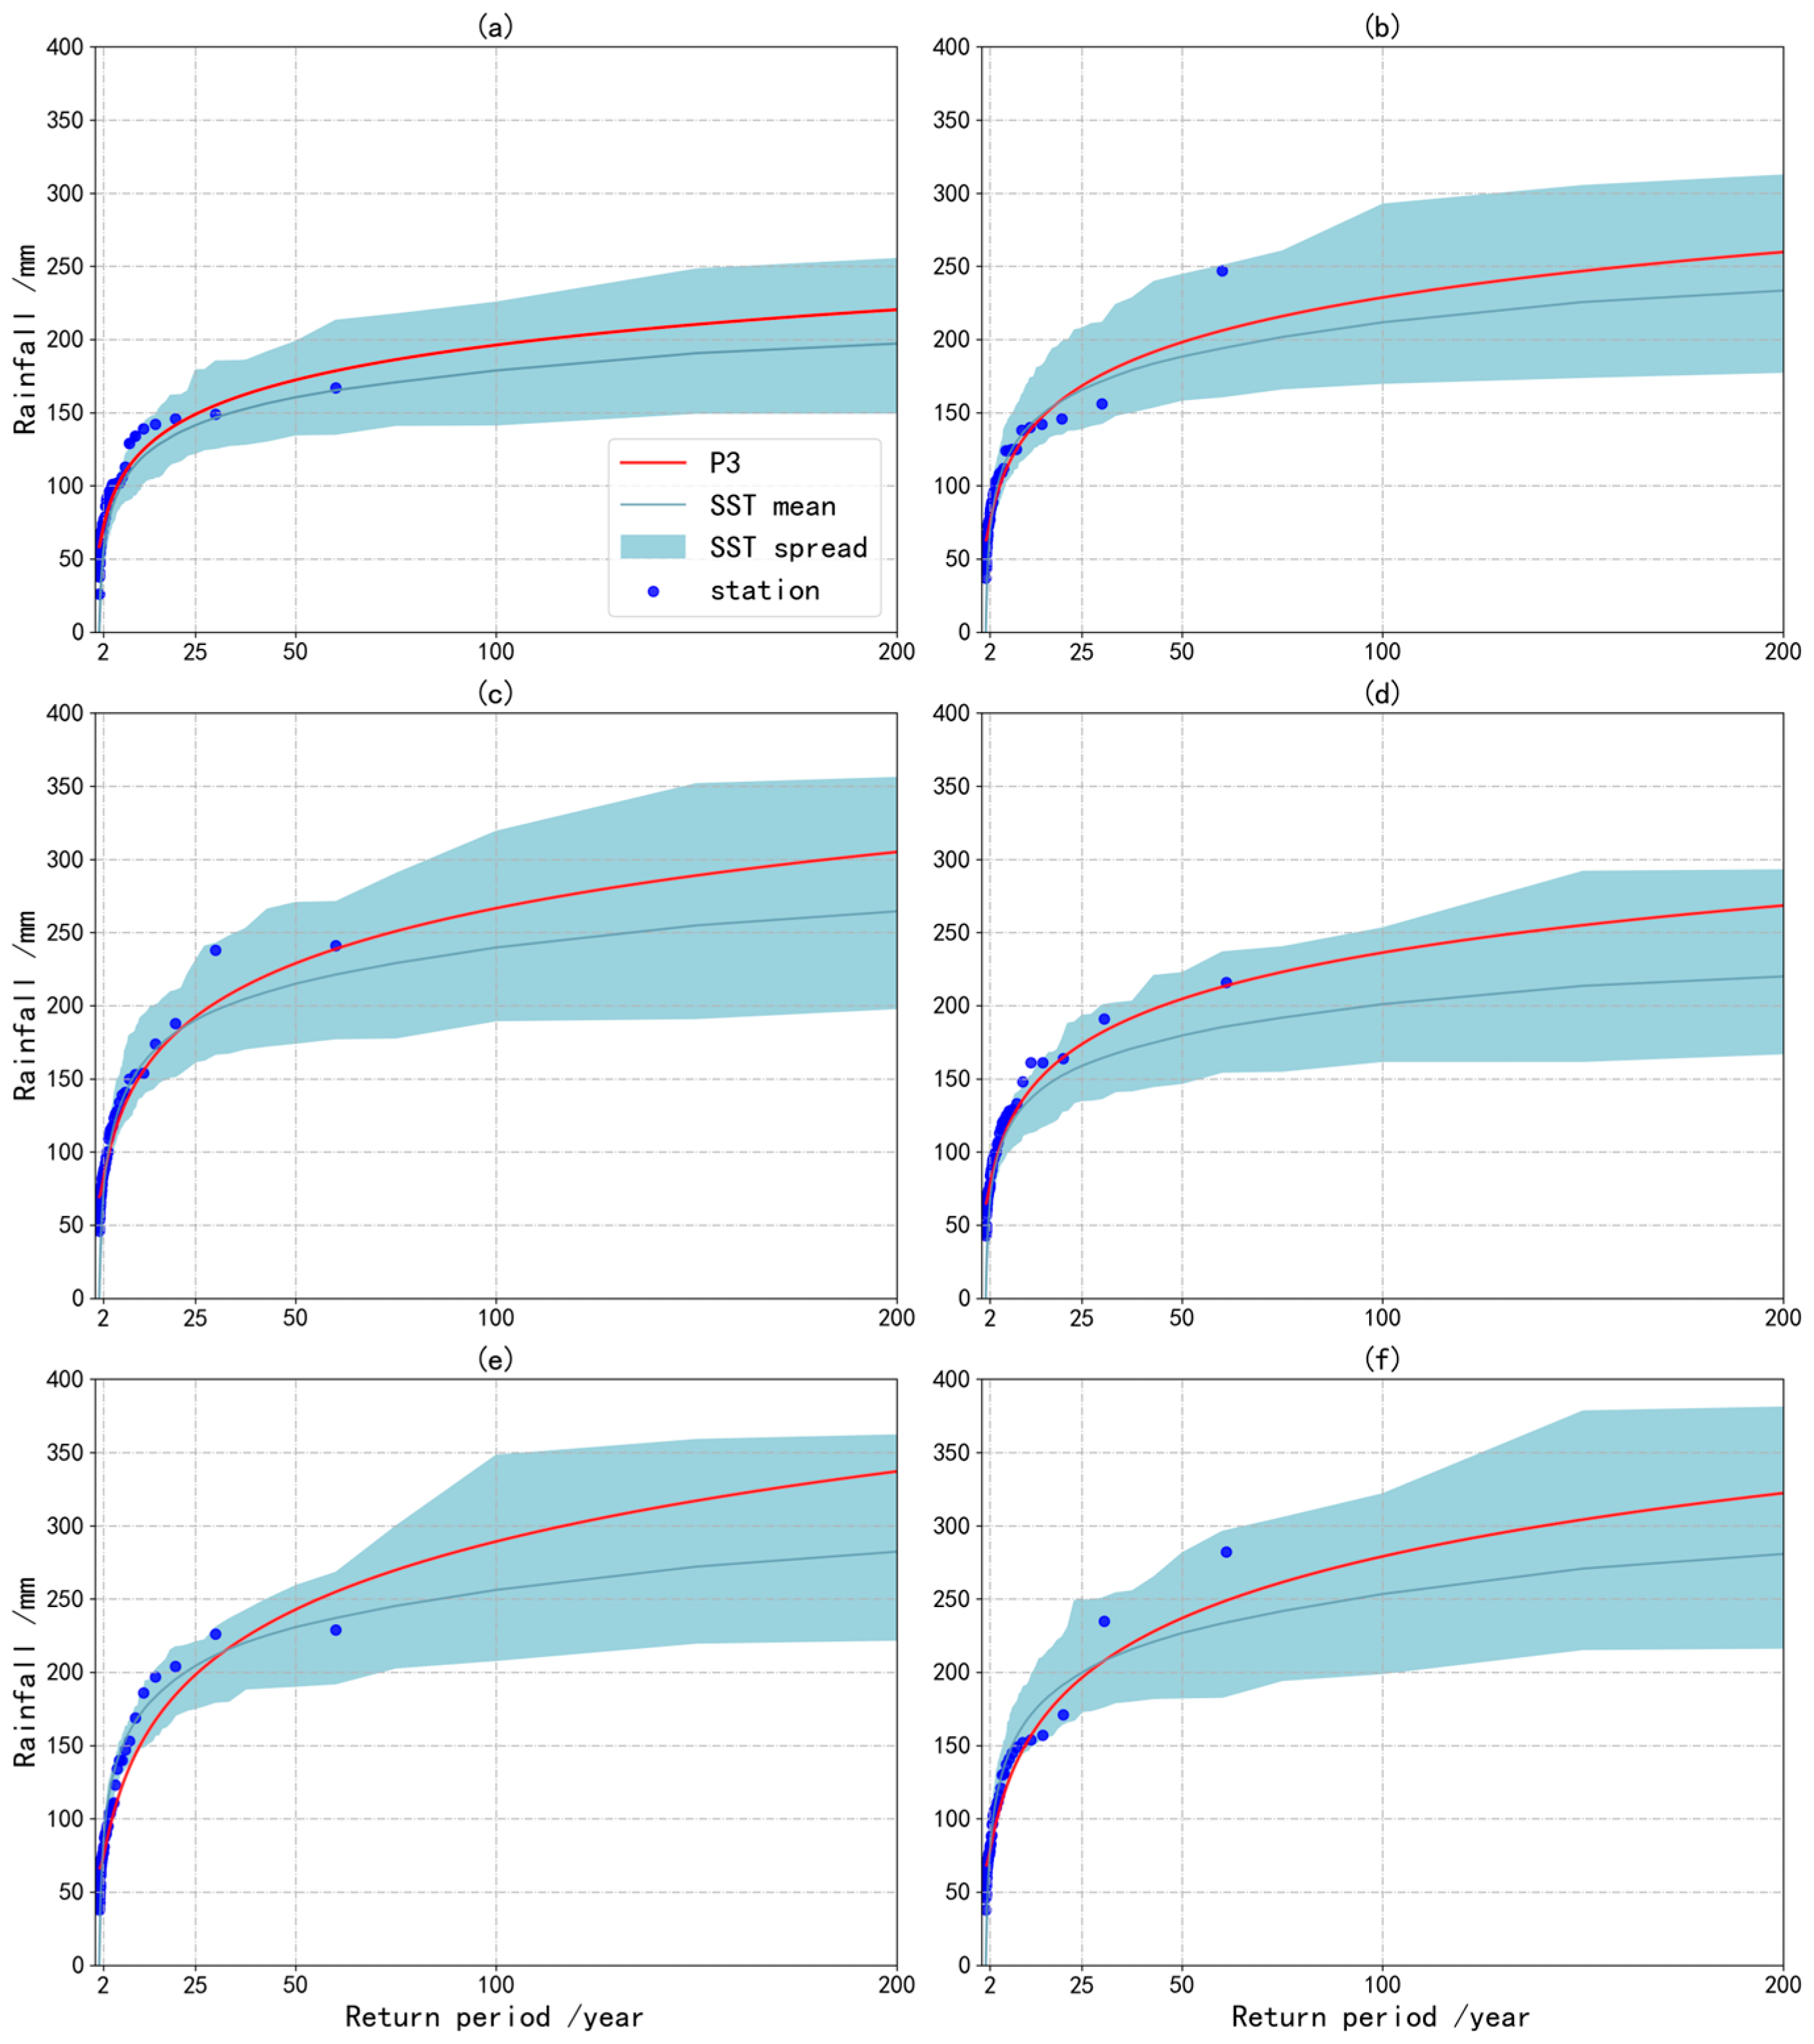
The design storm for various return periods for each conservancy zone was generated based on the storm catalog, with a duration of 3d. The upper and lower curve intervals were plotted using the 95th and 5th percentiles of the 500 estimates generated by the SST (Figure 5). The results were compared with the conventional method of moments. The figure shows that the SST estimates in each water conservancy zone were generally analogous to the moment method but slightly lower than the moment method for large return periods. Similar results have been found in previous studies [12,13,20,21]. A possible reason is that the design storm under the large recurrence period is mainly generated by a few storm events in the storm catalog after transposition; therefore, the estimates may be upper-bounded. Another reason may be due to the quality of the GPM satellite, which had a better ability to capture weak precipitation and less ability to detect heavy precipitation [22]. Therefore, the design results of the SST are reasonable from a comprehensive viewpoint. It is advisable to increase the proportion of extreme storm events in the storm catalog or improve the accuracy of rainfall data to improve the accuracy of the SST for designing storms. In different regions, due to climate variations, each parameter shows different effects on the design results, and further solutions to the problems of SST uncertainty analysis and design storm underestimation are needed for deeper research.
Figure 5.
Comparison of IDF estimates between SST and moment method for Yangchendianmao (a), Zhexi (b), Wuchengxiyu (c), Huxi (d), Hangjiahu (e), and Puxi (f) water conservancy zones.
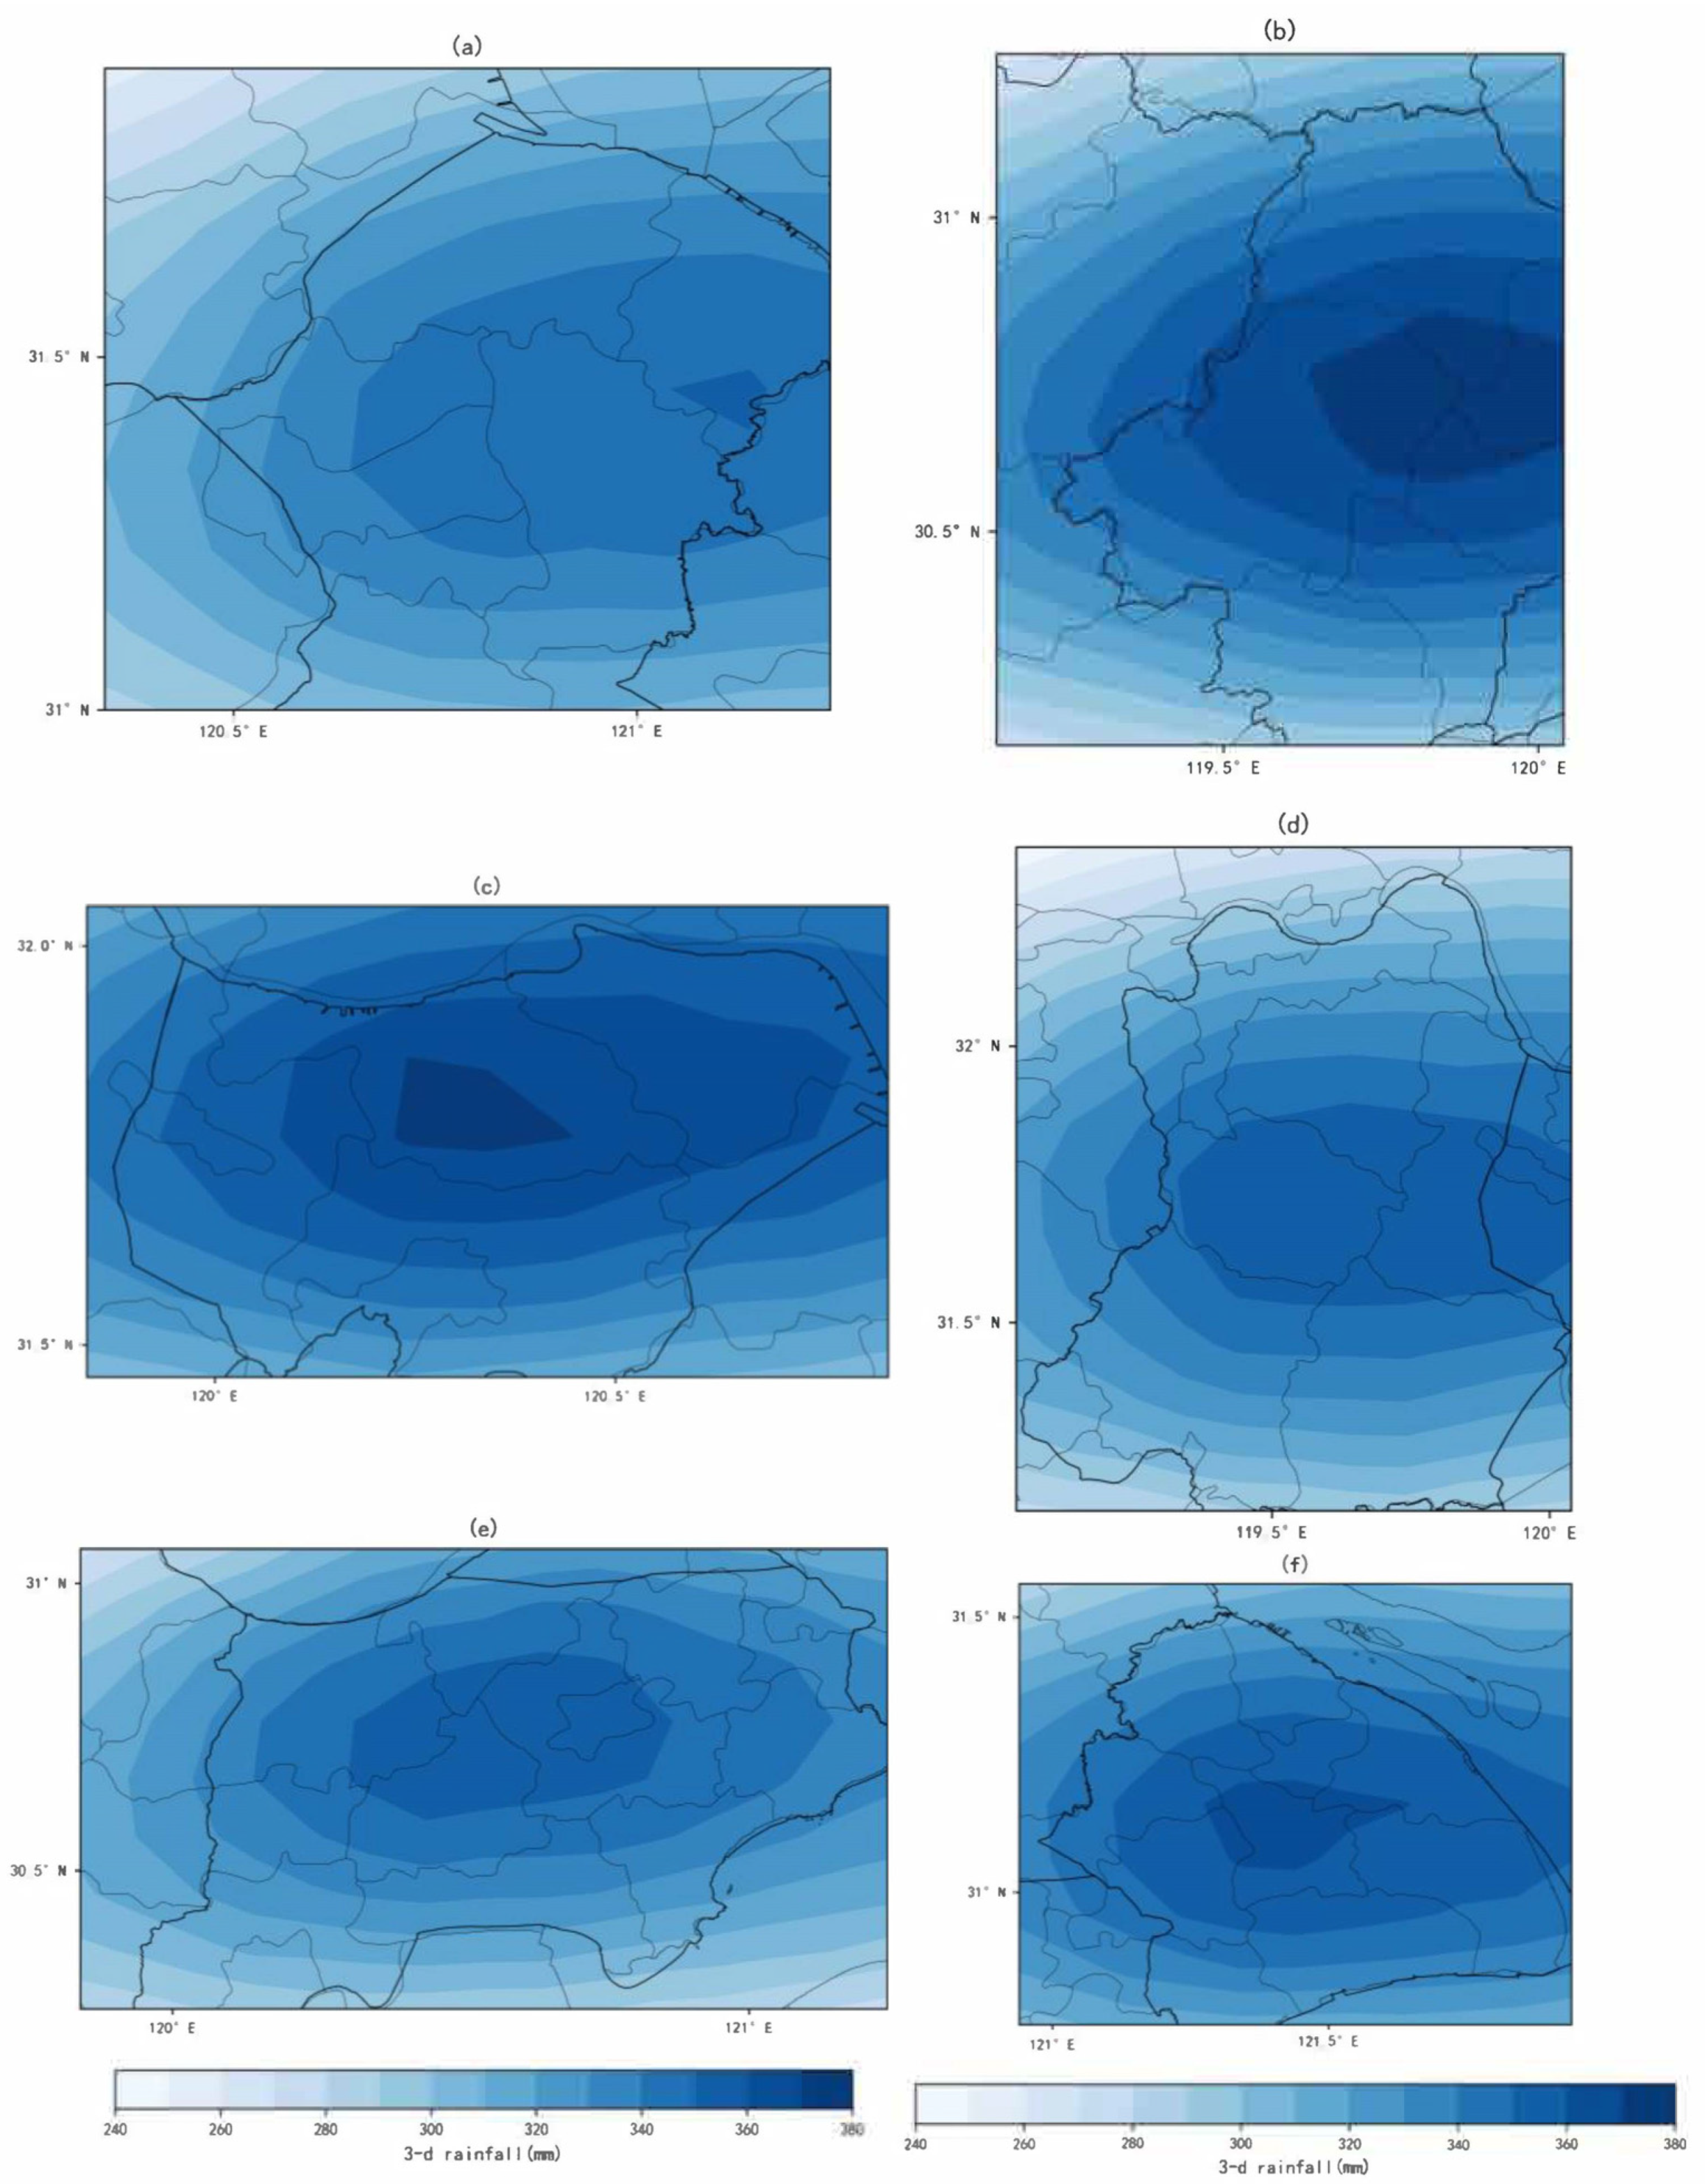
A design storm generated by the conventional method generally only considers the intensity and duration of rainfall, simplifying the spatial distribution of rainfall and the temporal variation, which restricts the accuracy of a design storm/ design flood. The SST method, on the other hand, can estimate the spatial distribution of rainfall (see Figure 6). For design storm calculations in large-scale basins, the heterogeneity of rainfall spatial distribution is significant. Currently, the SST method is used at the watershed level for de-sign storm calculations in major watersheds in the United States; and in China, it is applied mainly at the urban level. Taking 3d rainfall with a return period of 200 years as an example, the design storms are mainly concentrated in urban areas, and the more developed the urbanization is, the more heterogeneous the spatial distribution of the design storms in the water conservancy zones.
Figure 6.
Spatial distribution of 3d rainfall estimation at 200-year return period for Yangchendianmao (a), Zhexi (b), Wuchengxiyu (c), Huxi (d), Hangjiahu (e), and Puxi (f) water conservancy zones.
The SST design storm calculation for the Taihu Lake basin based on the water conservancy zone unit improves the accuracy of the calculation results as well as the reference value compared with the traditional design storm calculation for the whole basin and has a certain reference value for the design storm calculation for the basin with complex topography, a large area, and uneven economic development status within the basin. It can be seen that there is inhomogeneity in the spatial distribution of design storms, which is more significant under large recurrence periods.
4. Conclusions
(1) The average annual rainfall in the Taihu Lake basin was approximately 1265 mm for the 1960–2020 period. The rainfall has increased rapidly in the past 10 years. In recent years, the rainfall centers in the Taihu Lake basin have been concentrated in the Puxi and Yangchengdian Mao areas, showing a decreasing trend from Puxi to the surrounding areas.
(2) Rainstorms in the Taihu Lake basin are still mainly localized, concentrated in the more urbanized areas, the southwestern mountainous and southeastern coastal areas, and the northeastern areas, such as Yangchengdianmao. The western part of the lake has relatively few rainstorms. It is recommended that flood control and drainage in the city center be strengthened in the future.
(3) The SST results show that the rainfall in each water conservancy zone is mainly concentrated in the urban area, gradually decreases in the surrounding area, and is influenced by the topography. The spatial distribution variability of rainfall in the long duration is large, and the heterogeneity in spatial distribution is more significant under the large return periods.
(4) Future work could focus on the error uncertainty analysis and correction method of satellite data in the SST method, further improve the calculation accuracy of the SST method, and combine the SST method with the basin subsurface data for analysis.
Author Contributions
Conceptualization, Y.J. and S.L.; methodology, Z.Z. and Q.Z.; software, Y.J.; validation, Y.J., Z.Z. and Q.Z.; formal analysis, Y.J.; investigation, S.L.; resources, S.L.; data curation, G.Z.; writing—original draft preparation, Y.J.; writing—review and editing, Z.Z.; visualization, Y.J.; supervision, S.L.; project administration, S.L.; funding acquisition, S.L. and G.Z. All authors have read and agreed to the published version of the manuscript.
Funding
This research was funded by the National Natural Science Foundation of China, grant number 42271031.
Institutional Review Board Statement
Not applicable.
Informed Consent Statement
Not applicable.
Data Availability Statement
Data is available at [23].
Conflicts of Interest
The authors declare no conflict of interest. The funders had no role in the design of the study, in the collection, analysis, or interpretation of data, in the writing of the manuscript, or in the decision to publish the results.
References
- IPCC. Climate Change 2022: Impacts, Adaptation and Vulnerability; IPCC: Paris, France, 2022. [Google Scholar]
- Zuo, H.; Lu, S.; Hu, Q. Trend analysis of temperature and precipitation in China in the last 50 years. Plateau Weather 2004, 2, 238–244. [Google Scholar]
- Dai, S.; Zhang, Y. Flooding characteristics and mitigation measures in Taihu Lake Basin. In Proceedings of the Taihu Advanced Forum, Shanghai, China, 2 December 2004; pp. 88–93. [Google Scholar]
- Taihu Basin Authority of Ministry of Water Resources. Taihu Lake Basin and Southeast Rivers Water Resources Bulletin 2018; Taihu Basin Authority of MWR: Shanghai, China, 2019.
- LI, L.; Hu, Q.; Wang, Y.; Liu, Y.; Zhu, Y.; Wang, L.; Cui, T. Spatial and temporal distribution characteristics of water production changes in the Taihu Lake basin during rapid urbanization. Lake Sci. 2019, 31, 1289–1298. [Google Scholar]
- Zhan, Y. Taihu Lake Basin Wucheng Xiyu District Flood Control Planning. Master’s Thesis, Hohai University, Nanjing, China, 2005. [Google Scholar]
- Wang, C.; Zhai, P. Preliminary analysis of changes in extreme heavy precipitation events in major cities in China. Clim. Environ. Stud. 2009, 14, 553–560. [Google Scholar]
- Ji, X.; Na, Y.; Xia, C.; Shuai, C.; Yu, B.; Lin, B. Application of the generalized cumulative rainfall percentage method to the study of design storm rain patterns in the Taihu Lake region. Jiangsu Water Resour. 2020, 284, 29–32. [Google Scholar] [CrossRef]
- Smith, J.A.; Baeck, M.L.; Villarini, G.; Welty, C.; Miller, A.J.; Krajewski, W.F. Analyses of a long-term, high-resolution radar rainfall data set for the Baltimore metropolitan region. Water Resour. Res. 2012, 48. [Google Scholar] [CrossRef]
- Wright, D.B.; Smith, J.A.; Villarini, G.; Baeck, M.L. Long-term high-resolution radar rainfall fields for urban hydrology. J. Am. Water Resour. Assoc. 2014, 50, 713–734. [Google Scholar] [CrossRef]
- Yang, L.; Tian, F.Q.; Smith, J.A.; Hu, H.P. Urbansignatures in thespatial clusteringof summer heavy rainfall events over the Beijing metropolitan region. J. Geophys. Res.-Atmos. 2014, 119, 1203–1217. [Google Scholar] [CrossRef]
- Zhou, Z.; Smith, J.A.; Wright, D.B.; Baeck, M.L.; Yang, L.; Liu, S. Storm Catalog-Based Analysis of Rainfall Heterogeneity and Frequency in a Complex Terrain. Water Resour. Res. 2019, 55, 1871–1889. [Google Scholar] [CrossRef]
- Zhuang, Q.; Zhou, Z.; Liu, S.; Wright, D.B.; Araruna Junior, J.T.; Makhinov, A.N.; Makhinova, A.F. Bivariate rainfall frequency analysis in an urban Watershed: Combining copula theory with stochastic storm transposition. J. Hydrol. 2022, 615, 128648. [Google Scholar] [CrossRef]
- Kendall, M.G. Rank Correlation Methods, 2nd ed.; Springer: Berlin/Heidelberg, Germany, 1955. [Google Scholar]
- Liu, X.; Zhou, Y.; Lu, Q.; Zhao, Z.; Wen, W.; Li, C.; Wang, H.; Lu, Y.; Song, W.; Qiao, L. Method for Determining Anti-Floating and Anti-Water level Based on Mann-Kendall Trend Analysis, Involves Defining Mann-Kendall Trend Test Statistic, Calculating Z-Value of Mann-Kendall Trend Analysis Statistical Variable. CN Patent CN111877416-A, 20 November 2020. [Google Scholar]
- Pettitt, A.N. A Non-Parametric Approach to the Change-Point Problem. J. R. Stat. Soc. 1979, 28, 126–135. [Google Scholar] [CrossRef]
- Mann, H.B. Nonparametric test against trend. Econometrica 1945, 13, 245–259. [Google Scholar] [CrossRef]
- Mood, A.M. The Distribution Theory of Runs. Ann. Math. Stat. 1940, 11, 367–392. [Google Scholar] [CrossRef]
- Zhou, Z.; Liu, S.; Wright, D.B. Analysis of urban design storm based on stochastic storm transposition. Adv. Water Sci. 2020, 31, 583–591. [Google Scholar] [CrossRef]
- Wright, D.B.; Smith, J.A.; Villarini, G.; Baeck, M.L. Estimating the frequency of extreme rainfall using weather radar and stochastic storm transposition. J. Hydrol. 2013, 488, 150–165. [Google Scholar] [CrossRef]
- Zhuang, Q.; Liu, S.; Zhou, Z. The Change of Spatio-Temporal Precipitation and Rainfall Frequency Analysis in Shanghai. J. China Hydrol. 2021, 41, 74–80. [Google Scholar] [CrossRef]
- Wu, Y.; Zhang, Z.; Jin, Q. Accuracy evaluation of GPM precipitation product in Yangtze River basin. Yangtze River 2019, 50, 77–85+152. [Google Scholar] [CrossRef]
- Huffman, G.J.; Stocker, E.F.; Bolvin, D.T.; Nelkin, E.J.; Tan, J. GPM IMERG Early Precipitation L3 Half Hourly 0.1 Degree x 0.1 Degree V06; Goddard Earth Sciences Data and Information Services Center (GES DISC): Greenbelt, MD, USA, 2019.

Disclaimer/Publisher’s Note: The statements, opinions and data contained in all publications are solely those of the individual author(s) and contributor(s) and not of MDPI and/or the editor(s). MDPI and/or the editor(s) disclaim responsibility for any injury to people or property resulting from any ideas, methods, instructions or products referred to in the content. |
© 2023 by the authors. Licensee MDPI, Basel, Switzerland. This article is an open access article distributed under the terms and conditions of the Creative Commons Attribution (CC BY) license (https://creativecommons.org/licenses/by/4.0/).