
How Drivers Feel When Traversing Speed Humps under a Variety of Driving Conditions †

Abstract
:1. Introduction
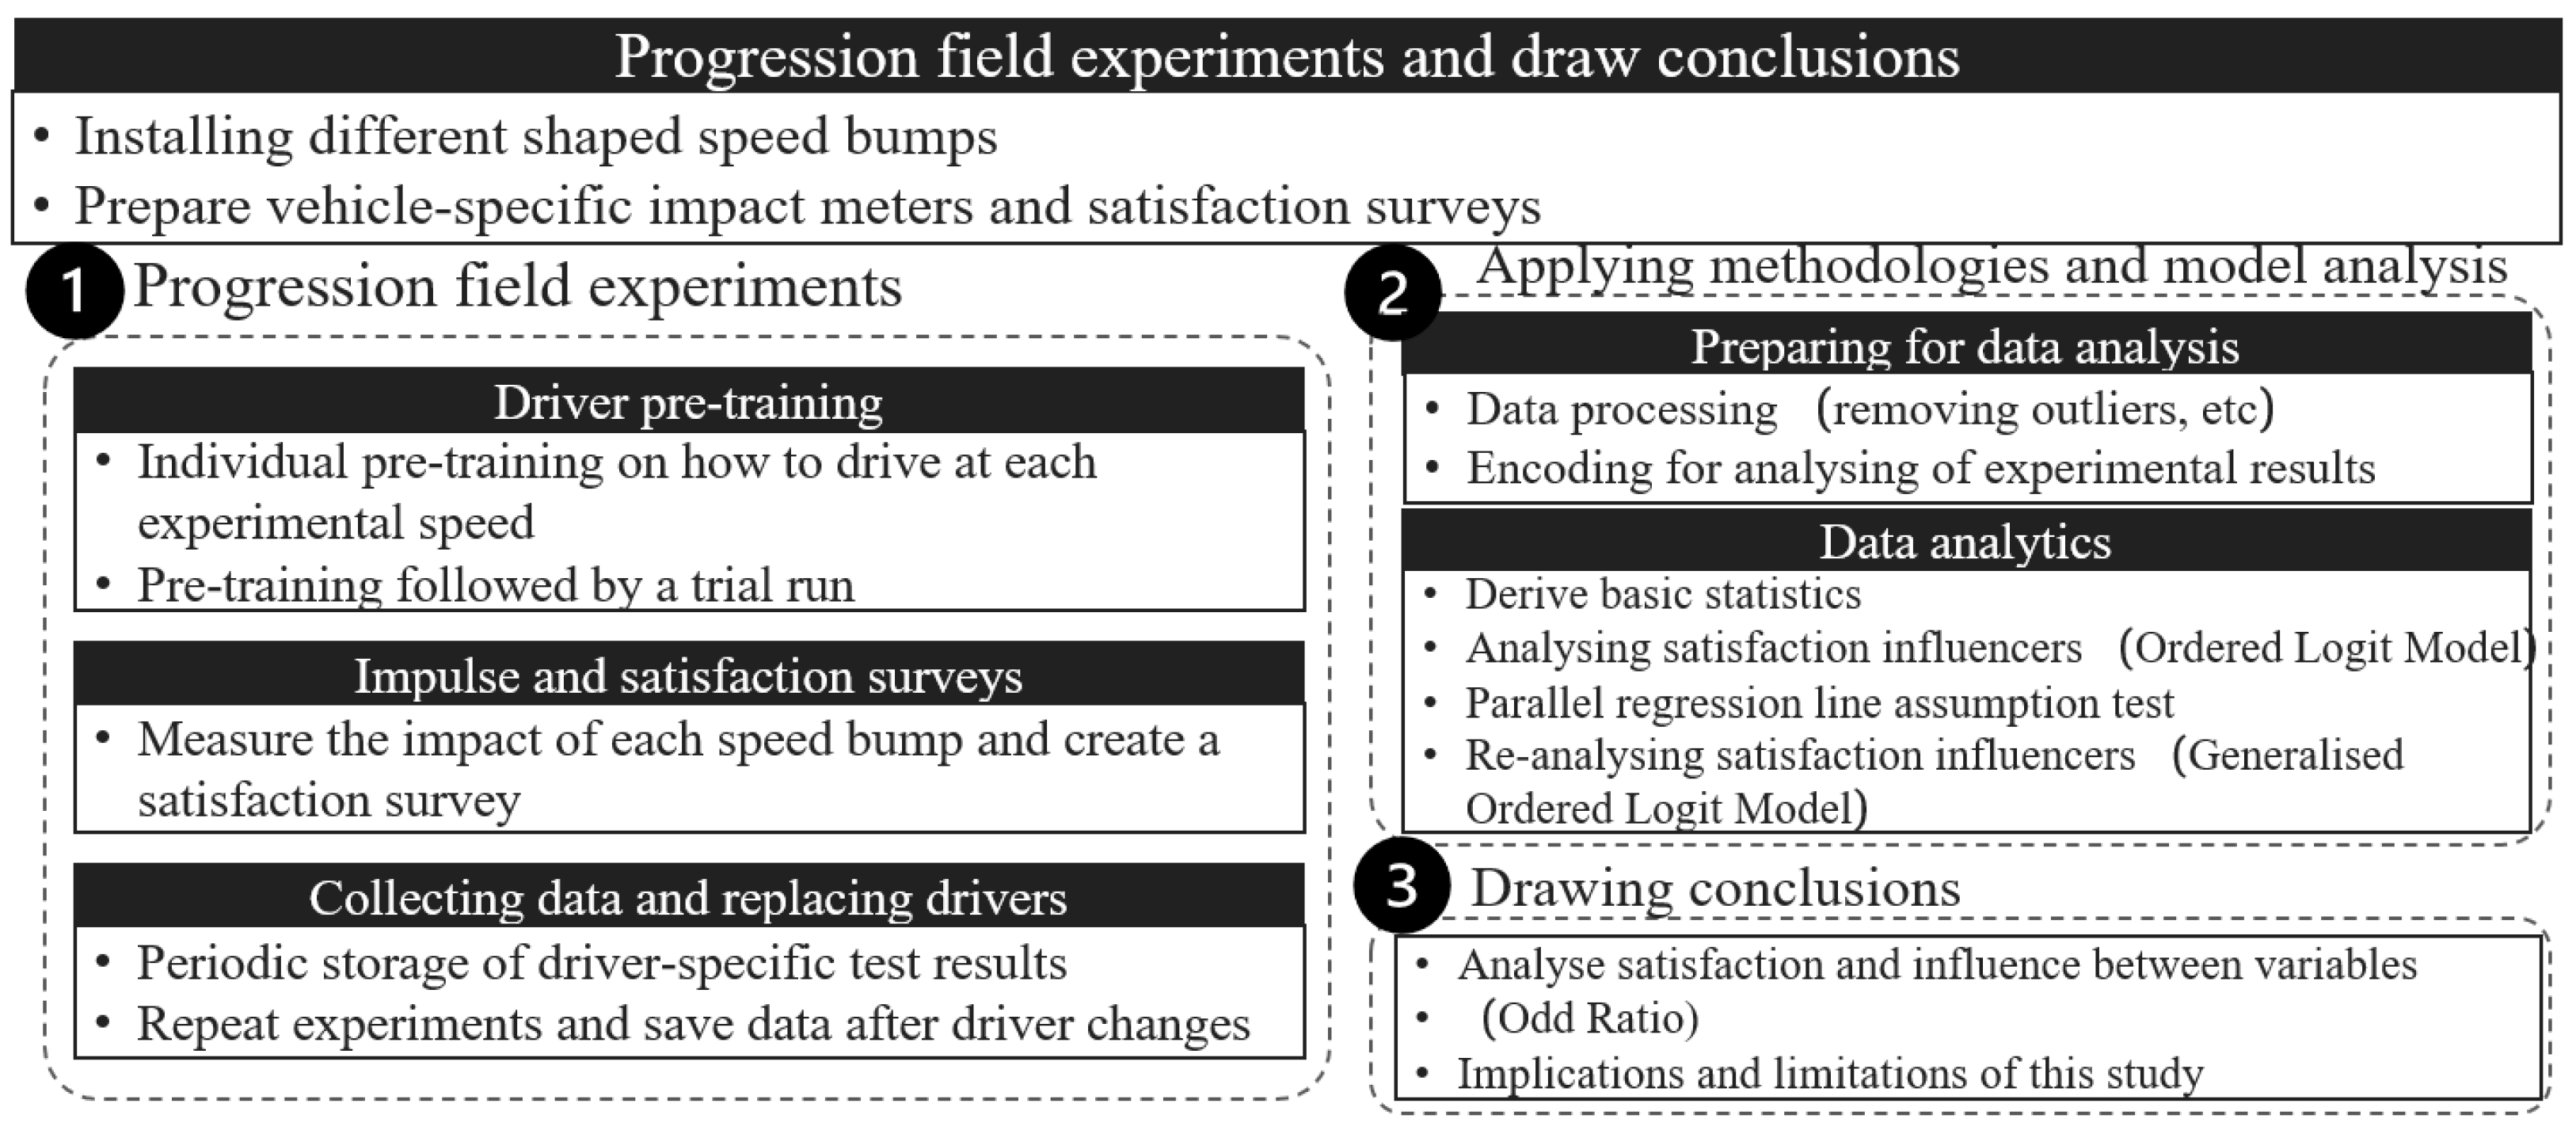
2. Methodology
3. Study Procedure
3.1. Variables
3.2. Data
4. Result
4.1. Result of Ordered Logit Model
4.2. Assessing Parallel-Line Assumption
4.3. Result of Generalized Ordered Logit Model
5. Conclusions
Author Contributions
Funding
Institutional Review Board Statement
Informed Consent Statement
Data Availability Statement
Conflicts of Interest
References
- NHTSA. Available online: https://www.nhtsa.gov/risky-driving/speeding (accessed on 28 February 2023).
- U.S. Department of Transportation Federal Highway Administration. Available online: https://highways.dot.gov/safety/speed-management/uslimits2/traffic-calming-eprimer/module-1-purpose-and-organization-eprimer (accessed on 28 February 2023).
- Ewing, R. Traffic Calming: State of the Practice ITE/FHWA; Semantic Scholar: Seattle, WA, USA, 1999; pp. 17–65. [Google Scholar]
- Amirarsalan, M.M.; Ali, A.K. Optimization of Speed Hump Profiles Based on Vehicle Dynamic Performance Modeling. J. Transp. Eng. 2014, 140, 04014035. [Google Scholar] [CrossRef]
- Philip, A.W.; John, P.B. Toward a North America Geometric Design Standard for Speed Humps. ITE J. 2000, 70, 30–34. [Google Scholar]
- Ufuk, K. Vibration Levels Exposed at Speed Bump and Speed Hump Transitions. AKU J. Sci. Eng. 2022, 22, 332–341. [Google Scholar]
- Milan, A. Speed Hump Spine Fractures: Injury Mechanism and Case Series. J. Spinal Disord. Tech. 2011, 24, 332–341. [Google Scholar]
- Emad, K.; Mohammed, A. Performance analysis of speed control humps and dips based on health and comfort criteria. J. Veh. Noise Vib. 2017, 13, 295. [Google Scholar]
- Abdulgazi, G.; Ertugrul, B.; Abdullah, H.L. An investigation into the effect of parabolic speed hump profiles on ride comfort and driving safety under variable vehicle speeds: A campus experience. Sustain. Cites Soc. 2019, 45, 413–421. [Google Scholar]
- Ali, A.K.; Amirarsalan, M.M. Simulation Modeling of Dynamic Response of Vehicles to Different Types of Speed Control Humps. In T&DI Congress 2014; Amiy, V., Geoffrey, D.G., Eds.; ASCE Library: Reston, VI, USA, 2014; pp. 533–542. [Google Scholar]
- Getahun, E.A.; Morgan, H.S. Use of generalized ordered logistic regression for the analysis of multidrug resistance data. Prev. Vet. Med. 2015, 121, 374–379. [Google Scholar]
- Kang, E.N.; Maeng, J.Y. A Study on Factors Influencing Job-Seeking Behavior of Unemployed People with Disabilities: Application of ICF Analysis Framework. Disabil. Employ. 2011, 21, 103–129. [Google Scholar]
- Ha, S.S.; Park, B.H. Comparative Analysis of Accident Severity Using Ordinal Logit Model, 「National Territorial Planning」. J. Korean Natl. Land Urban Plan. Assoc. 2011, 46, 183–192. [Google Scholar]
- Cho, J.Y. Factors Affecting Food Insecurity in the Elderly: Application of Ordinal Logit Regression Analysis. Health Soc. Res. 2015, 35, 375–406. [Google Scholar]

| Variables | Description | Measurement |
|---|---|---|
| Satisfaction | Driver’s satisfaction through poll | Dissatisfy = 1, Neutral = 2, Satisfy = 3 |
| speed humps | 4 type of speed humps passed by drivers (dummy variable) | |
| type_A | Passing type A = 1, else = 0 | |
| type_B | Passing type B = 1, else = 0 | |
| type_C | Passing type C = 1, else = 0 | |
| (Passing type O: type_A, type_B, type_C = 0) | ||
| Car type | 3 type of cars with drivers (dummy variable) | |
| car_1 | Ride in a van = 1, else = 0 | |
| car_2 | Ride in a truck = 1, else = 0 | |
| (Ride in a passenger car: car_1, car_1 = 0) | ||
| Career | Driver’s driving experience | years |
| speed | Car’s speed passing speed hump | km/h |
| shock | impact the driver receives | m/ |
| Variables | type_A | type_B | type_C | car_1 | car_2 | Career | Speed | Shock | /cut1 | /cut2 |
|---|---|---|---|---|---|---|---|---|---|---|
| Coefficient | 0.3297 | 0.2665 | 0.6329 | −1.2217 | −2.4531 | 0.1763 | −0.1207 | −0.7192 | −6.3696 | −4.8559 |
| Odds ratio | 1.3905 | 1.3054 | 1.8831 | 0.2947 | 0.0860 | 1.1927 | 0.8863 | 0.4872 | −6.3696 | −4.8559 |
| p > |z| | 0.273 | 0.370 | 0.036 | 0 | 0 | 0 | 0 | 0 |
| Variables | type_A | type_B | type_C | car_1 | car_2 | Career | Speed | Shock |
|---|---|---|---|---|---|---|---|---|
| p Value | 0.0873 | 0.1906 | 0.8832 | 0.8147 | 0.0089 | 0.3633 | 0.0001 | 0.0109 |
| Variables | type_A | type_B | type_C | car_1 | car_2 | Career | Speed | Shock | Cons | |
|---|---|---|---|---|---|---|---|---|---|---|
| 1 | Coefficient | 0.3199 | 0.2793 | 0.6757 | 0.179 | −1.1583 | −3.202 | −0.1592 | −0.4809 | 7.5232 |
| Odds ratio | 1.3769 | 1.3222 | 1.9655 | 1.1961 | 0.314 | 0.0407 | 0.8528 | 0.6182 | 1850.54 | |
| p > |z| | 0.29 | 0.35 | 0.026 | 0 | 0 | 0 | 0 | 0.003 | 0 | |
| 2 | Coefficient | 0.3199 | 0.2793 | 0.6757 | 0.179 | −1.1583 | −1.9609 | −0.0985 | −0.9804 | 4.4392 |
| Odds ratio | 1.3769 | 1.3222 | 1.9655 | 1.1961 | 0.314 | 0.1407 | 0.9062 | 0.3752 | 84.7063 | |
| p > |z| | 0.29 | 0.35 | 0.026 | 0 | 0 | 0 | 0 | 0 | 0 |
Disclaimer/Publisher’s Note: The statements, opinions and data contained in all publications are solely those of the individual author(s) and contributor(s) and not of MDPI and/or the editor(s). MDPI and/or the editor(s) disclaim responsibility for any injury to people or property resulting from any ideas, methods, instructions or products referred to in the content. |
© 2023 by the authors. Licensee MDPI, Basel, Switzerland. This article is an open access article distributed under the terms and conditions of the Creative Commons Attribution (CC BY) license (https://creativecommons.org/licenses/by/4.0/).
Share and Cite
Cho, H.-j.; Na, H.-h.; Kim, D.-G. How Drivers Feel When Traversing Speed Humps under a Variety of Driving Conditions. Eng. Proc. 2023, 36, 19. https://doi.org/10.3390/engproc2023036019
Cho H-j, Na H-h, Kim D-G. How Drivers Feel When Traversing Speed Humps under a Variety of Driving Conditions. Engineering Proceedings. 2023; 36(1):19. https://doi.org/10.3390/engproc2023036019
Chicago/Turabian StyleCho, Hong-jun, Ho-hyuk Na, and Do-Gyeong Kim. 2023. "How Drivers Feel When Traversing Speed Humps under a Variety of Driving Conditions" Engineering Proceedings 36, no. 1: 19. https://doi.org/10.3390/engproc2023036019
APA StyleCho, H.-j., Na, H.-h., & Kim, D.-G. (2023). How Drivers Feel When Traversing Speed Humps under a Variety of Driving Conditions. Engineering Proceedings, 36(1), 19. https://doi.org/10.3390/engproc2023036019