1. Introduction
A significant body of empirical literature shows that the economic performance of resource-rich countries is typically inferior to that of their resource-deficient counterparts. Auty [
1], for example, found that resource-poor economies grew four times faster than big oil exporters between 1970 and 1993. In case of OPEC members, Gylfason [
2] calculated that the real GDP per capita fell by an average of 1.3% between 1965 and 1998. Furthermore, examining 51 resource-rich economies during the 1990s, Weber-Fahr [
3] reported that in countries where more than 50% of export revenues came from mineral exports, the real GDP per capita declined by an average of 2.3%. This phenomenon, commonly known as the resource curse, has been explained by several theories of neoclassical economics and political economy [
4]. This study predominantly focuses on the former, as it uses statistical techniques to identify the presence of the Dutch disease in Angola.
The Dutch disease refers to the deindustrialization of a national economy as real appreciation of the domestic currency induces a loss of international competitiveness in non-resource sectors. First developed by Corden and Neary [
5], the theoretical model deals with the effects of a resource boom in a three-sector, small, open economy. As windfalls from commodity exports drive domestic demand, the relative price of non-tradables increases, causing real appreciation through the Balassa–Samuelson mechanism. Referred to as the spending effect, this change in terms of trade induces indirect deindustrialization as domestic manufactures are crowded-out by cheaper imports. Furthermore, the Dutch disease also undermines the competitiveness of agricultural tradables. Although Angola was once the fourth largest coffee exporter in the world, currently no more than 8–14% of the arable land is being utilized [
6]. Agricultural exports in 2013 counted only for 8.5% of the peak figure in 1974, while the related revenues constituted a negligible 0.4% share in the national budget [
7].
Until the end of the 2014 commodity supercycle, these negative effects did not have a direct impact on growth. However, the complete loss of the agricultural sector and dominance of the oil industry suggest that Angola did suffer and keeps suffering from the Dutch disease. Our aim is to address the involvement of this problem in Africa’s second largest oil exporter by examining the cointegration—i.e., long-term statistical co-movement, free of confounding factors—between oil prices and the real effective exchange rate (REER) of the national currency (the Angolan kwanza)—in the framework of a nonlinear autoregressive distributed lag (NARDL) model. In other words, we are looking for signs of the spending effect to explain the lack of economic diversity. More specifically, we seek to answer the following two questions:
Can cointegration—a long-term statistical link—be detected between the real price of oil on the world market and the REER of the kwanza? We expect to find a cointegrated nexus as a remarkable symptom of the Dutch disease in Angola.
Furthermore, if this link exists, is it asymmetrical? That is, does a unit change in the price of oil affect the appreciation or depreciation of the exchange rate to a different extent? This asymmetry would suggest a long-term deterioration in terms of trade, which commonly characterizes the trade relationships of developing nations. We assume that the cointegration is asymmetrical, and that the amplitude of appreciation is higher than that of depreciation.
2. Data and Methods
In the related empirical literature, the technique of cointegration is typically used to detect a long-term statistical relationship between commodity prices and different real effective exchange rates [
8,
9]. This procedure filters out the intermittent local co-movements caused by accidental fluctuations, which otherwise would result in biased and inconsistent estimations [
10,
11]. Based on Shin et al. [
12], we formulated our error correction model using an asymmetrical form so that we could address both research questions outlined in the introduction.
To develop the asymmetric distributed lag model, first we broke down the logarithm of the real price of oil on the world market (
) into partial sum processes by separating the positive (
) and negative (
) changes:
If we add up the time series produced by Equations (1) and (2), we obtain our original
series. The
error term representing the deviation from the long-term stochastic equilibrium can be calculated as the difference between
, the real affective exchange rate, and the logarithms of the decomposed oil price [
12]:
To estimate both the long- and short-term effects, we used the following equation:
Equation (4) was used to estimate the long-term asymmetry parameters of Equation (5), and , which are based on and , respectively. Parameter in Equation (5) measures the convergence rate of return to the common stochastic equilibrium, a phenomenon that occurs when this parameter is negative and statistically significant.
In summary, the relationship between the real effective price of the kwanza and the real price of oil—and thus the presence of the Dutch disease—is confirmed if parameter is significant and negative. Furthermore, if the estimates for parameters and are significantly different, the model verifies the presence of asymmetry.
For the exchange rate, we used the Bruegel Institute’s REER time series, while nominal oil prices were derived from the World Bank’s pink sheet databank and converted to real terms using the consumer price index from the IMF’s IFS statistics database. Thus, we obtained monthly time series data for the period between January 2005 and December 2018.
3. Results
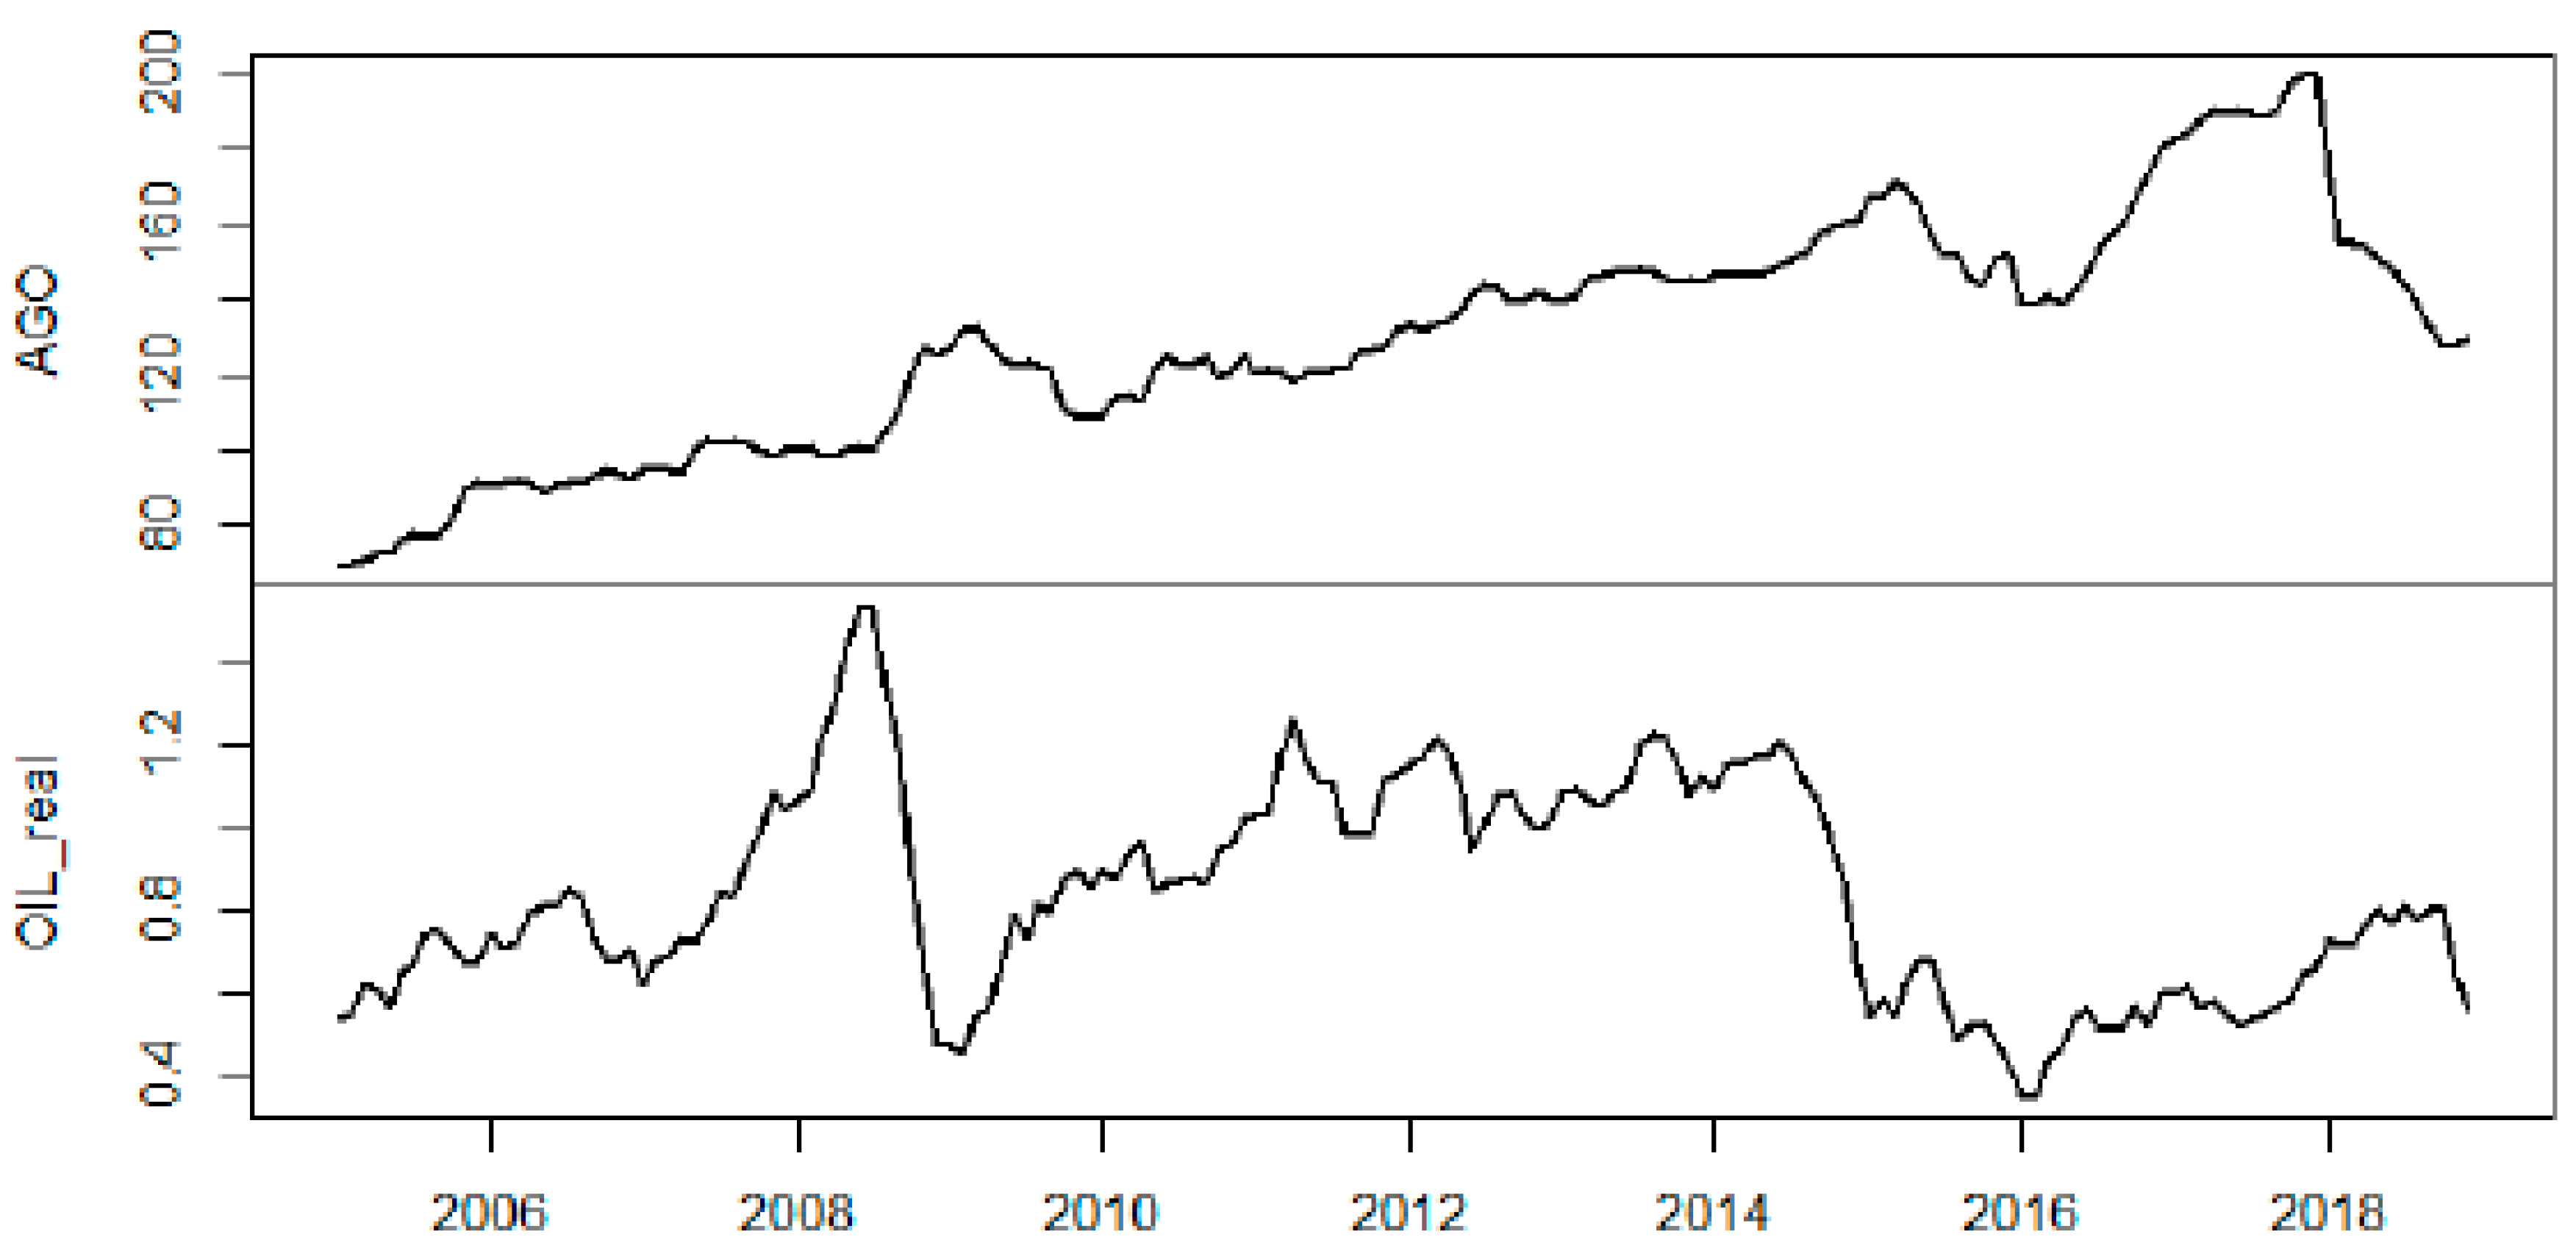
The upper section of
Figure 1 demonstrates the quasi-permanent appreciation of the kwanza, while the lower section shows the effects of the financial crisis on the oil price, as well as the end of the 2014 supercycle. In order to establish a link between the variables, we examined the time series in terms of stationarity and cointegration.
Based on our model, the ADF and Phillips–Perron postestimation tests augmented with an intercept were unable to reject the null hypothesis that the time series contained a unit root at a 5% significance level (
,
,
). The 5.73 statistic of the Pesaran–Shin–Smith (PSS) test for asymmetric cointegration exceeded the upper critical value of 3.23 and thus indicated hidden cointegration [
13].
The fit of the estimated model shown in
Table 1 was satisfied with an adjusted
of 15%. In addition, all postestimation tests were passed and there were no signs of autocorrelation (
) nor ARCH effect (
). The value of the
convergence parameter was, as the theory suggested, significant and negative with a value of −0.05, indicating cointegration and a slow return to the joint equilibrium. Furthermore, the model was symmetrical, that is, we were not able to reject the null hypothesis of the long-term asymmetry test at any conventional significance level (
).
4. Discussion
The oil sector in Angola counts for one-third of the GDP and more than 90% of export revenues. This extreme oil-dependency raises serious doubts since reserves are expected to be depleted by 2032 at current production levels [
7]. At the same time, economic growth is clearly linked to the dynamics of international oil prices and has been fuelled by extraction since oil production doubled between 2002 and 2008. The 2014 oil price slump, however, revealed the unsustainability of the oil-based growth strategy. While Angola enjoyed an average annual growth rate of more than 8% between 2002 and 2014, the GDP declined by 0.98% yearly between 2015 and 2018. Currently, macro-stability is threatened by indebtedness, a decline in production, and a lack of foreign investments due to corruption.
The model shown in
Table 1 supports our first hypothesis about the cointegration of oil prices and the kwanza REER, indicating a long-term statistical relationship. This result suggests that the Dutch disease is present and evolves through the spending effect. The subsequent deindustrialization exposes the country to the volatility of international commodity prices and divests the economy from the positive spillovers associated with manufacturing. Ultimately, Angola becomes even more dependent on the natural resource, which poses substantial risks to long-term economic growth. On the other hand, we did not find statistically significant evidence of asymmetry, that is, the effects of oil price shocks on the exchange rate are symmetrical. This result suggests that there is no long-term deterioration in terms of trade and oil price plunges still provide an opportunity to restore the competitiveness of non-resource sectors. Conclusively, policies aimed at diversifying the economy of Angola have the highest potential when international oil prices are low.
Author Contributions
Conceptualization, Z.B. and L.S.; Methodology, T.B.; Formal analysis, T.B.; Investigation, Z.B. and L.S.; Writing–original draft preparation, L.S. and T.B.; Writing–review and editing, L.S. All authors have read and agreed to the published version of the manuscript.
Funding
This research received no external funding.
Institutional Review Board Statement
Not applicable.
Informed Consent Statement
Not applicable.
Data Availability Statement
Not applicable.
Conflicts of Interest
The authors declare no conflict of interest.
References
- Auty, R.M. Natural Resource Endowment, the State and Development Strategy. J. Int. Dev. 1997, 9, 651–663. [Google Scholar] [CrossRef]
- Gylfason, T. Natural Resources and Economic Growth: From Dependence to Diversification. In Economic Liberalization and Integration Policy; Broadman, H.G., Paas, T., Welfens, P.J.J., Eds.; Springer: Berlin/Heidelberg, Germany, 2006; pp. 201–231. [Google Scholar] [CrossRef]
- Weber-Fahr, M. Treasure or Trouble? Mining in Developing Countries; World Bank: Washington, DC, USA, 2002. [Google Scholar]
- Szalai, L. A Review on the Resource Curse. Period. Polytech. Soc. Manag. Sci. 2018, 26, 179–189. [Google Scholar] [CrossRef]
- Corden, M.W.; Neary, P.J. Booming Sector and De-Industrialisation in a Small Open Economy. Econ. J. 1982, 92, 825–848. [Google Scholar] [CrossRef]
- Kyle, S. Angola’s Macroeconomy and Agricultural Growth; (No. 2010–04); Cornell University: Ithaca, NY, USA, 2010. [Google Scholar]
- Fiess, N.; Alnafeesi, A.; Barroso, R.; Calderon, C.; Didier, T.; Engelke, W.; Trost, M. Angola: Country Economic Memorandum; World Bank: Washington, DC, USA, 2018. [Google Scholar]
- Barczikay, T.; Biedermann, Z.; Szalai, L. An investigation of a partial Dutch disease in Botswana. Resour. Policy 2020, 67, 101665. [Google Scholar] [CrossRef]
- Jahan-Parvar, M.R.; Mohammadi, H. Oil Prices and Real Exchange Rates in Oil-Exporting Countries: A Bounds Testing Approach. J. Dev. Areas 2011, 45, 313–322. [Google Scholar] [CrossRef]
- Granger, C.; Newbold, P. Spurious regressions in econometrics. J. Econom. 1974, 2, 111–120. [Google Scholar] [CrossRef]
- Hendry, D. Econometrics-Alchemy or Science? Economica 1980, 47, 387–406. [Google Scholar] [CrossRef]
- Shin, Y.; Yu, B.; Greenwood-Nimmo, M. Modelling Asymmetric Cointegration and Dynamic Multipliers in a Nonlinear ARDL Framework. In Festschrift in Honor of Peter Schmidt; Springer: New York, NY, USA, 2014. [Google Scholar] [CrossRef]
- Pesaran Shin, Y.; Smith, R.J. Bounds testing approaches to the analysis of level relationships. J. Appl. Econom. 2001, 16, 289–326. [Google Scholar] [CrossRef]
| Disclaimer/Publisher’s Note: The statements, opinions and data contained in all publications are solely those of the individual author(s) and contributor(s) and not of MDPI and/or the editor(s). MDPI and/or the editor(s) disclaim responsibility for any injury to people or property resulting from any ideas, methods, instructions or products referred to in the content. |
© 2023 by the authors. Licensee MDPI, Basel, Switzerland. This article is an open access article distributed under the terms and conditions of the Creative Commons Attribution (CC BY) license (https://creativecommons.org/licenses/by/4.0/).


