Proceeding Paper

Forecasting the Case Number of Infectious Diseases Using Type-2 Fuzzy Logic for a Diphtheria Case Study †

by
Wiwik Anggraeni
1,*,
Maria Firdausiah
1 and
Muhammad Ilham Perdana
2
1
Department of Information Systems, Institut Teknologi Sepuluh Nopember, Surabaya 60111, Indonesia
2
Department of Informatics, Universitas Muhammadiyah Malang, Malang 65145, Indonesia
*
Author to whom correspondence should be addressed.
Presented at the 9th International Conference on Time Series and Forecasting, Gran Canaria, Spain, 12–14 July 2023.
Eng. Proc. 2023, 39(1), 3; https://doi.org/10.3390/engproc2023039003
Published: 25 June 2023
(This article belongs to the Proceedings of The 9th International Conference on Time Series and Forecasting)

Abstract

:
Diphtheria is an infectious disease with a high mortality rate. In Indonesia, the number of diphtheria cases has remained relatively high in recent years, so efforts to prevent and control diphtheria are needed. Forecasting of the number of diphtheria cases was carried out in this study by applying a type-2 fuzzy logic systems method. Forecasting in this study was carried out by involving the variables of the number of diphtheria sufferers, the percentage of immunization coverage comprising four immunization types, and population density. Regions are grouped into three clusters based on the number of cases that have occurred. Each cluster is taken and sampled in the form of one region to acquire a robust model for other regions. The forecasting results for the next 24 periods show that the performance of the type-2 fuzzy logic systems method is quite good, with accuracy values in the Malang area showing an MSE of 8.785 and an SMAPE of 54.91%. In the Surabaya area, the forecasting accuracy results have an MSE value of 14.940 and an SMAPE of 35.51%. In the Sumenep area, the forecasting accuracy results show an MSE value of 2.188 and an SMAPE of 67.63%. The results of the forecasting of the number of cases can be used as a guide in planning and making decisions regarding the prevention and management of diphtheria.

1. Introduction

Diphtheria is a disease caused by the bacterium Corynebacterium diptheriae [1]. This disease is classified as a contagious disease and can cause death in sufferers. Diphtheria can be transmitted directly through physical contact with sufferers or through a patient’s aerosol fluids [2]. The disease primarily affects the nose, throat, and airways, resulting in difficulty breathing, fever, and the formation of a thick coating in the throat [1,2]. In addition, diphtheria is a type of communicable disease that requires surveillance activities for prevention [3] and control as soon as possible; it is necessary to study how vaccination affects diphtheria [4].
In recent years, Asia has seen outbreaks and an increase in the prevalence of diphtheria [5]. According to the WHO, Indonesia is in the top ten countries with the most diphtheria cases. In terms of case numbers, Indonesia is in third position, after India and Nepal [6]. In Indonesia, the number of diphtheria cases is high, sometimes leading to outbreaks. The province with the largest number of sufferers is East Java, where there is a fairly high mortality rate [7].
The high number of diphtheria cases in Indonesia, especially East Java, requires efforts to prevent and control diphtheria to reduce the number of diphtheria cases. In order to carry out good planning in efforts to prevent and control diphtheria, forecasting of the number of cases is carried out. The results of this forecasting can later be used as the basis for decision-making related to efforts to prevent and control diphtheria. So far, the prevention efforts of the Health Service have come in the form of immunizations to minimize the number of occurrences of diphtheria. However, increases in numbers of cases are still common.
So far, there are still very few studies that have predicted the number of diphtheria cases, especially those involving influential variables. Research related to diphtheria is more often focused on analyzing the impact of vaccines on public health [4,8]. Analyses are usually distinguished based on various characteristics. Our past research has tried to predict the number of diphtheria cases [9], but our best model only involved one variable, namely the number of cases in the previous period. In fact, research developments state that the risk of diphtheria can be influenced by various other factors [10].
For this reason, this study will provide forecasts of the number of diphtheria cases in various regions with different characteristics involving various influential factors, such as population density and the coverage of various types of vaccination treatments. The approach used is a fuzzy type-2 approach. This method is considered very effective in dealing with uncertainties such as linguistic uncertainty [11]. The fuzzy type-2 approach also has the ability to model problems with more complex situations [11,12]. Type-2 fuzzy systems can help to reduce the difficulties faced in modeling a system based on rules, and they make it possible to tune and increase our understanding of rule-based systems [12]. The proposed method is expected to improve system performance [13].

2. Related Works

At this time, many studies related to diphtheria have been carried out, but only a few are related to case number forecasting. So far, research related to diphtheria has focused more on analyzing the impact of diphtheria vaccine administration. Related to research on the factors involved, previous studies have stated that the risk factors that influence the occurrence of diphtheria cases are demographics [10,14], the administration of vaccines [1,14,15], and familial wealth [14]. For this reason, this research will forecast the number of diphtheria cases by involving the variables of various vaccines that have been obtained, the number of cases in the previous period, and population density. There is still very little research that predicts the number of diphtheria cases involving population density variables and the number of cases in the previous period. So far, research related to diphtheria has focused more on analyzing the impact of vaccines on public health [4,8], distinguished by age group [5,15,16], population [14], demographics [10], area characteristics [17], changes in social behavior [18], and the size of the given country’s income [19].
Regarding the method used herein to predict the number of diphtheria cases, thus far, it has rarely been used specifically to research numbers of diphtheria cases; very few alternative methods have been proposed. Past research has proposed using the radial basis function network method to predict the number of diphtheria cases, but the best model is said to involve only the number of cases in the previous period [9]. This is somewhat different from the recent findings previously mentioned. For this reason, in this study, we will forecast the number of cases using a time series approach. The method used in forecasting is the type-2 fuzzy logic systems method. This method is also considered excellent in dealing with complex situations [11,12], and has been widely used for forecasting in various fields. In previous research, the type-2 fuzzy model has been compared to the artificial neural network model and the type-1 fuzzy logic systems model in forecasting coal production capacity; the type-2 fuzzy logic systems model was considered better in terms of stability and consistency [11]. Other studies have shown a low number of errors in prediction when using a type-2 fuzzy method. Prediction of clinical data using type-1 fuzzy and type-2 fuzzy models was carried out in [13]. The study [13] stated that forecasting results produced using the type-2 fuzzy model were superior to those of the type-1 fuzzy model. Currently, there are many applications of the fuzzy type-2 model, including decision-making [11], pattern recognition, classification, and control [12]. However, to the best of the author’s knowledge, until now, there has still only been occasional use of the fuzzy type-2 model for forecasting time series data, particularly cases related to the spread of disease. With that in mind, this study uses a type-2 fuzzy model to forecast numbers of diphtheria cases.

3. Methodology

3.1. Data

The data to be used in this study include the number of diphtheria sufferers, population density, and immunization coverage, including the diphtheria-1 immunization (DPT-1), diphtheria-2 immunization (DPT-2), diphtheria-3 immunization (DPT-3), and diphtheria-4 immunization (DPT-4). The data periods used were monthly, from 2013 to 2018. Data were obtained from the East Java Provincial Health Office and the East Java Central Bureau of Statistics. The data obtained are data from all cities/districts in the province of East Java. District/City data in the following provinces are grouped based on the number of cases. Group 1 consists of five cities/districts, while Group 2 and Group 3 each have seventeen cities/districts. The descriptive statistics data used are shown in Table 1. The data in Table 1 indicate that the data are not normally distributed. This can be seen from the skewness value, which is different from zero. The range of data and the standard deviation are also very large.

3.2. Methodology

The experimental stages used in this study are shown in Figure 1.

3.2.1. Data Preprocessing

The acquired data still need to be processed, so that they become structured data. Data that are not in the monthly period format will be made so. Regency/city data are grouped based on data on the highest number of sufferers that they have. In addition, the data will also be divided into training data and testing data, with a ratio of 75:25 [9].

3.2.2. Correlation Test

The correlation test is a statistical method used to determine the relationship between two or more variables [9]. The variables analyzed are the independent variables and the dependent variables. In this study, the correlation test was used to see the effect of seven input variables in the tth period on the output variable, namely the number of diphtheria sufferers in the (t + 1)th period.

3.2.3. Modeling and Forecasting

Modeling is carried out using type-2 fuzzy logic systems (T2FLS). The characteristics of the type-2 fuzzy model lie in the membership function [12]. In a type-2 set, the degree of membership for each element is a fuzzy type-1 set in [0, 1]. Type-2 fuzzy logic has two membership degrees: primary and secondary membership [11]. In a type-2 fuzzy interval, there are limits on the membership functions, namely the upper membership function (UMF) and lower membership function (LMF). The membership function used is of the Gaussian type. Using the Gaussian primary membership function, the antecedent and the number of rules in the membership function are expressed in Equation (1); the upper membership function is defined in Equation (2). The lower membership function is defined in Equation (3). Furthermore, to generate fuzzy rules from input–output pairs, the lookup table scheme is used.
μ k l ( x ) = exp   1 2 x k m k l σ k l 2 σ k l σ k 1 l , σ k 2 l
μ ¯ k l ( x k ) = N ( m k l ,   σ k 2 l ;   x k )
μ ¯ k l ( x k ) = N ( m k l , σ k 1 l ;   x k )
The input and output variables used in modeling are shown in Table 2. Experiments were carried out in various scenarios, which were combinations of input variables. The scenarios in this study are shown in Table 3. There are 12 subsequent scenarios denoted by scenarios A3, A5, A7, B3, and so on, where 3, 5, and 7 show the many linguistic categories of each group of variables. The distribution of training and testing data used is 75% and 25%, respectively. Furthermore, an example of the linguistic category 5 membership function is shown in Table 3.
Next, twelve scenarios will each be applied to the three selected areas, which are the areas with the highest diphtheria case numbers. These areas are Surabaya City, Malang Regency, and Sumenep Regency. The selection was based on areas in which the number of cases had dominated in the previous year.

3.2.4. Model Performance Calculations

The model’s performance is found using symmetric mean absolute percentage error (SMAPE) and mean square error (MSE). The SMAPE is depicted in Equation (4) [9], while the standard MSE is obtained by using Equation (5), where n shows the number of periods, X i is the actual value in period ith, and F i is the predicted value in ith period.
SMAPE = 100 % n i = 1 n | X i F i | | X i | + | F i |
MSE = 1 n i = 1 n [ X i F i ] 2

3.3. Model’s Robustness Test

The model robustness test is used to see how well the model performs in each group when it is used to forecast data in other regions.

3.4. Case Number Forecasting in the Next Several Periods

The model that has proven to be robust is then used to forecast the number of cases in the coming period. The Health Service has stated that the forecast that needs to be made concerns the next 24 months.

4. Results and Discussion

Modeling in each sample area is carried out by involving many variables that are considered to have an effect on the number of cases of this disease. Table 4, Table 5 and Table 6 show the results of the correlation test between the variables involved for Surabaya, Malang, and Sumenep, respectively.
Table 4, Table 5 and Table 6 shows that the value of the correlation coefficient in the city of Surabaya ranges from −0.033 to 0.485. The variables that have a negative correlation are the DPT-4 immunization coverage variable and the population density variable, which means that when the value of these variables is greater, the value of the number of cases in the next period will decrease, while the remaining variables have a positive correlation, which means that changes in the values of these two variables are directly proportional to changes in the value of case numbers in period of t . In Surabaya city, it was found that the most influential independent variable was the number of sufferers in the t period, with a correlation coefficient value of 0.485, which is included in the sufficient criteria [9]. The other independent variables in the Surabaya city data have a very weak correlation with the dependent variable. From the analysis of the correlation results in Malang and Sumenep, it emerges that the variable that has the highest correlation value is also the number of sufferers in the period t .
The results of determining the range values for each variable, taken from the lowest and highest values of the training data for each variable, can be seen in Table 7. Meanwhile, the parameters of each model in each region are listed in Table 8. An example of the formed rule fragments (“L” is for “Low Number”, “MN” is “Medium Number”, “MA” is “Many”, “LD” is “Low Density”, “FD” is “Fair Density”, “HD” is “High Density”, “U” is “Uneven”, “FE” is “Fairly Even”, and “E” is “Even”) is shown in Table 9.
The results of the model’s performance in the studies of twelve scenarios in the districts of Malang, Surabaya and Sumenep are shown sequentially in Table 10, Table 11 and Table 12. In Malang, the model that has the lowest SMAPE value is the model of scenario C.7. Specifically, C.7 is the scenario in which all independent variables and seven membership functions are used.
In the Surabaya city model, the model that has the best accuracy/smallest SMAPE is the model with scenario C.5, in which the number of sufferers and the coverage of DPT immunization are the variables used. The best performance in the Surabaya model is 31.02%. In scenario B.7 of the Surabaya city model, the testing results cannot be obtained. This is because in scenario B.7, the variables used are the number of sufferers and population density, where the population density variable shows an upward trend. In scenario B.7, the standard deviation value used in the model is smaller than in B.5 and B.3, so the model cannot reach variable values that are far from those of the predetermined range.
In the model for the Sumenep area, the model with the best performance is the model with scenario A.3. In Table 12, it can be seen that model A.3 has the lowest SMAPE value, which is equal to 67.63%.
The SMAPE value calculated for each model can be used to determine the best model. However, it transpires that the model that has the lowest SMAPE score in each city has a different number of membership functions. In the Malang regency model, the model with the lowest SMAPE score is that which has a scenario with seven membership functions. In the Surabaya city model, the model with the lowest SMAPE score is the model with five membership functions. Finally, in the Sumenep model, the model with the lowest SMAPE score is the model that has three membership functions. If the models with low SMAPE scores are used, they may lead to differences in linguistic categories. Therefore, the selection of the best model to be used in the next process is carried out to equalize the number of membership functions.
Looking at the graphs of the actual data forecasting results, for the city of Surabaya and the Malang regency, the forecasting chart that follows the actual data pattern is the model with a total of three membership functions, while for Sumenep, the model with a good data pattern is the model with a total of five membership functions. So, the model chosen for forecasting is the model with a membership function of three, which only uses the variable of the number of cases.
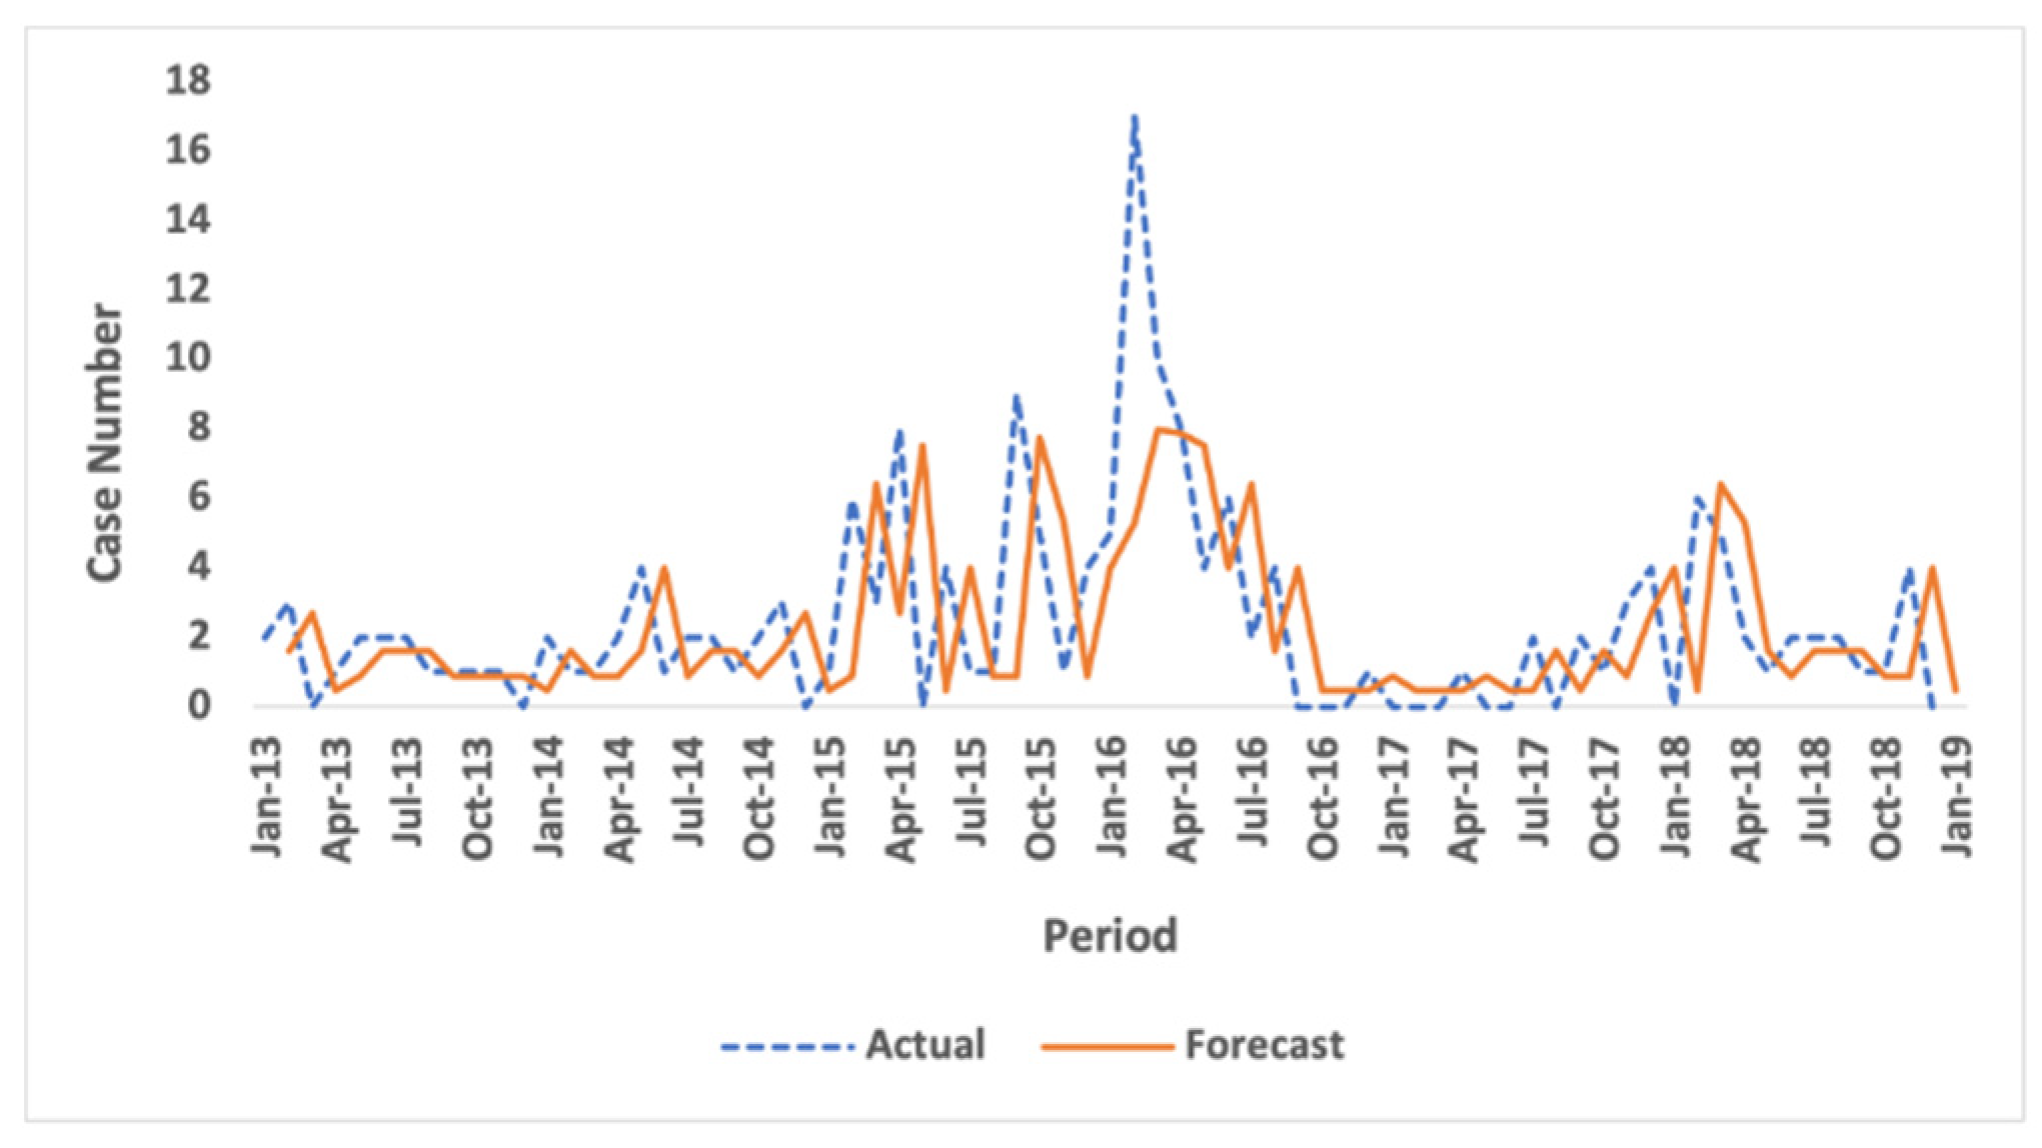
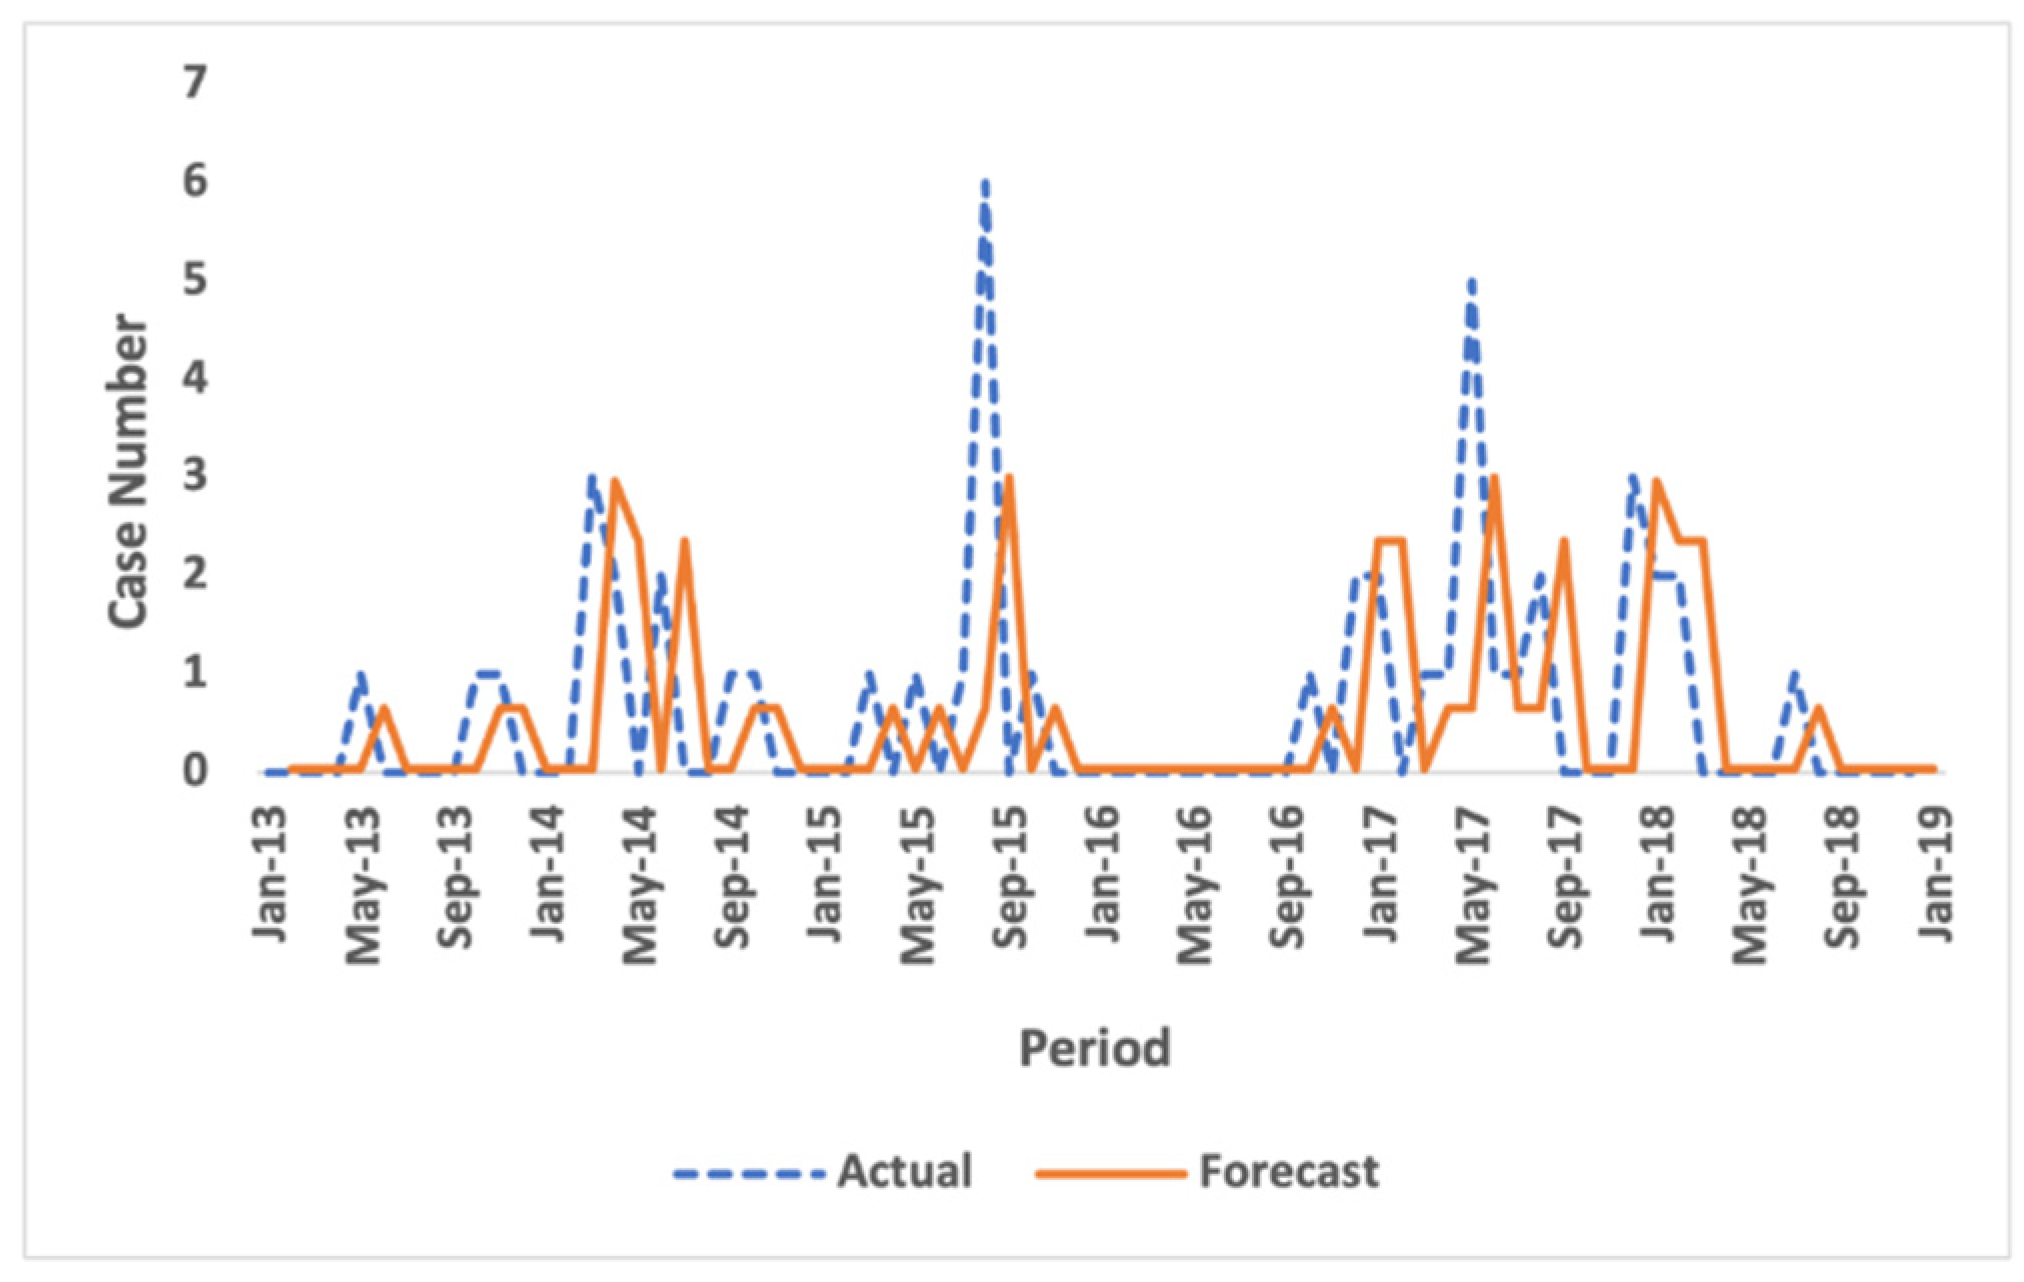
Next, to find model with the best robustness for each group, the models will be tested on data from other cities/regencies in the same group. The model robustness test was carried out in other regions. Comparisons of the actual data with the results of the forecast by the robustness model in the three regions are shown in Figure 2, Figure 3 and Figure 4.
Figure 2 shows the results of testing the model on data from other cities/districts. The trial results of the Surabaya city model using Blitar data graphs show forecast results that follow a pattern. However, the graph seems to shift. Within the Blitar data, the trend of increasing in the mid-period is not captured in the forecast results. Both of these trends occur because of the combination of basic rules used in the model.
The results of the trials for the Malang regency and the Sumenep models in Figure 3 and Figure 4 show the same result: the graphs follow a pattern, but there is a ‘delay’ in the pattern. The reason for this is the same, namely the basic rules used. From the trials conducted, it can be concluded that the rules cannot be used optimally, because the data do not have a strong linear correlation; therefore, they are less able to capture patterns.
After we know how the model performs against other data, we may forecast the case numbers for the next several periods. The forecasting results for the next several periods using model A.3 in the Malang region are shown in Figure 5. The future forecasting results for the Malang regency show a straight graph with the same value, without any up or down pattern. This is due to the rules used in the model.
The actual value used in the January 2019 period is included in the first category, namely “Low Number”, and according to the rules used, if there is a value that is in the “Low Number” category, the result is “Low Number”. This is why the value of the forecasting results does not increase or decrease; the value remains in the “Low Number” category.

5. Conclusions

Accurate forecasting of the number of diphtheria cases is very important, because forecasting numbers are needed as a basis for making decisions regarding preventive measures. The type-2 fuzzy approach used herein produces different performances when it involves different independent variables and membership functions. The results of the correlation test show that not all the independent variables involved have a significant effect on the forecasting results. The type-2 fuzzy method is more suitable for application to data that show a strong relationship between variables. Forecasting involving the number of sufferers in the previous period produces the best forecasting. The relationship between these variables has an impact on the basic rules generated in the fuzzy model.
Experiments and robustness model tests show that the Malang group model in several regions produces forecasting results with patterns similar to those of actual data; however, it experienced time delays. However, specifically in the Batu region, the forecasting results were less able to follow the actual data pattern, because there are actual data whose values are outside the range of variables used in the training model. The variable number of patients in the training model reached a maximum of six, but other regional data have a value of more than six. This condition means the rules used on the model are unable to capture patterns. The same is true of the results of the Surabaya group model. The forecasting results in the Blitar region showed that the increasing trend in the middle of the period was not captured in the forecasting results. This result was also influenced by the rules used in the model. The increment value is very high, and lies outside the variable range; thus, the basic rules do not capture this value. This was a similar result to that captured using the models of the Sumenep model trials in other regions. The forecasting results in several test areas, including Magetan, follow the actual data pattern, but with delays. The model can effectively capture the value of the increase; this is because the data value in this district is still within the pool of variable values used in the training model.
The basic rules used greatly affect the forecasting results, as do the values of the upper limit and lower limit. Determining the value of the upper limit and lower limit for each range of variables using the min–max method on training data transpired to be less than optimal. With min–max, the model cannot capture values that are far from the range of values that existed before. Thus, this method is not suitable for application to data that shows a trend. In future research, this type-2 fuzzy model will be developed in terms of the basic rules used. In addition, it is necessary to develop this type-2 fuzzy method so that the range of variables may be dynamic, and may capture all existing data patterns.

Author Contributions

Conceptualization, W.A. and M.I.P.; methodology, W.A.; validation, W.A., M.F. and M.I.P.; formal Analysis, W.A., M.F. and M.I.P.; data curation, M.F.; experiment, M.F.; writing—original draft preparation, W.A.; editing, W.A., M.F. and M.I.P. All authors have read and agreed to the published version of the manuscript.

Funding

This research was funded by Institut Teknologi Sepuluh Nopember through the Scientific Research scheme with funding number 1748/PKS/ITS/2023.

Institutional Review Board Statement

Not applicable.

Informed Consent Statement

Informed consent was obtained from all subjects involved in the study.

Data Availability Statement

Data available on request due to restrictions e.g., privacy or ethical.

Acknowledgments

This research was supported by the Public Health Office of East Java Province, Indonesia.

Conflicts of Interest

The authors declare no conflict of interest.

References

  1. Badell, E.; Alharazi, A.; Criscuolo, A.; Almoayed, K.A.A.; Lefrancq, N.; Bouchez, V.; Guglielmini, J.; Hennart, M.; Carmi-Leroy, A.; Zidane, N.; et al. Ongoing diphtheria outbreak in Yemen: A cross-sectional and genomic epidemiology study. Lancet Microbe 2021, 2, e386–e396. [Google Scholar] [CrossRef]
  2. Diphtheria|CDC. 9 September 2022. Available online: https://www.cdc.gov/diphtheria/index.html (accessed on 23 February 2023).
  3. van Seventer, J.M.; Hochberg, N.S. Principles of Infectious Diseases: Transmission, Diagnosis, Prevention, and Control. In International Encyclopedia of Public Health, 2nd ed.; Quah, S.R., Ed.; Academic Press: Cambridge, MA, USA, 2017; pp. 22–39. [Google Scholar] [CrossRef]
  4. Reid, M.C.; Peebles, K.; Stansfield, S.E.; Goodreau, S.M.; Abernethy, N.; Gottlieb, G.S.; Mittler, J.E.; Herbeck, J.T. Models to predict the public health impact of vaccine resistance: A systematic review. Vaccine 2019, 37, 4886–4895. [Google Scholar] [CrossRef]
  5. Nicholson, L.; Adkins, E.; Karyanti, M.R.; Ong-Lim, A.; Shenoy, B.; Huoi, C.; Vargas-Zambrano, J.C. What is the true burden of diphtheria, tetanus, pertussis and poliovirus in children aged 3–18 years in Asia? A systematic literature review. Int. J. Infect. Dis. 2022, 117, 116–129. [Google Scholar] [CrossRef]
  6. Clarke, K. Review of the Epidemiology of Diphtheria 2000–2016. Available online: https://cdn.who.int/media/docs/default-source/immunization/sage/2017/sage-meeting-of-april-2017/background-docs/session-diphtheria/1.-review-of-the-epidemiology-of-diphtheria---2000-2016-pdf-829kb.pdf?sfvrsn=9ba4f061_3 (accessed on 1 June 2023).
  7. Sujarwo, E. 460 Kasus dan 16 Orang Meninggal, KLB Difteri di Jatim Belum Dicabut [460 Cases and 16 People Died, Diphtheria Outbreak in East Java Has Not Been Re-voked]. Detiknews. Available online: https://news.detik.com/berita-jawa-timur/d-3855026/460-kasus-dan-16-orang-meninggal-klb-difteri-di-jatim-belum-dicabut (accessed on 29 April 2023).
  8. Bellavite, P. Factors that influenced the historical trends of tetanus and diphtheria. Vaccine 2018, 36, 5506. [Google Scholar] [CrossRef]
  9. Anggraeni, W.; Nandika, D.; Mahananto, F.; Sudiarti, Y.; Fadhilla, C.A. Diphtheria Case Number Forecasting using Radial Basis Function Neural Network. In Proceedings of the 2019 3rd International Conference on Informatics and Computational Sciences (ICICoS), Semarang, Indonesia, 29–30 October 2019; pp. 1–6. [Google Scholar] [CrossRef]
  10. Leidere-Reine, A.; Kolesova, O.; Kolesovs, A.; Viksna, L. Seroprevalence of diphtheria and measles antibodies and their association with demographics, self-reported immunity, and immunogenetic factors in healthcare workers in Latvia. Vaccine X 2022, 10, 100149. [Google Scholar] [CrossRef]
  11. Runkler, T.; Coupland, S.; John, R. Interval type-2 fuzzy decision making. Int. J. Approx. Reason. 2017, 80, 217–224. [Google Scholar] [CrossRef] [Green Version]
  12. Mittal, K.; Jain, A.; Vaisla, K.S.; Castillo, O.; Kacprzyk, J. A comprehensive review on type 2 fuzzy logic applications: Past, present and future. Eng. Appl. Artif. Intell. 2020, 95, 103916. [Google Scholar] [CrossRef]
  13. Najafi, A.; Amirkhani, A.; Mohammadi, K.; Naimi, A. A novel soft computing method based on interval type-2 fuzzy logic for classification of celiac disease. In Proceedings of the 2016 23rd Iranian Conference on Biomedical Engineering and 2016 1st International Iranian Conference on Biomedical Engineering (ICBME), Tehran, Iran, 24–25 November 2016; pp. 257–262. [Google Scholar] [CrossRef]
  14. Gonzales, A.; Choque, D.; Marcos-Carbajal, P.; Salvatierra, G. Factors associated with diphtheria vaccination completion among children under five years old in Peru 2010–2019: A cross-sectional population-based study. Heliyon 2022, 8, e11370. [Google Scholar] [CrossRef]
  15. Khetsuriani, N.; Zaika, O.; Slobodianyk, L.; Scobie, H.M.; Cooley, G.; Dimitrova, S.D.; Stewart, B.; Geleishvili, M.; Allahverdiyeva, V.; O’Connor, P.; et al. Diphtheria and tetanus seroepidemiology among children in Ukraine, 2017. Vaccine 2022, 40, 1810–1820. [Google Scholar] [CrossRef]
  16. Verdier, R.; Marchal, C.; Belhassen, M.; Pannerer, M.L.; Guiso, N.; Cohen, R. Coverage rates for diphtheria, tetanus, poliomyelitis, and pertussis age-specific booster recommendations in France: 2018 update of the real-world cohort analysis. Infect. Med. 2022, 2, 51–56. [Google Scholar] [CrossRef]
  17. Pruitt, S.L.; Tiro, J.A.; Kepka, D.; Henry, K. Missed Vaccination Opportunities Among U.S. Adolescents by Area Characteristics. Am. J. Prev. Med. 2022, 62, 538–547. [Google Scholar] [CrossRef]
  18. Dadari, I.; Ssenyonjo, J.; Anga, J. Effective vaccine management through social behavior change communication: Exploring solutions using a participatory action research approach in the Solomon Islands. Vaccine 2020, 38, 6941–6953. [Google Scholar] [CrossRef]
  19. Li, X.; Mukandavire, C.; Cucunuba, Z.M.; Londono, S.E.; Abbas, K.; Clapham, H.E.; Jit, M.; Johnson, H.L.; Papadopoulos, T.; Vynnycky, E.; et al. Estimating the health impact of vaccination against ten pathogens in 98 low-income and middle-income countries from 2000 to 2030: A modelling study. Lancet 2021, 397, 398–408. [Google Scholar] [CrossRef]
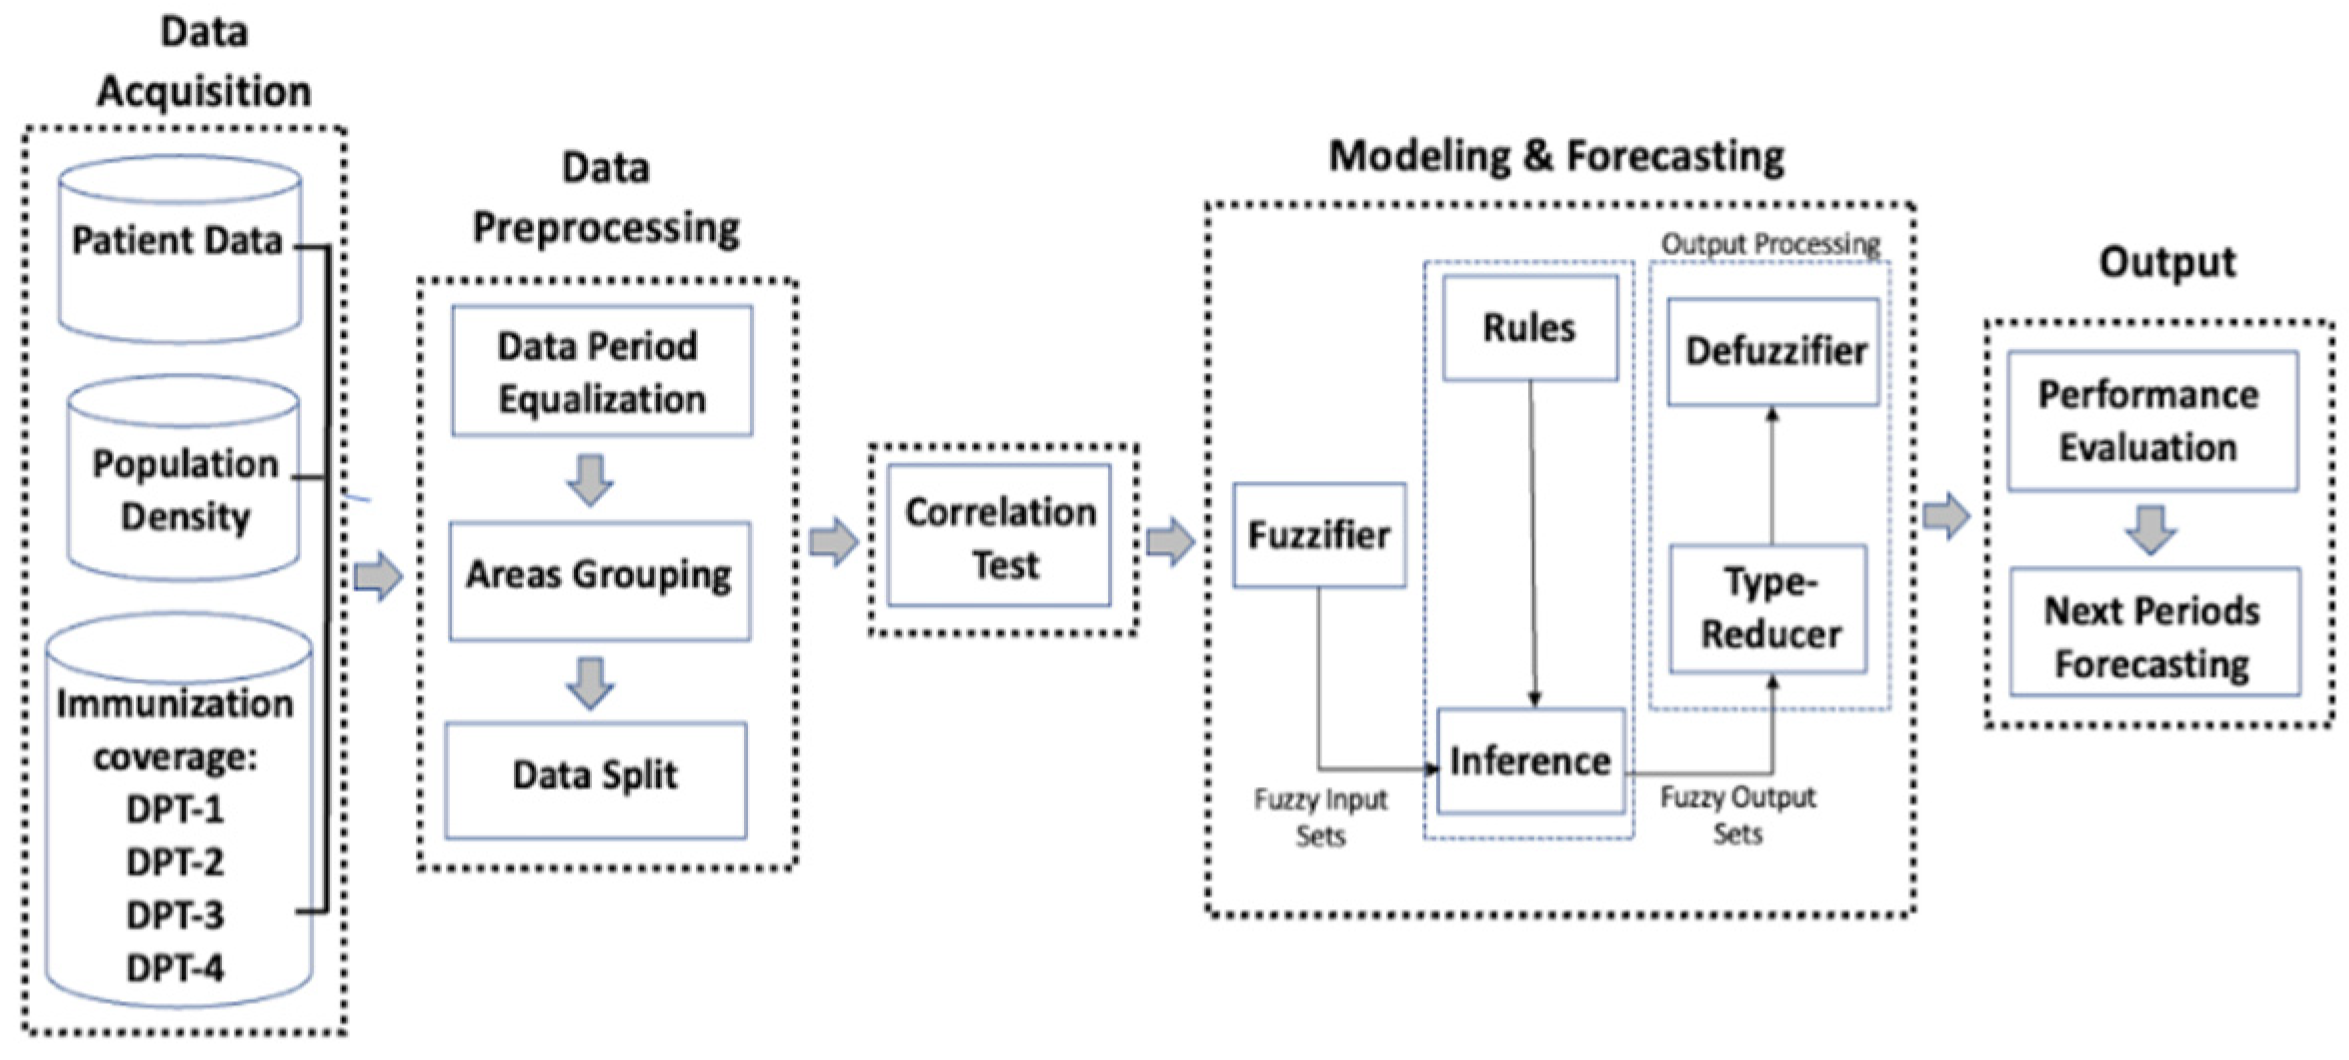
Figure 1. Proposed methodology.
Engproc 39 00003 g001
Figure 2. Results of the Surabaya model trial using Blitar data.
Engproc 39 00003 g002
Figure 3. Results of the Malang model trial using Batu data.
Engproc 39 00003 g003
Figure 4. Results of the Sumenep model trial using Magetan data.
Engproc 39 00003 g004
Figure 5. The next period forecasts results in Sumenep.
Engproc 39 00003 g005
Table 1. Descriptive statistics data.
MinimumMaximumMeanStd. DeviationSkewness
StatisticStatisticStatisticStatisticStatistic
Case_Number0172.092.7222.304
Population_
Density
52982323127.53.543.5340.711
DPT_13.1317.184.352113.7362.433
DPT_23.2316.2983.390110.4041.626
DPT_33.5116.3583.053116.9691.931
DPT_40127.0252.4621.184.2387.710
Table 2. Input and output variables.
Input VariableOutput Variable
Number of Diphtheria Sufferers Period tNumber of Diphtheria Sufferers
Period t + 1
Population Density Period t
Diphtheria-1 Immunization (DPT-1) Coverage Period t
Diphtheria-2 Immunization (DPT-2) Coverage Period t
Diphtheria-3 Immunization (DPT-3) Coverage Period t
Table 3. Input variables combination.
CombinationMFInput Variable
A3Number of Diphtheria Sufferers Period t
5
7
B3Number of Diphtheria Sufferers Period t
Population Density Period t
5
7
C3Number of Diphtheria Sufferers Period t
Diphtheria-1 Immunization (DPT-1) Coverage Period t
Diphtheria-2 Immunization (DPT-2) Coverage Period t
Diphtheria-3 Immunization (DPT-3) Coverage Period t
Diphtheria-4 Immunization (DPT-4) Coverage Period t
5
7
D3Number of Diphtheria Sufferers Period t
Population Density Period t
Diphtheria-1 Immunization (DPT-1) Coverage Period t
Diphtheria-2 Immunization (DPT-2) Coverage Period t
Diphtheria-3 Immunization (DPT-3) Coverage Period t
Diphtheria-4 Immunization (DPT-4) Coverage Period t
5
7
Table 4. Correlation test results for independent variables in Surabaya.
Variable P t + 1 P t DPT-1DPT-2DPT-3DPT-4K
P t 0.4851.000
DPT-10.0910.0521.000
DPT-20.052−0.0030.9301.000
DPT-30.042−0.0330.8940.9441.000
DPT-4−0.033−0.0800.1390.1670.1501.000
K−0.111−0.1650.0880.1770.1480.1461.000
Table 5. Correlation test results for independent variables in Malang.
Variable P t + 1 P t DPT-1DPT-2DPT-3DPT-4K
P t 0.1101.000
DPT-1−0.086−0.1141.000
DPT-2−0.035−0.0630.9591.000
DPT-3−0.023−0.0850.9470.9621.000
DPT-4−0.083−0.140−0.0260.028−0.0051.000
K0.9590.026−0.200−0.190−0.1960.6751.000
Table 6. Correlation test results for independent variables in Sumenep.
Variable P t + 1 P t DPT-1DPT-2DPT-3DPT-4K
P t 0.1681.000
DPT-1−0.0390.0621.000
DPT-20.0490.1010.8771.000
DPT-30.0720.1120.8890.9081.000
DPT-4−0.002−0.028−0.125−0.129−0.1411.000
K0.1170.066−0.328−0.363−0.3710.1201.000
Table 7. Variable ranges.
VariableMalangSurabayaSumenep
Upper LimitLower LimitUpper
Limit
Lower LimitUpper
Limit
Lower
Limit
Number of Diphtheria
Sufferers Period t
0601604
Population Density Period t70672880088183528540
DPT-1 Immunization
Coverage Period t
6.9217.16.4814.446.711.07
DPT-2 Immunization
Coverage Period t
6.9716.296.2112.176.4311.04
DPT-3 Immunization
Coverage Period t
7.1616.356.1713.356.8911.75
DPT-4 Immunization
Coverage Period t
010.5401000127.02
Number of Diphtheria
Sufferers Period t + 1
0601604
Table 8. Parameter model C.3 in Sumenep.
VariablesMF LabelStandard
Deviation:
Lower
Standard
Deviation:
Upper
Average
SufferersLow Number0.6370.84930
Medium Number2
Many4
DPT-1
Immunization Coverage
Uneven0.69590.92796.7
Fairly Even8.885
Even11.07
DPT-2
Immunization Coverage
Uneven0.73410.97886.43
Fairly Even8.73
Even11.04
DPT-3
Immunization Coverage
Uneven0.77391.0326.89
Fairly Even9.32
Even11.75
DPT-4
Immunization Coverage
Uneven20.2326.970
Fairly Even63.51
Even127.02
Table 9. Model results in Malang, using scenario D.3.
P t KDPT-1DPT-2DPT-3DPT-4 P t + 1
LLDUUUU
LLDEEEUB
LFDFEUFEULD
LHDUUUFELD
MNFDUUUFELD
MNFDUUUFEB
MNHDUUUFEMN
BLDUUUUMN
BFDUUUULD
Table 10. Model accuracy in Malang.
MFModelTrainTest
MSESMAPEMSESMAPE
3A.32.50361.9%8.78554.91%
B.32.64357.8%11.67499.83%
C.33.07763.2%8.58067.75%
D.33.41849.8%7.30054.37%
5A.52.47546.4%6.36851.56%
B.51.64545.7%8.12963.92%
C.51.85443.1%6.32749.75%
D.51.86344.2%5.83746.78%
7A.72.24862.1%9.78567.70%
B.71.41141.1%7.57955.02%
C.72.28644.4%6.26945.83%
D.73.68151.92%5.97149.52%
Table 11. Model accuracy in Surabaya.
MFModelTrainTest
MSESMAPEMSESMAPE
3A.37.70540.20%14.94035.51%
B.38.96764.31%45.63799.98%
C.36.41437.28%20.01734.48%
D.36.30936.01%21.03935.57%
5A.56.63340.43%20.03734.80%
B.55.21132.95%29.92852.35%
C.59.13338.85%13.65731.02%
D.55.96734.93%27.69336.71%
7A.76.29635.98%20.40139.17%
B.73.78030.38%--
C.77.07236.39%18.25634.40%
D.74.99733.43%25.15035.67%
Table 12. Model accuracy in Sumenep.
MFModelTrainTest
MSESMAPEMSESMAPE
3A.31.28576.9%2.18867.63%
B.30.83875.4%2.12670.87%
C.31.13085.6%1.98068.86%
D.31.26484.0%2.13078.09%
5A.50.80286.7%2.73984.61%
B.50.61885.7%2.97191.27%
C.50.58675.8%1.98576.35%
D.50.57277.0%1.89171.02%
7A.71.31090.6%2.52784.88%
B.70.80985.5%3.26177.18%
C.71.07879.0%2.54570.86%
D.71.07990.3%2.95475.07%
Disclaimer/Publisher’s Note: The statements, opinions and data contained in all publications are solely those of the individual author(s) and contributor(s) and not of MDPI and/or the editor(s). MDPI and/or the editor(s) disclaim responsibility for any injury to people or property resulting from any ideas, methods, instructions or products referred to in the content.