1. Introduction
The ability to predict and model market trends is an important part of the investment decision-making process for local and foreign real estate investors, especially where quantitative data are scarce. Investors view real estate as an asset class competing against other investment opportunities in stocks and shares. For this reason, understanding real estate behaviour and the future trajectory of emerging markets provides a strong basis for investment.
Real estate is one of the sectors that contribute to gross domestic products (GDP) of countries worldwide. Hongkong and Shanghai Banking Corporation [
1] reported that real estate assets were valued at USD 228 trillion in 2016 alone, while Gordon [
2] noted that global real estate accounted for 60% of mainstream global assets and about three times the size of global GDP in 2015. These figures show that real estate attracts a lot of investment and has even more potential to grow.
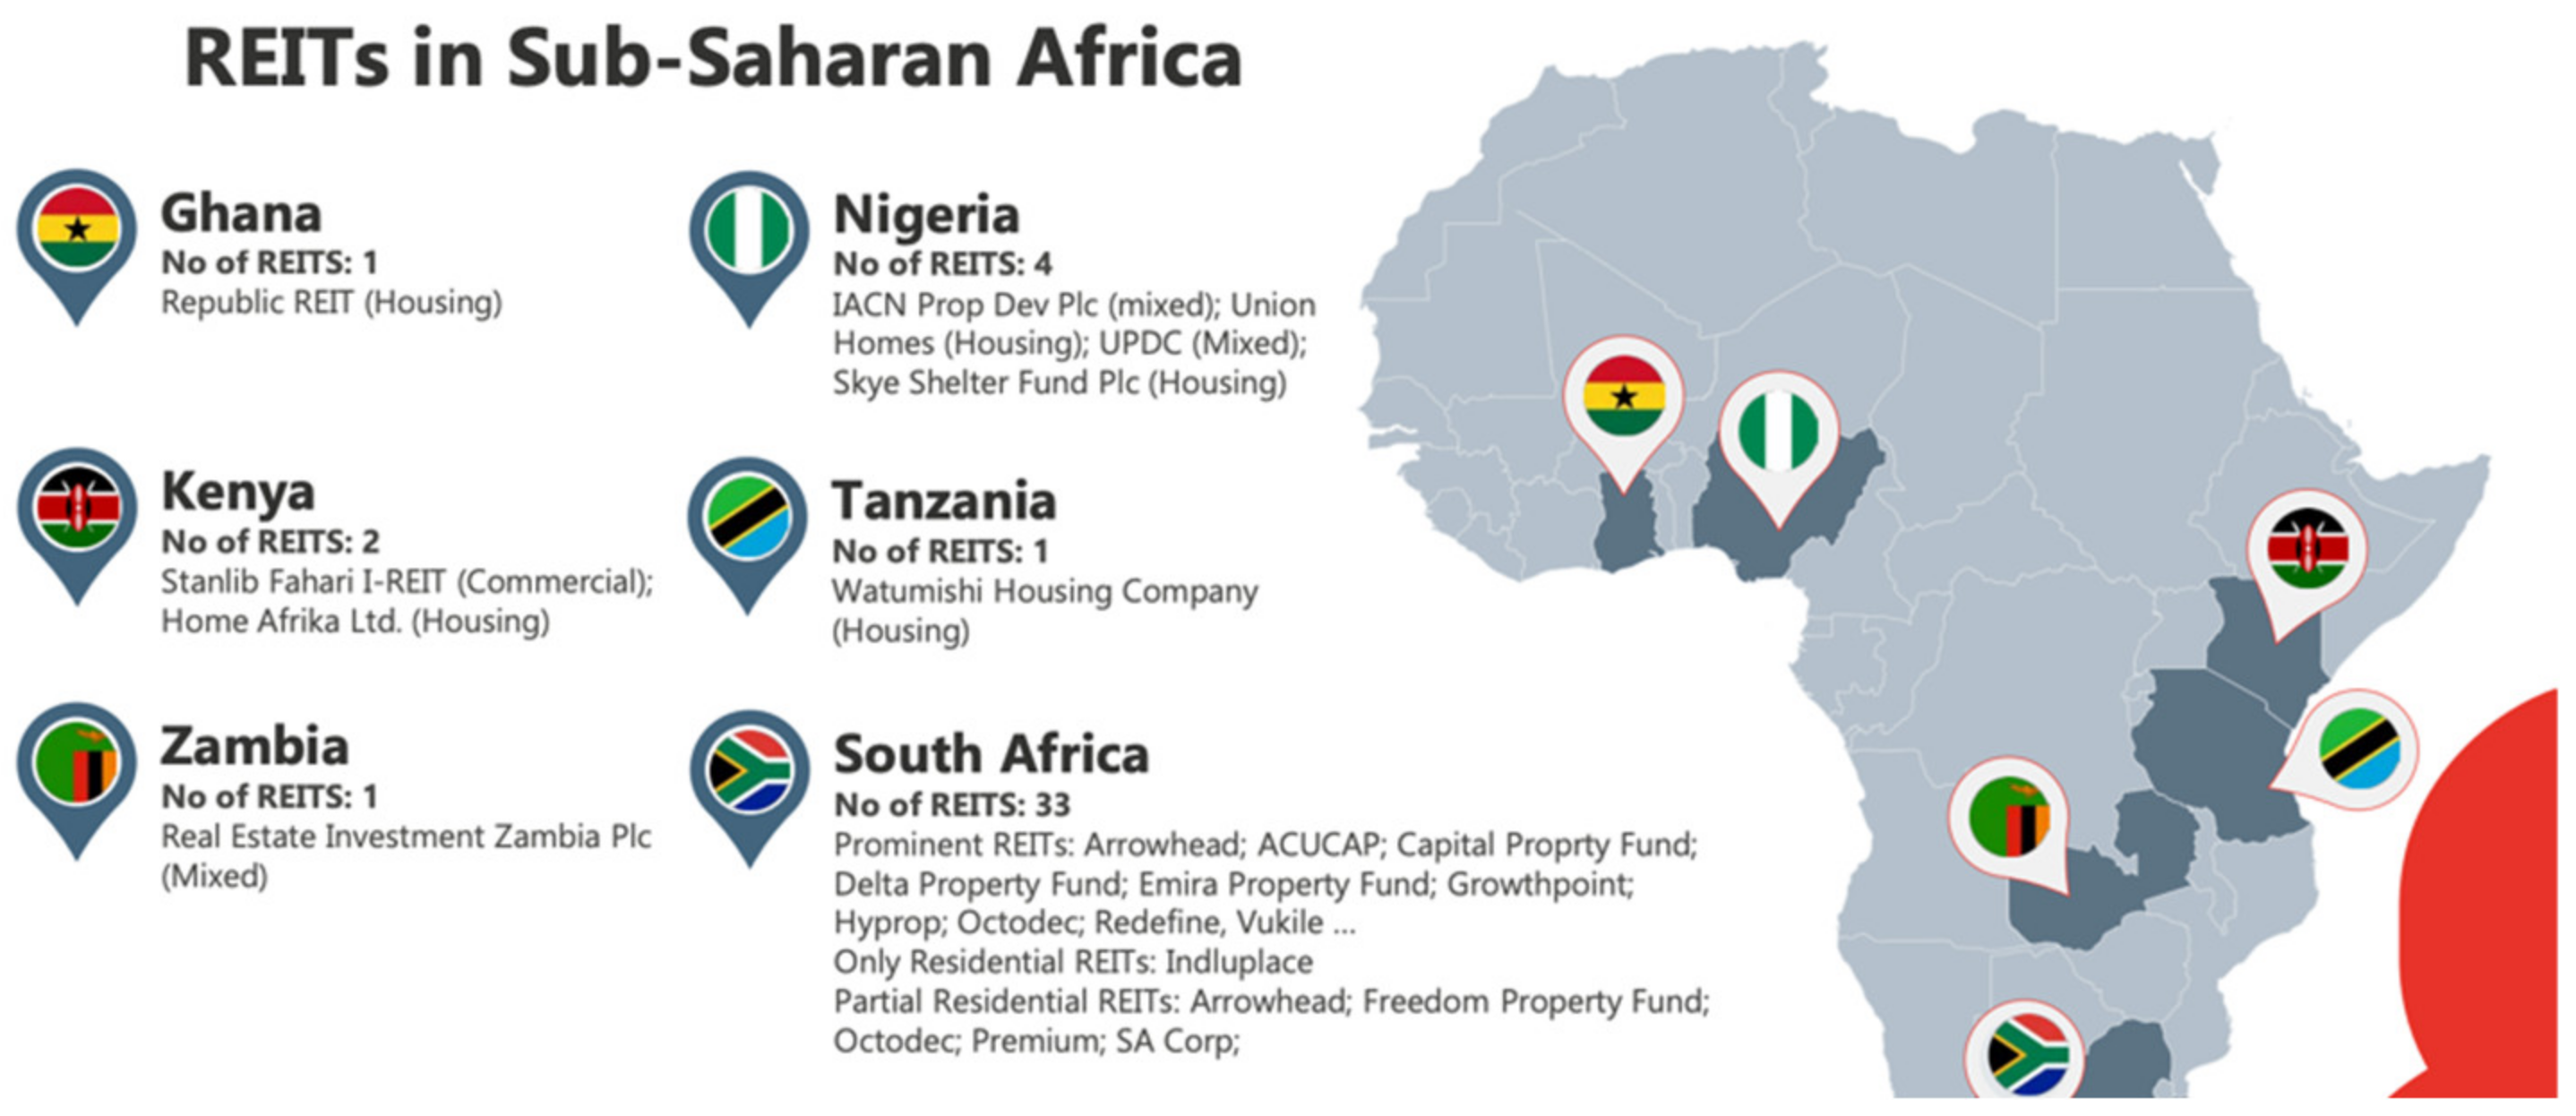
In
Figure 1, the number of listed Real Estate Investment Trusts (REITs) demonstrate growing interest in emerging African markets which must be supported by improved accuracy in forecasting and reporting to stimulate investments. As mentioned by Bello and Yacim [
3], comparable data as the bedrock of most rental value assessments are sparsely available in most emerging markets [
3]. This makes it difficult, if not impossible, to rely on historical data for rent forecasts. Boshoff [
4] and Keng [
5] suggest that listed data and economic time series are useful for evaluating the future trajectory of real estate markets, which could help investors make better capital divestment decisions. This informs the choice of two locations in sub-Saharan Africa for better decision marking. Additionally, the sizes of the two markets play a key role in the choice. Nigeria is Africa’s most populated country, while the population of South Africa has been estimated at approximately one-third of Nigeria’s population. In recent years, Nigeria and South Africa have both been rated as Africa’s largest economies [
6,
7].
The two economies have experienced similar enough growth patterns to compare their performance [
6]. The two economies have experienced major shocks and economic prospects and are still fraught with uncertainties. Investors are likely to perceive these top economies in a similar light despite their population differences. This paper argues that confidence in the real estate sector in sub-Saharan Africa can be improved when valuable insight is achieved using leading economic indicators [
8] to forecast turning points in real estate markets. This paper investigates how much forecasting accuracy can be achieved by modelling the relationships between listed real estate and macroeconomic time series using the logit regression model.
2. Literature Review
The fact that real estate is viewed as an asset class like stocks and equities informs the use of historical data and analysis for macroeconomic and financial investment analysis. Tonelli and Cowley [
9] showed that an understanding of the past behaviour of the rent component was valuable for evaluating future behaviour [
10,
11]. However, as noted by Aron and Muellbauer [
12], there is a need for caution in using merely market comparison and imputed rents. Olanrele et al. [
13], in a study of the Nigerian market, focused on evaluating the causal relationship between N-REITs’ dividend yield and five Money Market Indicators (MMI). They concluded that there was indeed a relationship between REIT returns and the MMI variables both in the short run (through Trace) and long run (using Max-Eigen values). Their study limited its research to data from a single REIT, the Skye REIT, and as such could not provide much insight into the future trajectory of the underlying real estate market.
Similarly, Boshoff [
4] investigated listed real estate assets in South Africa and brought together two different asset classes, the stocks and bond market and the real estate market, as similar entities. The study asserted that price detection occurred in the listed real estate market, which could also be a signal of market movement in the direct real estate market. A lot of research has been carried out to promote macroeconomic modelling as a means of improving forecasting accuracy. Some popular works in these subject areas include studies such as those of Munusamy, Muthuveerappan and Baba [
14]; Jadevicius, Sloan and Brown [
15]; Tsolacos [
16]; Jadevicius, Sloan and Brown [
17]; and Boshoff [
4]. Buehler and Almeida [
18] discussed the investment market in the United States relative to predicting commercial market bubbles as a part of decision making for global investors. They posited that in creating predictive models, identifying the “right” set of variables that combined to trigger changes in the market was a first step in predictive modelling.
Munusamy, Muthuveerappan and Baba [
14] considered a variety of literature regarding modelling types, accuracy and adoption of statistical modelling techniques. They reported that Multiple Regression Analysis (MRA) and Artificial Neural Networks (ANNs) were most widely used. They concluded that ANNs showed an average error rate between 5 to 10% inaccuracy, while multiple regression analysis showed a higher average, which was 10 to 15%. Chrostek and Kopczewska [
19] and other similar studies [
20] compared the quality of prediction for several models: a classical linear model estimated with ordinary least squares (OLS), a linear OLS model including geographical coordinates, a spatial expansion model, spatial lag and spatial error models as well as geographically weighted regression. They concluded that models comprising the spatial components rendered better estimates than a-spatial models. They posit that there is evidence of the capacity of complex models such as these to predict rent behaviour.
However, other researchers like Moolman and Jordaan [
21]; Tsolacos and Brooks [
22]; Boshoff [
4]; and Udoekanem, Ighalo and Sanusi [
23] have preferred simpler models such as simple regression, vector auto regression and binomial logit regression. These studies point to the use of logit regression as a form of directional forecast, but while this method has not been tested on African data, this study uses unexplored time series data to test the predictive modelling approach. Considering the various positions on appropriate modelling techniques, binary logistic regression proves to be popular and devoid of complex parameters. This makes it desirable for further testing with African data sources. In the next section, this study’s methods and results are discussed. The performance of the outcome model determines the extent to which macroeconomic data can serve to improve the accuracy of predictive rent models [
8,
24].
3. Methodology
South African economic data were collected from the Iress expert and Statistics South Africa (Stat SA) database. The FTSE/JSE SA Listed Property (J253) consists of the twenty largest liquid companies by market capitalisation in the Real Estate Investment and Services Sector and Real Estate Investment Trust Sector with a primary listing on the JSE. Nigerian listed real estate data were collected from the Central Bank of Nigeria, Sky Shelter REIT (SKY REIT) and the UACN property development company data. All monthly data were converted into quarterly data prior to analyses to ensure data uniformity with the exogenous data. The available data for the Nigerian listed real estate market were collected for the period 2008 Q1 to 2018 Q4. The South African macroeconomic data series were collected between the first quarter of 2003 and the fourth quarter of 2018.
To handle seasonality in the time series data, the Nigerian REIT and JSE time series data were used to create dummy binary outcomes for the purpose of logistic regression. The time series data difference of Yt–Yt−1 was classified based on a rise or fall. Growth in the time series represented a 0, while a fall represented a 1. This provided the data for the binary variable in both data sets. The South African dummy variable is denoted as South Africa Listed Real Estate (SALRE), while the Nigerian dummy variable is denoted as Nigeria Listed Real Estate (NLRE).
A turning point analysis was performed by using a regression probability model that outputs a dichotomous binary result that can be either 1 or 0. The threshold for turning point detection is typically set at 50% or 0.5 thresholds.
4. Results and Discussion
For SALRE indicators, the Hosmer and Lemeshow test shows a high value of 0.757 in
Table 1, which proves the goodness of fit of the model. For the NLRE model, the Hosmer and Lemeshow test shows a value of 0.825, which proves the goodness of fit of the model.
In
Table 2, the SALRE model, the Cox and Snell and Nagelkerke R-squared were 0.256 and 0.364, respectively, which implies that the model explains about 25.6% or 36.4% variation in the dependent variables. The Cox and Snell and Nagelkerke R-Square values in the NLRE model were 0.440 and 0.587, respectively. This translates to 44% and 58.7% estimates of how much of the variation in listed real estate is explained by the model. The Cox and Snell and Nagelkerke R-squared were 0.440 and 0.587, respectively, which implies that the model explains about 44.0% or 58.7% variation in the dependent variables.
T, being the state of the independent variable, is estimated to be 1 or 0, based on the logit regression rule:
T = 1 for the period that capital values decline;
T = 0 otherwise.
Therefore, the objective of using a logit approach is to estimate a response probability:
Table 3 value are included in Equation (1), the coincident indicator β = 0.479 and the exchange rate β = 0.083. The constant or intercept value was −74.738. This model is expressed thus:
where:
Y = SALRE
Pr = Probability
T = The indicator of a fall of capital values
p = Probability of a decline in capital values
β0 = Model intercept
βx= Regression coefficient
CI = Coincident indicator
ER = Exchange rate
For the Nigerian data sets in
Table 4, the β (beta coefficient) values showed the lending rate, treasury bill rate and Consumer Price Index/inflation, with a significance score on 0.01 level.
where:
Y = NLRE
Pr = Probability
T = The indicator of a fall of capital values
p = Probability of a decline in capital values
IR = Lending/interest rate
TBR = Treasury bill rate
CPI = Consumer Price Index
5. Conclusions
This study explored the existing literature on the selection and sources of leading indicator data for predicting the movement or changes in South African and Nigerian listed real estate. The paper investigates how much forecasting accuracy can be achieved by modelling the relationships between listed real estate and macroeconomic time series using the logit regression model. Data from South Africa and Nigeria were input into the logit regression model to evaluate how much predictive power the model has.
For predictive rent modelling to perform adequately, the use of simple probabilistic models proved valuable aligning with the approach by previous authors [
24] in addressing countries and central bank policy changes relative to changes in macroeconomic indicators. The logistic regression model evaluated the performance of the best fitting model to classify the state of a dummy variable T = 0 or 1, representing growth or decline in the listed real estate indicators. The test for predictive accuracy showed that 22.2% variance in the Nigerian real estate market was explained by the logit regression model, while 9.4% variance in the South African real estate was explained by changes in the exchange rate and coincident indicators. These findings agree with the results by Olanrele et al. [
13] and Boshoff [
4]. The strength and similarity of the model capacity in both countries showed that each market signal correctly predicts turning points in the economy for as much as 75% (Nigeria) and 80% (South Africa) of the time. The misclassification rate for the Nigerian logistic model is, however, 5% higher which is similar to the average model error margins observed by Munusamy, Muthuveerappan and Baba [
14]. Meanwhile, the classification accuracy of the South African logit model is higher than that of the Nigerian logit model.
Author Contributions
Conceptualization, J.D.O., B.G.Z. and J.A.Y.; methodology, J.D.O.; software, J.D.O.; validation, J.D.O., B.G.Z. and J.A.Y.; formal analysis, J.D.O.; investigation, J.D.O., B.G.Z. and J.A.Y.; resources, J.D.O., B.G.Z. and J.A.Y.; data curation, J.D.O.; writing—original draft preparation, J.D.O.; writing—review and editing, J.D.O., B.G.Z. and J.A.Y.; visualization, J.D.O.; supervision, B.G.Z. and J.A.Y.; project administration, B.G.Z.; funding acquisition, J.D.O. All authors have read and agreed to the published version of the manuscript.
Funding
The IREBS Foundation for African Real Estate Research and the University of Pretoria Postgraduate Bursary has supported this research. The funding was provided for completing a master’s dissertation including data gathering, research design, and reporting.
Institutional Review Board Statement
Not applicable.
Informed Consent Statement
Not applicable.
Data Availability Statement
Not applicable.
Acknowledgments
We acknowledge the support of the IREBS Foundation for African Real Estate Research and the Department of Construction Economics, University of Pretoria.
Conflicts of Interest
The authors declare no conflict of interest.
References
- Hongkong Shangai Banking Corporation (HSBC). Rising Potential of The World’s Largest Asset Class. 2017. Available online: https://sp.hsbc.com.my/liquid/6642.html (accessed on 24 August 2023).
- Gordon, S. Value of All Global Real Estate Totals $217 Trillion. Pam Golding Properties. 2016. Available online: https://www.pamgolding.co.za/property-research/2016/2/2/value-of-all-global-real-estate-totals-217-trillion (accessed on 24 August 2023).
- Bello, O.M.; Yacim, A.J. An Assessment of the Impact of Tree Shade on Rental Value of Residential Property in Maiduguri, North—Eastern, Nigeria. In Proceedings of the XXV FIG Congress, Kuala Lumpur, Malaysia, 16–21 June 2014; pp. 1–18. [Google Scholar]
- Boshoff, D. Empirical Analysis of Space and Capital Markets in South Africa: A Review of the REEFM- and FDW Models. S. Afr. J. Econ. Manag. Sci. 2013, 16, 383–394. [Google Scholar] [CrossRef][Green Version]
- Keng, T.Y. Australian property securities funds: A survey of strategic investment issues. Pac. Rim Prop. Res. J. 2004, 10, 263–282. [Google Scholar] [CrossRef]
- Naidoo, P. As African Leaders Meet on Growth, SA and Nigeria Are a Drag. News24. 2019. Available online: https://www.news24.com/fin24/economy/as-african-leaders-meet-on-growth-sa-and-nigeria-are-a-drag-20190902 (accessed on 24 August 2023).
- Rossouw, J. South Africa Is Africa’s Largest Economy (Again). But What Does It Mean? The Conversation. 2016. Available online: https://theconversation.com/south-africa-is-africas-largest-economy-again-but-what-does-it-mean-63860 (accessed on 24 August 2023).
- Frankel, J.; Saravelos, G. Can Leading Indicators Assess Country Vulnerability? Evidence from The 2008–2009 Global Financial Crisis. J. Int. Econ. 2012, 87, 216–231. [Google Scholar] [CrossRef]
- Tonelli, M.; Cowley, M. Forecasting Office Building Rental Growth Using a Dynamic Approach. Pac. Rim Prop. Res. J. 2004, 10, 283–304. [Google Scholar] [CrossRef]
- Crosby, N.; Henneberry, J. Changing Investment Valuation Practices in the UK. In Proceedings of the Annual Conference of the European Real Estate Society, Milan, Italy, 23–26 June 2010. [Google Scholar]
- Iroham, C.O.; Oluwunmi, A.O.; Simon, R.F.; Akerele, B.A. Assessing the Trend in Rental Values of Commercial Properties Along Oyemekun. Covenant J. Res. Built Environ. (CJRBE) 2014, 1, 10–29. [Google Scholar]
- Aron, J.; Muellbauer, J.N.J. Some Issues in Modeling and Forecasting Inflation in South Africa; Social Research; SSRN: Rochester, NY, USA, 2009; pp. 29–31. Available online: https://ssrn.com/abstract=1356392 (accessed on 24 August 2023).
- Olanrele, O.O.; Adegunle, T.O.; Fateye, O.B.; Ajayi, C.A. Causal Relationship between N-REIT ’s Dividend Yield and Money Market Indicators. J. Afr. Real Estate Res. 2019, 4, 71–91. [Google Scholar]
- Munusamy, M.; Muthuveerappan, C.; Baba, M. An Overview of the Forecasting Methods Used in Real Estate Housing Price. J. Teknol. 2015, 5, 189–193. [Google Scholar] [CrossRef][Green Version]
- Jadevicius, A.; Sloan, B.; Brown, A. Examination of Property Forecasting Models—Accuracy and Its Improvement Through Combination Forecasting; School of Engineering and the Built Environment, Edinburgh Napier University: Edinburgh, UK, 2012; p. 20. [Google Scholar]
- Tsolacos, S. The role of sentiment indicators for real estate market forecasting. J. Eur. Real Estate Res. 2012, 5, 109–120. [Google Scholar] [CrossRef]
- Jadevicius, A.; Sloan, B.; Brown, A. Property Market Modelling and Forecasting: A Case for Simplicity. In Proceedings of the 20th Annual European Real Estate Society Conference, Vienna, Austria, 3–6 June 2013; pp. 3–6. [Google Scholar]
- Buehler, M.M.; de Almeida, P.R. Understanding the Commercial Real Estate Investment Ecosystem. An Early Warning System Prototype; World Economic Forum: Geneva, Switzerland, 2016. [Google Scholar]
- Chrostek, K.; Kopczewska, K. Spatial Prediction Models for Real Estate Market Analysis. Ekonomia 2013, 35, 25–43. [Google Scholar]
- Füss, R.; Stein, M.; Zietz, J. A Regime-Switching Approach to Modeling Rental Prices of U.K. Real Estate Sectors. Real Estate Econ. 2012, 40, 317–350. [Google Scholar] [CrossRef]
- Moolman, E.; Jordaan, J. Can Leading Business Cycle Indicators Predict the Direction of the South African Commercial Share Price Index? S. Afr. J. Econ. 2005, 73, 68–78. [Google Scholar] [CrossRef]
- Tsolacos, S.; Brooks, C. Real Estate Modelling & Forecasting; Cambridge University Press: New York, NY, USA, 2010. [Google Scholar]
- Udoekanem, N.; Ighalo, J.; Sanusi, Y. Predictive Modeling of Office Rent in Selected Districts of Abuja, Nigeria. Real Estate Manag. Valuat. 2015, 23, 95–104. [Google Scholar] [CrossRef]
- Anas, J.; Laurent, F. Detecting Cyclical Turning Points. J. Bus. Cycle Meas. Anal. 2004, 2004, 193–225. [Google Scholar] [CrossRef]
| Disclaimer/Publisher’s Note: The statements, opinions and data contained in all publications are solely those of the individual author(s) and contributor(s) and not of MDPI and/or the editor(s). MDPI and/or the editor(s) disclaim responsibility for any injury to people or property resulting from any ideas, methods, instructions or products referred to in the content. |
© 2023 by the authors. Licensee MDPI, Basel, Switzerland. This article is an open access article distributed under the terms and conditions of the Creative Commons Attribution (CC BY) license (https://creativecommons.org/licenses/by/4.0/).


