1. Introduction
Modern chemical industries focus on detecting and diagnosing faults as early as possible to increase production yield [
1]. Effective fault-detection techniques available in the literature require the regular availability of measurements [
1]. However, some variables in chemical processes are measured online, while other qualitative variables are measured offline. Measurement of these offline quality variables requires human involvement, which makes the system an irregularly sampled multi-rate system [
2]. Fault-detection techniques for multi-rate systems include state space estimation techniques and data-based modelling methods. State space estimation techniques require accurate system models, which are difficult to model for complex chemical engineering systems. Compared to the above methods, another data-driven approach uses measurement data to model the system’s behaviour. These data-driven methods for multi-rate systems require down-sampling, up-sampling and re-sampling. While the down-sampling approaches will lose essential information during modelling, the up-sampling methods heavily rely on the correctness of the predictions [
3]. In most chemical processes, the variation in sample rates is too significant, resulting in unmanageable complexity in the re-sampling models. The MPPCA method does not require down-sampling, up-sampling and re-sampling of multi-rate data. It uses multi-rate data to build an inferential model that can handle multiple measurement classes. The MPPCA method is an extension of probabilistic principal component analysis (PPCA) which uses the EM algorithm for parameter tuning.
In this study, the effectiveness of the MPPCA method in detecting various faults for the multi-rate nonlinear chemical process TPRCR is studied, and fault detection is carried out by using T2 and SPE statistics.
The remainder of this paper is organised as follows.
Section 2 gives details about the MPPCA method and model parameter estimation. Then,
Section 3 details the TPRCR model.
Section 4 implements a fault-detection technique on TPRCR. Finally, conclusions are made in the last section.
2. MPPCA Method
The MPPCA model combines several-rate data into a single model without down- or up-sampling. In our article, we have considered the MPPCA model with three different classes of measurements, and it is given by the following equations:
In Equations (1)–(3), x1 ∈ RK1×M1, x2 ∈ RK2×M2, and x3 ∈ RK3×M3 are three different rate measurements classes in which x3 is the slowest and x1 is the fastest measurement. ∈ RM1×D, ∈ RM2×D and ∈ RM3×D are loading matrices with three different sampling rates. t ∈ RD is a latent variable which extracts a restricted link between data with varied sampling rates and helps develop one single model. The latent variable is assumed to have a Gaussian distribution with a zero mean and unit variance. ε1 ∈ RM1, ε2 ∈ RM2 and ε3 ∈ RM3 are used to model the corresponding isotropic Gaussian noises.
The sequence of the measurements can be altered for easier notation and visualisation on the premise that all sample variables are independent. The whole observation (
V) comprises three divisions of the observed data. The first sample contains all observations with dimensions M1 + M2 + M3 (
V3), the following sample variables have dimensions M1 + M2 (
V2), and the last one contains only M1 (
V1) variables. As a result, the entire observation set is expressed as a union of all three.
The EM technique is used to estimate model parameters for the MPPCA model. The method repeats the expectation step (E-step) and the maximisation step (M-step) until convergence. In the E-step, the current model parameters are utilised to estimate the posterior distributions of the latent variables. The model parameters are then adjusted in the M-step by maximising log likelihood. One reference contains a detailed explanation of the step of the EM algorithm for MPPCA training [
4].
SPE statistics can be used to detect abnormal behaviour in measurements. There are three different classes of measurements, so three different
SPE statistics are used to detect any anomaly in measurement.
Since each
SPE statistic is compiled based on the prediction errors of different classes of measurements, it clearly shows that a given fault is caused by a certain class of measurements. The confidence bound of
SPE statistics can be predicted by χ
2-distributed approximation:
SPE~g., in which
g and
h are the parameters of the χ
2 distribution, and they are given by [
5].
3. Two-Phase Reactor–Condenser System with Recycle
The process depicted in
Figure 1 includes a two-phase reactor and condenser [
6]. Reactants
A and
B are introduced into the reactor at molar flow rates
FA and
FB and temperatures
TA and
TB, respectively, in the vapour and liquid phases. Reactant
A diffuses into the liquid phase at rate
NA1, where an exothermic reaction occurs, which is given by Equation (10).
Product
C diffuses into the vapour phase at a rate
Nc1, whereas reactant
B is non-volatile. The interphase mass transfer resistance is assumed to be minimal, and the Arrhenius equation provides the reaction rate in the bulk liquid phase, which is given by Equation (11).
where
rA is the rate at which reactant
A is consumed at temperature
T1. The preexponential factor and activation energy are denoted by
k10 and
Ea, respectively.
is the liquid molar holdup in the reactor, and
is the liquid density
. xA1 and
xB1 are
A and
B mole fractions in the liquid phase. For the sake of simplicity, heat capacity, density, and molar heat of vaporisation are considered to be constant and equal for all species. The liquid and vapour phases are suitable combinations. The liquid stream from the reactor is withdrawn at a constant flow rate
F1l, while the vapour stream enters the condenser at a flow rate
F1v. The vapour in the condenser is cooled to
T2 to improve product purity by eliminating reactant A from the liquid.
The reactant A-rich liquid phase in the condenser is returned to the reactor at a flow rate of F2l, while the product vapour phase departs the condenser at a flow rate of F2v and a composition of yA2.
Equations (12)–(29) give a detailed differential algebraic equation (DAE) model used to train the MPPCA model for data generation.
The system parameter values are given in
Table 1.
4. Fault Detection Using MPPCA for the TPRCR System
Three types of measurements are used to train the MPPCA model. Fast-rate measurements include temperature, pressure, and flow rates available every second (x1). Medium-rate measurements include molar holdups available every fifteen seconds (x2), and slow-rate measurements include mole fractions available every sixty seconds (x3).
The MPPCA model is trained with 7200 samples of fast-rate measurements, 480 samples of medium-rate measurements, and 120 samples of slow-rate observations. The fault identification capability of the MPPCA approach is assessed using the six categories of faults indicated in
Table 2.
For a fair comparison, all detection models in this work have a level of significance of 0.99 for the
SPE and
T2 statistics.
Table 3 shows the false alarm rates for normal data and the missing detection rates for faults, where Fault 0 represents normal test data and that the monitoring results are false alarm rates. The false alarm rate is the fraction of normal data that is interpreted as problem data. Similarly, the missing detection rate is the fraction of the defect data that are treated as normal data.
Table 3 shows the monitoring results of all faults using
T2 and different
SPE statistics for the MPPCA model.
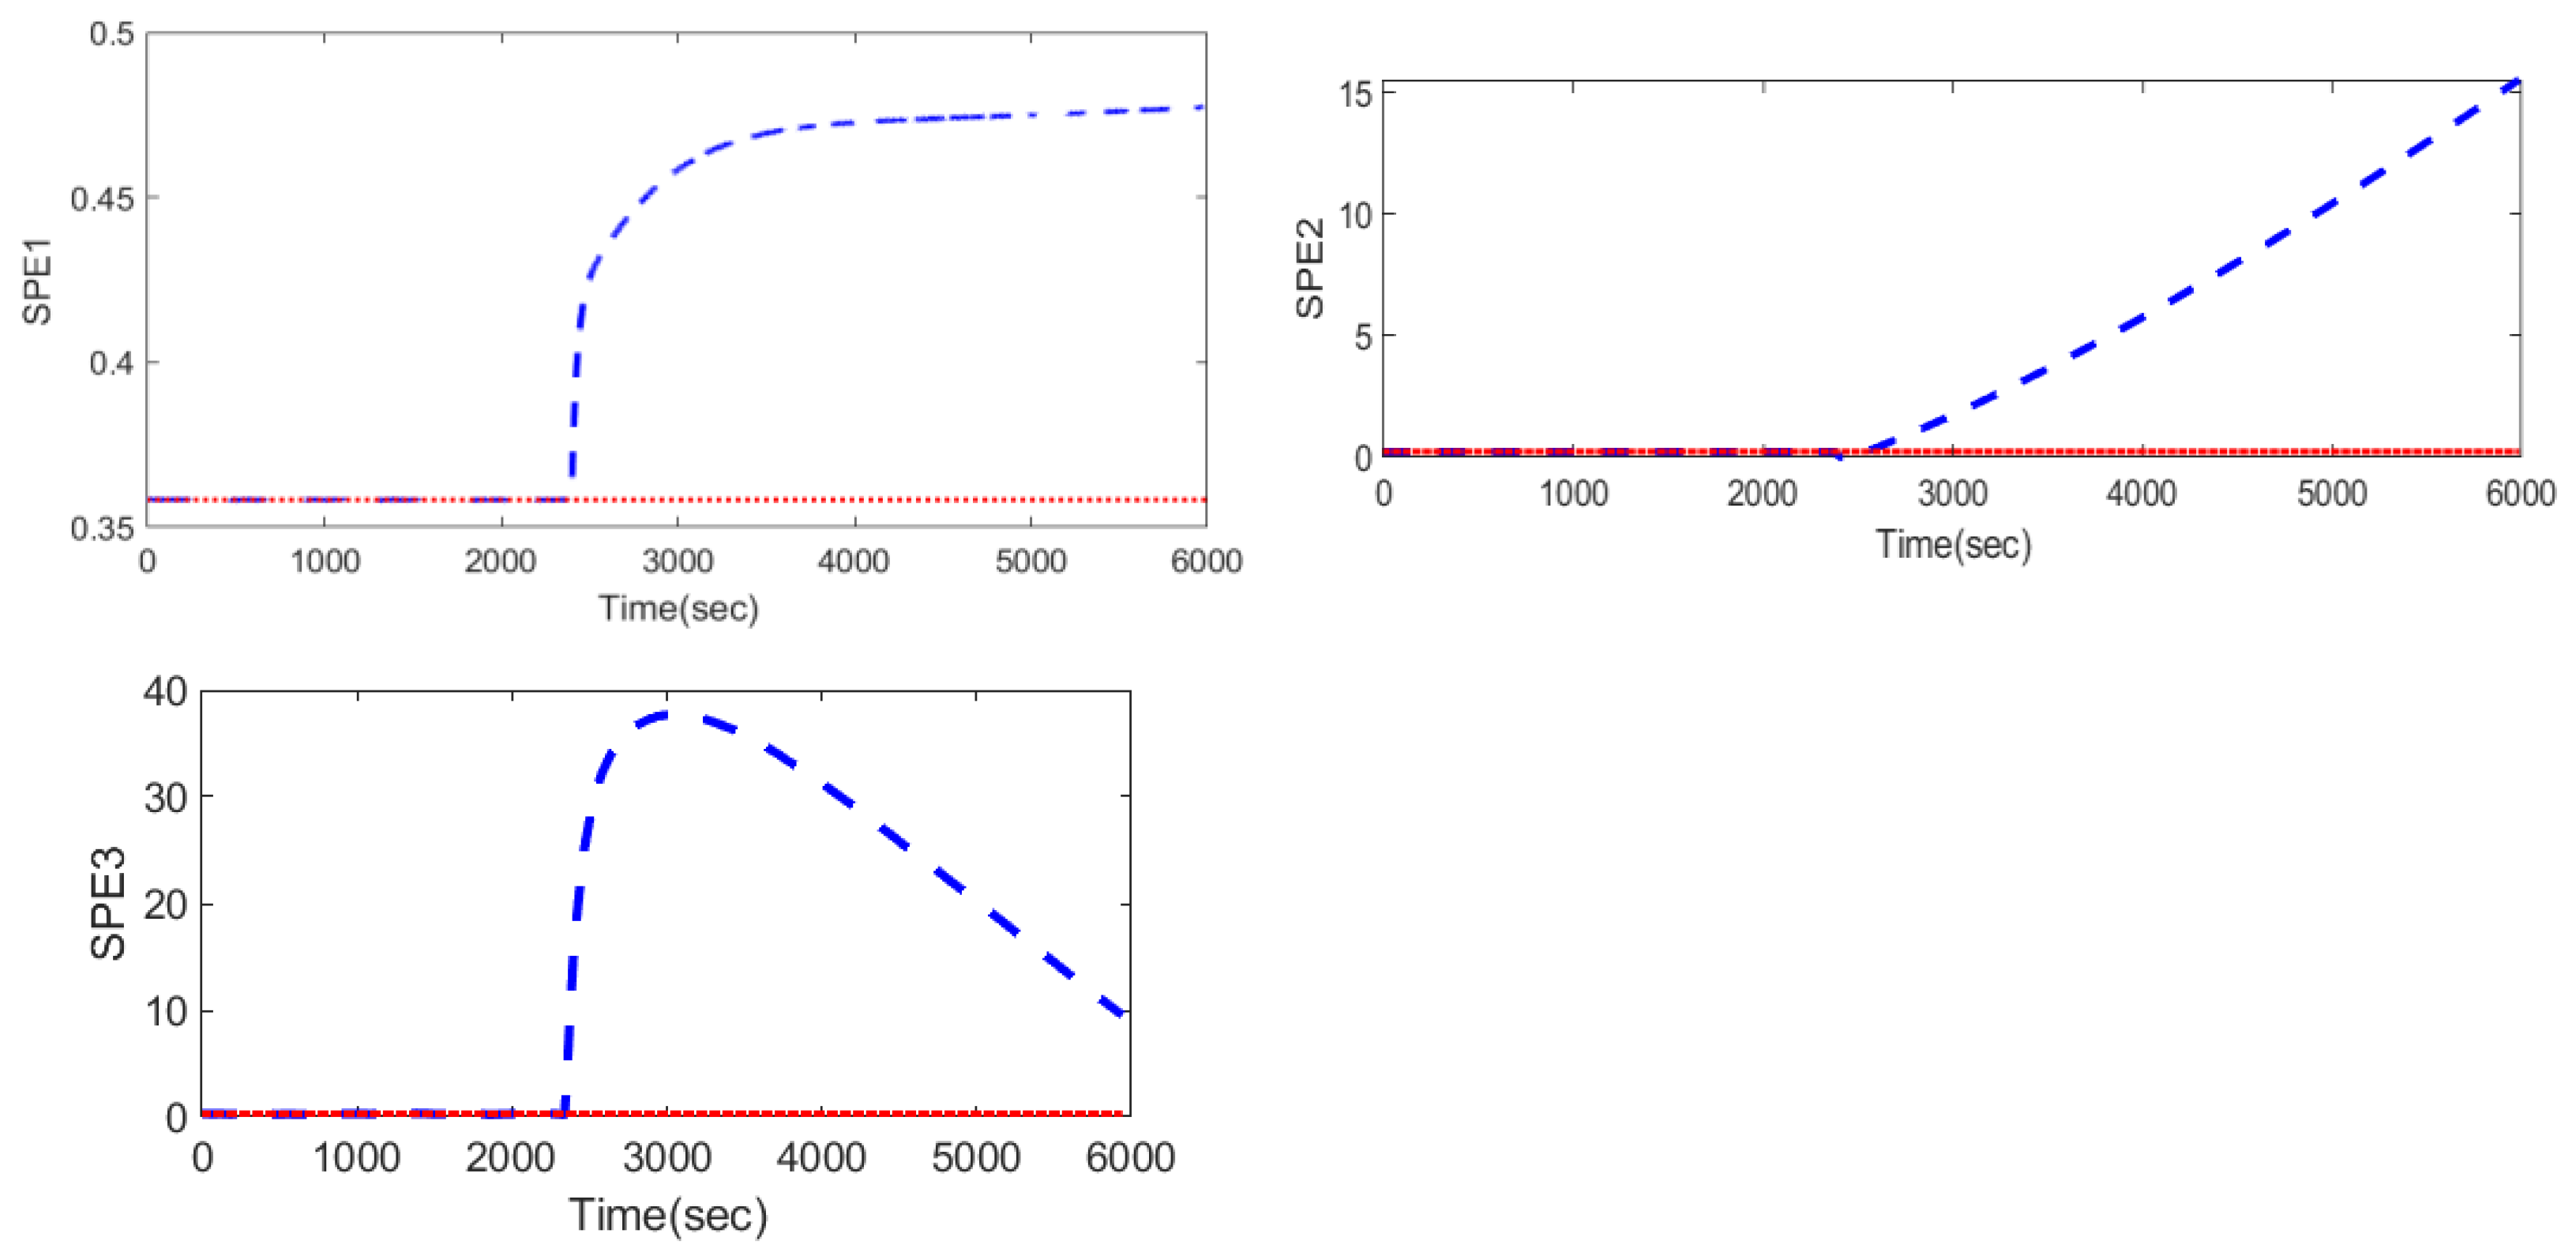
Three different
SPE statistics are used to see which fault will have an effect on which SPE statistic.
Figure 2 shows
SPE statistics for the fault in flow rate of
A (FA), which suggests that this fault affects all three
SPE statistics.
5. Conclusions
In this paper, the TPRCR system is modelled as a multi-rate system due to the involvement of qualitative variables, including three different classes of measurements. These measurements are used to develop the MPPCA model using the EM algorithm. This developed MPPCA model is used to detect faults by developing T2 and three different SPE statistics for each measurement class. Six different types of faults are used to check the effectiveness of the developed MPPCA model, and, from the monitoring results, we can clearly say that the MPPCA model can detect faults with a high detection rate.
Author Contributions
Conceptualization, D.G. and M.S.; methodology, D.G. and M.S.; investigation, D.G. and M.S.; writing—original draft preparation, D.G.; writing—review and editing, M.S.; supervision, M.S. All authors have read and agreed to the published version of the manuscript.
Funding
This research received no external funding.
Institutional Review Board Statement
Not applicable.
Informed Consent Statement
Not applicable.
Data Availability Statement
Not applicable.
Conflicts of Interest
The authors declare no conflict of interest.
References
- Venkatasubramanian, V.; Rengaswamy, R.; Yin, K.; Kavuri, S.N. A review of fault detection and diagnosis. Part III: Process history based methods. Comput. Chem. Eng. 2003, 27, 327–346. [Google Scholar] [CrossRef]
- Srinivasarao, M.; Patwardhan, S.C.; Gudi, R.D. Nonlinear predictive control of irregularly sampled data systems using identified observers. Lect. Notes Control Inf. Sci. 2007, 358, 141–149. [Google Scholar] [CrossRef]
- Zhu, J.; Ge, Z.; Song, Z. Robust semi-supervised mixture probabilistic principal component regression model development and application to soft sensors. J. Process Control 2015, 32, 25–37. [Google Scholar] [CrossRef]
- Zhou, L.; Chen, J.; Jie, J.; Song, Z. Multiple probability principal component analysis for process monitoring with multi-rate measurements. J. Taiwan Inst. Chem. Eng. 2019, 96, 18–28. [Google Scholar] [CrossRef]
- Box, G.E.P. Some Theorems on Quadratic Forms Applied in the Study of Analysis of Variance Problems, I. Effect of Inequality of Variance in the One-Way Classification. Ann. Math. Stat. 1954, 25, 290–302. [Google Scholar] [CrossRef]
- Kumar, A.; Daoutidis, P. Feedback Regularization and Control of Nonlinear Differential-Algebraic-Equation Systems. AIChE J. 1996, 42, 2175–2198. [Google Scholar] [CrossRef]
| Disclaimer/Publisher’s Note: The statements, opinions and data contained in all publications are solely those of the individual author(s) and contributor(s) and not of MDPI and/or the editor(s). MDPI and/or the editor(s) disclaim responsibility for any injury to people or property resulting from any ideas, methods, instructions or products referred to in the content. |
© 2023 by the authors. Licensee MDPI, Basel, Switzerland. This article is an open access article distributed under the terms and conditions of the Creative Commons Attribution (CC BY) license (https://creativecommons.org/licenses/by/4.0/).


