Proceeding Paper

Automated and Enhanced Leucocyte Detection and Classification for Leukemia Detection Using Multi-Class SVM Classifier †

1
MIT School of Engineering, MIT ADT University, Pune 412201, India
2
School of Technology Management & Engineering, SVKM’s NMIMS University, Navi Mumbai 410210, India
*
Author to whom correspondence should be addressed.
Presented at the 2nd International Electronic Conference on Processes: Process Engineering—Current State and Future Trends (ECP 2023), 17–31 May 2023; Available online: https://ecp2023.sciforum.net/.
Eng. Proc. 2023, 37(1), 36; https://doi.org/10.3390/ECP2023-14710
Published: 19 May 2023

Abstract

:
In this day and age, surrounded by innumerable forms of technology, the use of various autonomous systems to recognize various ailments has tremendously benefited the medical industry. An important medical practice is the visual evaluation and counting of white blood cells in microscopic peripheral blood smears. Invaluable details regarding the patient’s health may be revealed, such as the discovery of acute lymphatic leukaemia or other serious disorders. This study provides a paradigm for detecting acute lymphoblastic leukemia from a microscopic vision of white blood cells. Microscopic images must go through a thorough pre-processing phase before being classified. In this study, WBCs are separated from blood smear images using morphological techniques, and the segmented region is then searched for a set of textural, geometrical, and statistical properties. Four different machine learning techniques are used to examine the performance of these algorithms: random forest (RF), support vector machine (SVM), naive Bayes classifier (NB), and K nearest neighbor (KNN). The SVM is effective in classifying and identifying the acute lymphoblastic cell that produces leukemia malignancy, as can be observed after careful comparison. A single classifier is virtually completely useless given the variety of blood smear pictures. As a result, we considered using EMC-SVM to classify leukocytes. The suggested method successfully distinguishes white blood cells from sample blood smear images, and accurately categorizes each segmented cell into the relevant group.

1. Introduction

A crucial task carried out by doctors is diagnosis, which involves assessing a dataset to determine whether a disease is present. These data, which can include indications, symptoms, photographs, and exams, are crucial to identifying disorders [1,2]. An incorrect diagnosis brought on by an ineffective examination may result in the patient experiencing side effects, since potentially inappropriate medications may be prescribed for the treatment of a certain ailment. There are low-cost computing systems that analyze and interpret the data, offering diagnostic aid to specialists at this important stage.
The three types of blood cells that make up the majority of the blood are red blood cells, platelets, and white blood cells. All tissues receive oxygen from the heart through red blood cells, which also expel carbon dioxide. Up to 50% of the entire blood volume is made up of these cells. White blood cells (WBCs) play important roles in the immune system, as well as being the body’s first line of defence against infection and disease. Therefore, correctly classifying WBCs is crucial and is becoming increasingly required. WBCs can be split into two categories based on the appearance of their cytoplasm [3].
We can also identify platelets and RBCs and count the number of cells, determine their sizes, and determine the typical cell percentages in human blood by processing microscopic blood smear photographs [4]. The five subcategories of leukocytes are monocytes, lymphocytes, basophils, eosinophils, and neutrophils. Multi-class classification is considered the best approach for diagnosing and accurately detecting leukocytes and their underlying sub-class, as it can be utilized to quickly identify each category [5].
Different picture characteristics, such as edges, geometric, statistical, and statistical features, as well as the histogram of gradients (HOG), are used to categorize images. Pre-processing, which includes noise reduction, contrast control, and image sharpening, is the initial step in the classification of images. Various methods are employed to improve microscopic pictures. The improved image is then further processed to separate the WBCs using various segmentation methods [6,7,8].
In several disciplines, including medical diagnostics systems, important patterns for prediction tasks have been extracted using machine learning-based networks [9]. If the illness is identified early and treated in the interim, death rates can be reduced. This makes things desperate and it takes a long time for the hematologist to physically find the sickness. To overcome these issues, computer-aided techniques for leukemia detection are very effective, quick, and accurate [10]. However, the computer-aided approach still faces a number of issues, obstacles, and research gaps, such as the accuracy of the detection of leukemia cancer and its types (acute myelogenous leukemia, acute lymphoblastic leukemia, and multiple myeloma), as well as their further segmentation and categorization. The goal of this study is to determine the leukemia subtype and detect the disease.

2. Literature Review

This section provides a synopsis of the most cutting-edge methods currently available for classifying and segmenting leukocytes. The increasing advancement of methodologies has allowed for us to investigate the relevance of leukocyte segmentation and categorization, which play an active part in medical haematology to diagnose various hepatic disorders.
In [11,12], a number of mathematical operations and techniques were developed to reduce noise and enhance image clarity. Then, procedures for gamma correction and contrast enhancement were applied. The accuracy of an account was extensively segmented. Leukocyte localization and f-area extraction were the first two steps in the two-step technique for picture segmentation. Each technique has three further steps. Localization, thresholding, three-phase filtration, identifying neighboring cells, and cell extraction are examples of sub-steps. The cytoplasm, nucleus, and localization of the nucleus areas were also extracted.
Thresholding and mathematical morphology [13] were used to section off the nucleus of the cell. Morphology is a mathematical technique that separates white blood cells (WBCs), red blood cells (RBCs), and platelets from one another. This [14] technique employs addition and subtraction to blood smear images. The image was divided into background and foreground using threshold segmentation, and the best threshold value for WBC segmentation was then chosen. For the classification of leukocytes, geometric characteristics were retrieved and an SVM classifier was applied [15].
Several strategies have been presented to address the issue of overlapping blood cells. These algorithms divide cells either by eroding and growing regions that keep the shape or combine concave spots with dividing lines [16,17] As part of this study, we also propose an algorithm for cell separation that uses information about the blood cell’s shape to construct a conical curve that separates the overlapping sections [18].

3. Proposed Framework

The suggested architecture involves a few steps from an input blood sample image, which are applied to the final results. The input photos are first gathered. These photographs often come in a range of sizes and resolutions. They are useful for every type of experiment and analysis due to their homogeneous size. For the distinct region of interest, these photos are subsequently shrunk and color-filtered. It can be difficult to find attributes that are appropriate for the goal-mining algorithm. The Canny edge detector and HOG feature descriptor are used to accomplish feature identification and describe the images after a rigorous inspection of the images, taking our purpose into account. Principle component analysis is used to decrease the feature dimensions. Random forest, naive Bayes classifier, support vector machine, and logistic regression are used for classification. Figure 1 describes each step of the proposed methodology. In the preprocessing phase, various operations, such as resizing, noise removal, and contrast adjustment, are carried out, and then features are extracted. After that, dimension reduction is applied for PCA, and finally classification is carrried out using classifiers. At the final stage, a multiclass classifier is used for classification.

3.1. Dataset Description

The All-IDB1 [19] and own acquired photos from pathology were used to obtain microscopic images of white blood cells for the suggested technique. There are 1208 photos in this dataset. A total of 549 of these photos are benign, while 659 of them are malignant. There are roughly 93,000 blood components. Lymphocytes are labeled in this dataset. There are 5510 lymphoblasts among the components. Figure 2 describes the sample images from the dataset under various different conditions. These images are used to extract the features and obtain the final classification.

3.2. Image Pre-Processing

The term “image pre-processing” refers to the preliminary steps taken with an image before any further processing. If information is quantified by entropy, then these actions have the opposite effect, increasing the image’s information value. The goal of pre-processing is to improve the quality of the picture data by reducing artifacts such as noise and enhancing features such as contrast, which will be used in subsequent analyses. When processing a picture, redundancy can be quite helpful. Adjacent pixels representing the same physical object have similar or identical brightness values. If a deformed pixel is located in the image, it can be restored by taking the average of the values of the pixels immediately surrounding it. One way to classify picture pre-processing methods is by the size of the pixel neighborhood used in the calculation of the new pixel brightness. During the pre-processing phase, we eliminated the backdrop, cut off the surplus of blood flow, enhanced the image, reduced the noise, filtered the image, and sharpened it.

3.3. Feature Extraction

Before being used for further categorization, the obtained visual data must first undergo a process called feature extraction, during which they are turned into a specific collection of features and labeled. At this point, the characteristics of objects that were segmented from either the entire image or specific areas of the image are retrieved and recognized. In other words, feature extraction is the process of creating a set of features from the visual input in order to recognize patterns. The objects in the image can each be parsed for a variety of characteristics, including [20] shape characteristics (such as area, perimeter, and solidity), texture characteristics (such as homogeneity, energy, angular second, and others), statistical characteristics (such as mean, skewness, and variance), geometrical characteristics (such as perimeter, area, compactness, and symmetry), and color characteristics.
These characteristics can be extracted from the objects in the image. Because blast cells (ROI) carry a multitude of information, including information about their cytoplasm and nucleus, the feature-extraction stage is critical for identifying the kind of acute leukemia. The retrieved photos show rounded cells. For convenience, during feature detection, an intelligent edge detection algorithm is applied to each image. A Gaussian filter is used to smooth the image and get rid of noise. Next, we calculate the intensity variations within the image. The two-fold threshold is then applied to locate possible image boundaries. Hysteresis is then used to follow the contours of the image. To finish the edge identification process, weak edges that are not related to strong edges are suppressed. Figure 3 describes the step-by-step effect on the sample images. Figure 3a shows a sample image after the processing and color filtering; Figure 3b shows the image after performing the operation. Figure 3c shows the effect after the feature-extraction process and Figure 3d shows the effect after the feature-description process.

3.4. Feature Dimension Reduction

Feature extraction, which comes after segmentation, is a crucial step in accurate classification. Features are adjectives that describe an image and indicate their inherent similarities. The classifier then uses these features and their labels to match various photos and categorize them into distinct classes [21]. Using the HOG feature descriptor, each image is converted into a feature vector, a one-dimensional array. The speed may be affected by this feature vector’s 352,836 dimensions, which is a relatively large number. The resultant array’s dimensions or columns are reduced using the the principal component analysis (PCA) dimension reduction approach. The purpose of using PCA was to lower the size of the final feature vector and, as a result, enhance performance. In this study, only the top ten principle components were employed for classification, which results in a feature vector with a size of 10.

3.5. Classification

With so many available options, we decided to employ a wide range of strategies in this role. Several models were used to perform the classification, some of which used the whole feature vector while others used feature selection to reduce the dimensionality. Classification models such as naive Bayes [22], SVM, K-nearest neighbour with varying values of K, and random forest were tried and tested. We compared the performance of K-nearest neighbour, naive Bayes, and random forest, three sequential forward-feature-selection methods.
Since there is no test set in the dataset, we split it up into five equal portions. Four were used during instruction and two during testing using cross-validation. Matching accuracy, precision, recall, and f1-score were calculated for each test performed on each fold. The results were then averaged to make a model evaluation. Separately evaluating each “fold” of the experiment improves the reliability of the results.

3.6. Multi-Class Classification

After feature extraction, choosing the appropriate classifier is a crucial step that requires both the input and the expected outcome to be considered. Even though many classifiers are binary classifiers, they can be used for multi-class classification. In the suggested work, we divided leukocytes into five classes using a multi-class categorization. This is a result of the variety of blood smear pictures, for which it is impractical to train a single classifier due to its poor performance. Experimentation has demonstrated that multi-class classifiers outperform conventional techniques.

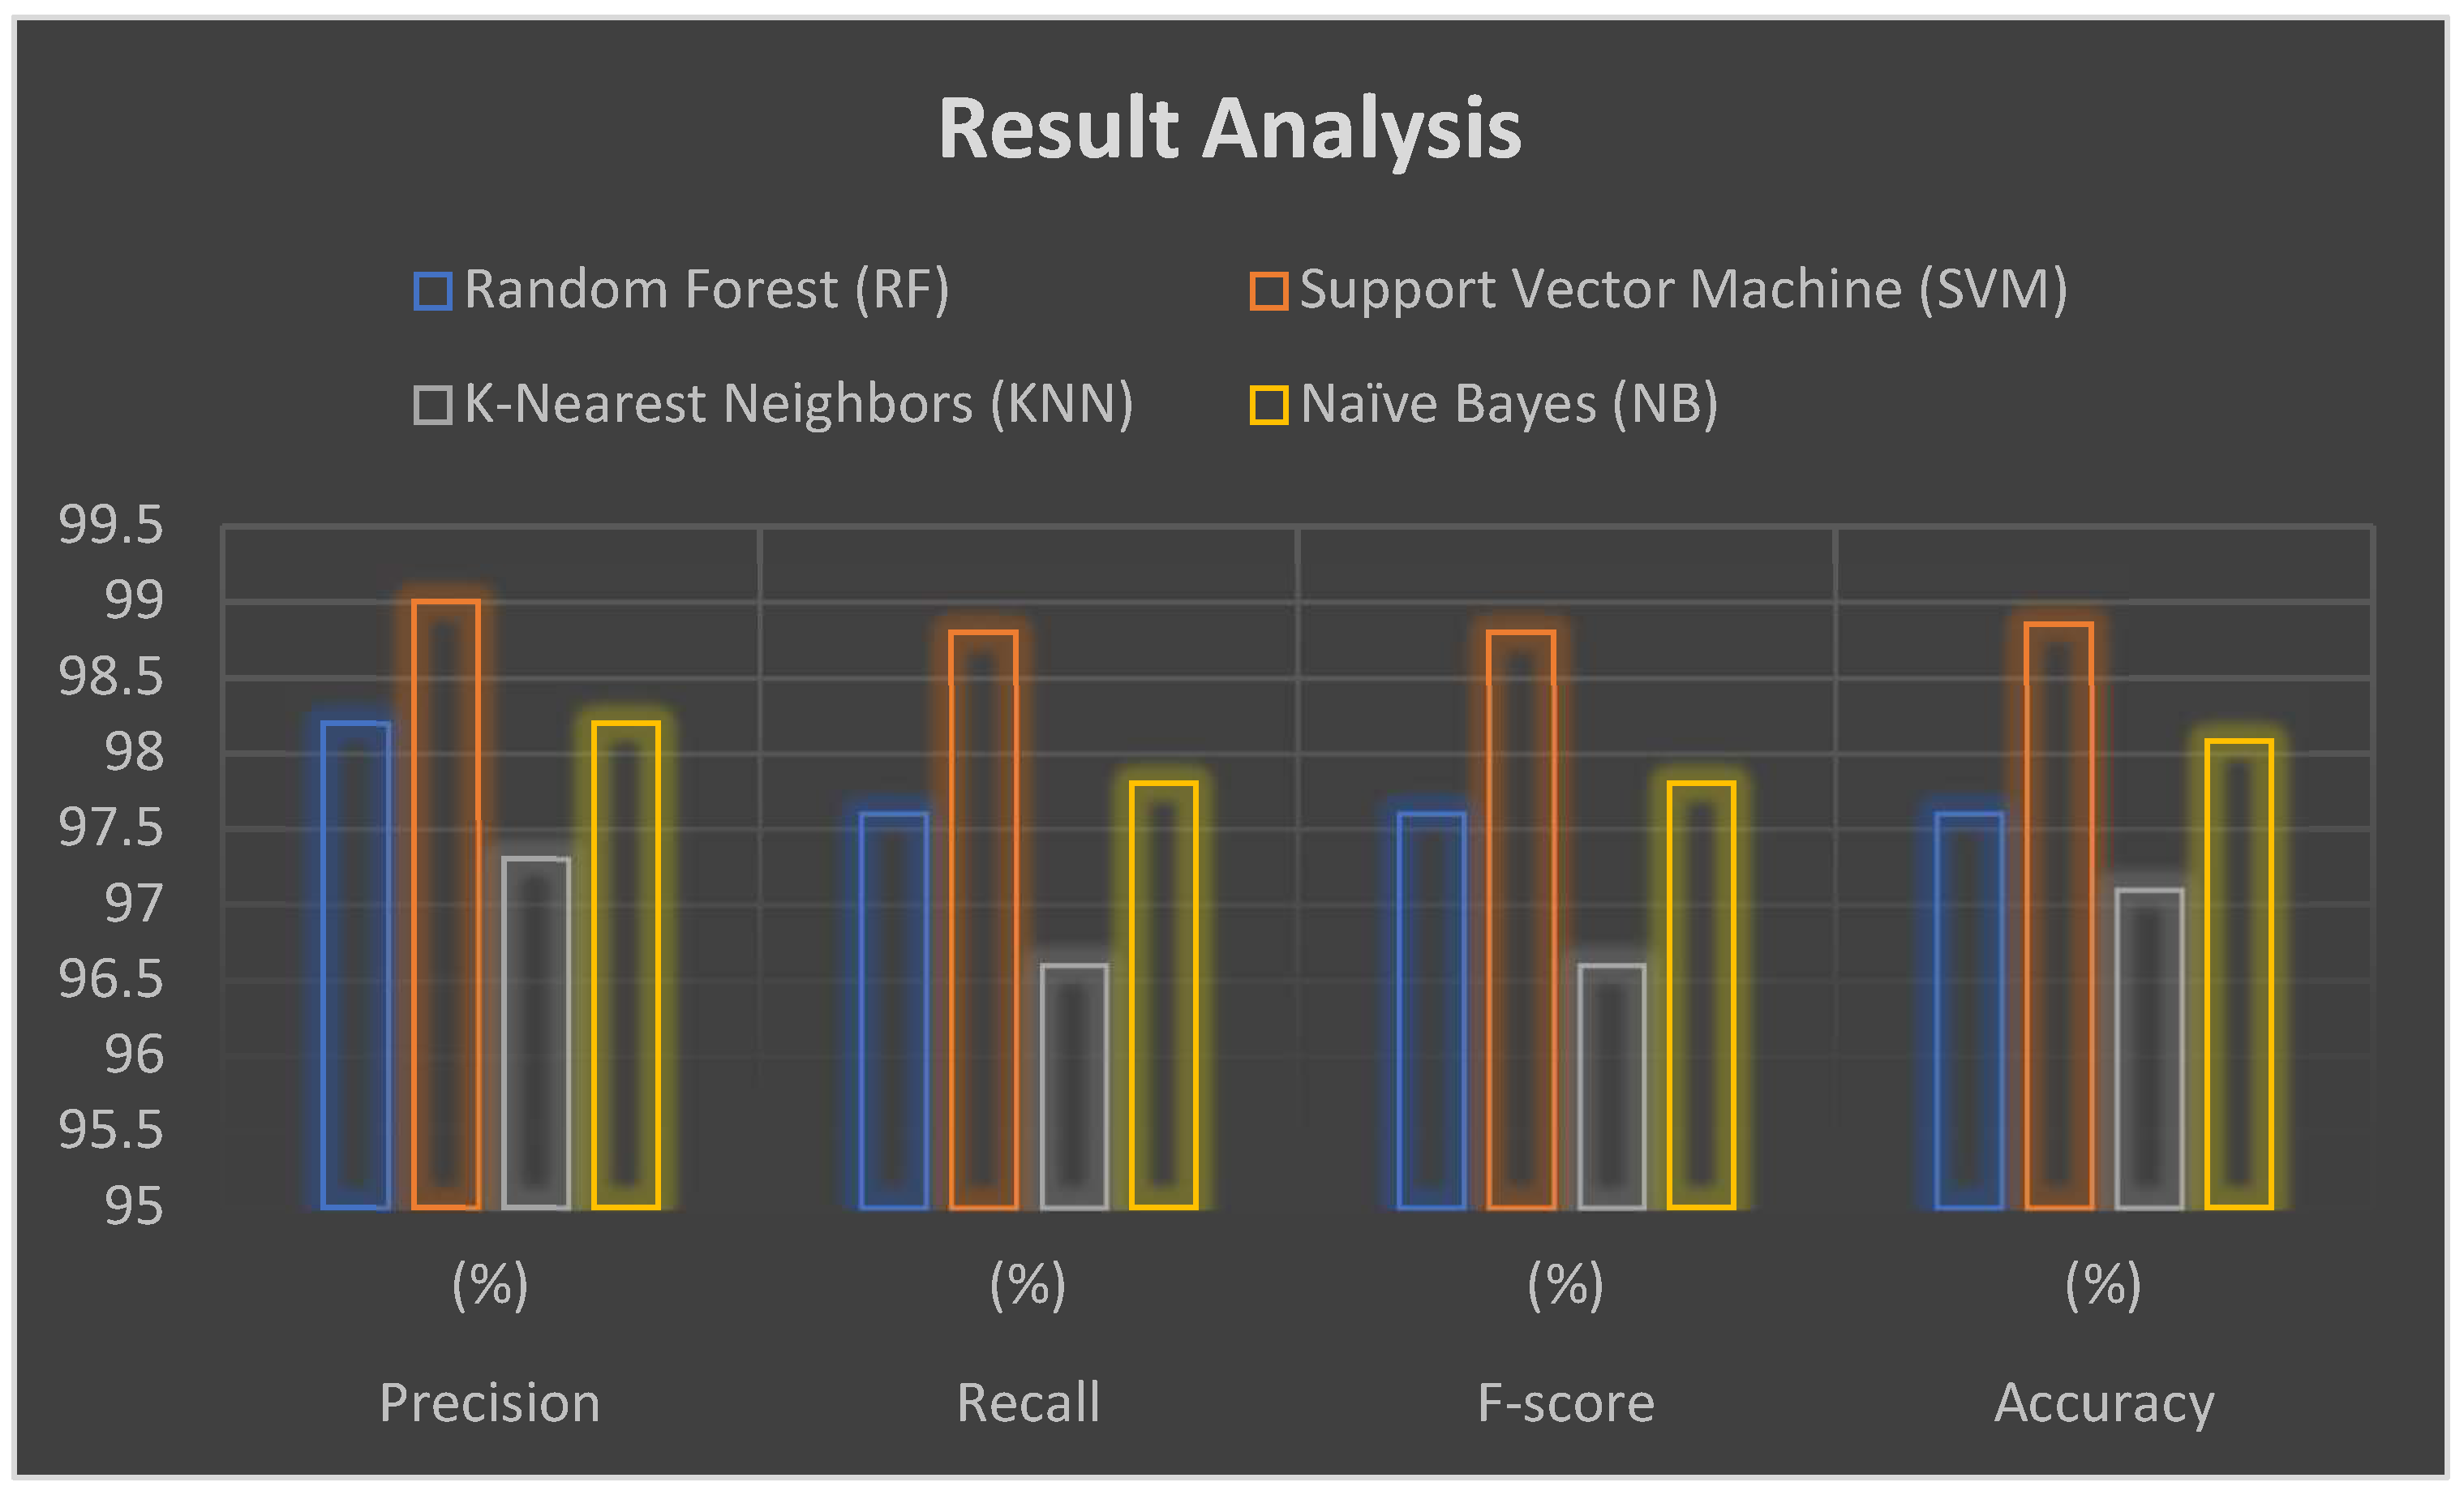
4. Result and Discussion

Both the qualitative and quantitative aspects of the experimental results of the suggested hybrid model classification methodology are provided. Using the information we acquired, we put the suggested strategy to the test. For diagnosis, the leukocytes were specifically segmented so that the structure and colour of their nuclei could be seen clearly. The underlying truth was contrasted with the suggested technique. This algorithm is capable of accurately locating and dividing the five kinds of leukocytes. Three metrics were used to evaluate the proposed segmentation technique: false-positive rate (FPR), false-negative rate (FNR), and F- measure. Table 1 illustrates the results obtained from the proposed model. Table 1 focuses on the performance metrics of the various classifiers used in the research. Table 1, showing the comparative analysis, describes the accuracy, precision, recall and F-score values for classifiers. Support vector machine obtained the best performance metric results compared to other classifiers. Figure 4 describes the comparison graph that was used for analysis. This figure focuses on classifier performance in terms of the performance metrics defined in the research.

5. Conclusions

Leukaemia is a type of blood cancer that commonly affects children and adults. The type of cancer and the extent of its dissemination throughout the body affect leukemia treatment. For the patient to receive the right care and heal, the disease must be identified as soon as feasible. This study presents a novel strategy for the totally automatic identification and classification of leukocytes utilizing microscopic images. The purpose of this work is to provide an automated technique to support medical activity in the detection of acute lymphocytic leukemia (ALL).
In order to do so, we presented a revolutionary approach. The suggested approach successfully separates WBCs from blood smear images and correctly categorizes each segmented cell according to experimental data. When compared to other classifiers, the suggested classifier was shown to have greater accuracy. Multi-class classifiers improve overall accuracy when classifying the different leukocyte subtypes. Additionally, increasing the dataset’s size will be necessary to provide the classification model with more examples to use during the training phase and to enable us to apply a validation method other than 10-fold cross-validation.

Author Contributions

P.M. and R.S. contributed equally to this work. All authors have read and agreed to the published version of the manuscript.

Funding

This research received no external funding.

Institutional Review Board Statement

Not applicable.

Informed Consent Statement

Not applicable.

Data Availability Statement

Restrictions apply to the availability of these data. Data was obtained from [19] and are available [10.1109/ICIP.2011.6115881] with the permission of [19].

Conflicts of Interest

The authors declare no conflict of interest.

References

  1. Sajjad, M.; Khan, S.; Shoaib, M.; Ali, H.; Jan, Z.; Muhammad, K.; Mehmood, I. Computer Aided System for Leukocytes Classification and Segmentation in Blood Smear Images. In Proceedings of the 2016 International Conference on Frontiers of Information Technology (FIT), Islamabad, Pakistan, 19–21 December 2016; pp. 99–104. [Google Scholar] [CrossRef]
  2. Deng, L. An accurate segmentation method for white blood cell images. In Proceedings of the IEEE International Symposium on Biomedical Imaging, Washington, DC, USA, 7–10 July 2002; pp. 245–248. [Google Scholar]
  3. Yang, L.; Meer, P.; Foran, D. Unsupervised Segmentation Based on Robust Estimation and Color Active Contour Models. IEEE Trans. Inf. Technol. Biomed. 2005, 9, 475–486. [Google Scholar] [CrossRef] [PubMed]
  4. Yi, F.; Chongxun, Z.; Chen, P.; Li, L. White blood cell image segmentation using on-line trained neural network. In Proceedings of the 27th International Conference on Engineering in Medicine and Biology Society, Shanghai, China, 17–18 January 2006; pp. 6476–6479. [Google Scholar]
  5. Sholeh, F.I. White blood cell segmentation for fresh blood smear images. In Proceedings of the 2013 International Conference on Advanced Computer Science and Information Systems (ICACSIS), Sanur Bali, Indonesia, 28–29 September 2013; pp. 425–429. [Google Scholar] [CrossRef]
  6. Nazlibilek, S.; Karacor, D.; Ercan, T.; Sazli, M.H.; Kalender, O.; Ege, Y. Automatic segmentation, counting, size determination and classification of white blood cells. Measurement 2014, 55, 58–65. [Google Scholar] [CrossRef]
  7. Won, C.; Nam, J.Y.; Choe, Y. Segmenting cell images: A deterministic relaxation approach. In Computer Vision and Mathematical Methods in Medical and Biomedical Image Analysis; Springer: Berlin/Heidelberg, Germany, 2004; pp. 281–291. [Google Scholar]
  8. Ravikumar, S. Image segmentation and classification of white blood cells with the extreme learning machine and the fast rel-evance vector machine. Nanomed. Biotechnol. 2016, 44, 985–989. [Google Scholar]
  9. Dorini, L.B.; Minetto, R.; Leite, N.J. White blood cell segmentation using morphological operators and scale-space analysis. In Proceedings of the IEEE XX Brazilian Symposium on Computer Graphics and Image Processing, Minas, Gerais, Brazil, 2007; pp. 294–304. [Google Scholar]
  10. Alreza, Z.K.K.; Karimian, A. Design a new algorithm to count white blood cells for classification Leukemic Blood Image using machine vision system. In Proceedings of the 2016 6th International Conference on Computer and Knowledge Engineering (ICCKE), Mashhad, Iran, 20 October 2016. [Google Scholar]
  11. Morea, M.P.; Sugandhib, R. A Review on Systematic Investigation of Leucocytes Identification and Classification Techniques for Microscopic Blood Smear. Comput. Biol. Med. 2020, 116, 103530. [Google Scholar]
  12. Zamani, F.; Safabakhsh, R. An unsupervised GVF snake approach for white blood cell segmentation based on nucleus. In Proceedings of the 2006 8th international Conference on Signal Processing, Guilin, China, 16–20 November 2006; Volume 2. [Google Scholar] [CrossRef]
  13. Döhner, H.; Estey, E.H.; Amadori, S.; Appelbaum, F.R.; Büchner, T.; Burnett, A.K.; Dombret, H.; Fenaux, P.; Grimwade, D.; Larson, R.A.; et al. Diagnosis and management of acute myeloid leukemia in adults: Recommendations from an international expert panel, on behalf of the European LeukemiaNet. Blood 2010, 115, 453–474. [Google Scholar] [CrossRef] [PubMed]
  14. Bodzas, A.; Kodytek, P.; Zidek, J. Automated Detection of Acute Lymphoblastic Leukemia From Microscopic Images Based on Human Visual Perception. Front. Bioeng. Biotechnol. 2020, 8, 1005. [Google Scholar] [CrossRef] [PubMed]
  15. Dorini, L.B.; Minetto, R.; Leite, N.J. Semiautomatic White Blood Cell Segmentation Based on Multiscale Analysis. IEEE J. Biomed. Health Inf. 2012, 17, 250–256. [Google Scholar] [CrossRef] [PubMed]
  16. Bikhet, S.; Darwish, A.; Tolba, H.; Shaheen, S. Segmentation and classification of white blood cells. Contrast Media Mol. Imaging 2002, 4, 2259–2261. [Google Scholar] [CrossRef]
  17. Janani, S.D.; Selvi, R.M.; Mlndhu, G. Notice of Violation of IEEE Publication Principles: Blood Cell Detection and Counting Using Convolutional Sparse Dictionary Learning. In Proceedings of the 2018 International Conference on Current Trends towards Converging Technologies (ICCTCT), Coimbatore, India, 1–3 March 2018; pp. 1–8. [Google Scholar] [CrossRef]
  18. Manik, S.; Saini, L.M.; Vadera, N. Counting and classification of white blood cell using Artificial Neural Network (ANN). In Proceedings of the 2016 IEEE 1st International Conference on Power Electronics, Intelligent Control and Energy Systems (ICPEICES), Delhi, India, 4–6 July 2016; pp. 1–5. [Google Scholar] [CrossRef]
  19. Labati, R.D.; Piuri, V.; Scotti, F. All-IDB: The acute lymphoblastic leukemia image database for image processing. In Proceedings of the 011 18th IEEE International Conference on Image Processing, Sarajevo, Bosnia and Herzegovina, 16–18 June 2011; pp. 2045–2048. [Google Scholar] [CrossRef]
  20. Gautam, A.; Bhadauria, H. Classification of white blood cells based on morphological features. In Proceedings of the 2014 International Conference on Advances in Computing, Communications and Informatics (ICACCI), Delhi, India, 24–27 September 2014; pp. 2363–2368. [Google Scholar] [CrossRef]
  21. Yampri, P.; Pintavirooj, C.; Daochai, S.; Teartulakarn, S. White Blood Cell Classification based on the Combination of Eigen Cell and Parametric Feature Detection. In Proceedings of the IEEE Conference Industrial Electronics and Applications, Singapore, 24–26 May 2006; pp. 1–4. [Google Scholar] [CrossRef]
  22. Prinyakupt, J.; Pluempitiwiriyawej, C. Segmentation of white blood cells and comparison of cell morphology by linear and naïve Bayes classifiers. Biomed. Eng. Online 2015, 14, 63. [Google Scholar] [CrossRef] [PubMed]
Figure 1. Proposed framework.
Engproc 37 00036 g001
Figure 2. Sample images from datasets.
Engproc 37 00036 g002
Figure 3. Sample images after processing: (a) image after color filtering; (b) image after the operation; (c) image after feature extraction; (d) image after feature description.
Engproc 37 00036 g003
Figure 4. Analysis of results.
Engproc 37 00036 g004
Table 1. Comparative analysis.
ClassifierPrecision (%)Recall (%)F-Score (%)Accuracy (%)
Random Forest98.297.6097.6097.60
Support Vector Machine99.0098.8098.8098.85
K-Nearest Neighbors97.3096.6096.6097.10
Naïve Bayes98.2097.8097.8098.08
Disclaimer/Publisher’s Note: The statements, opinions and data contained in all publications are solely those of the individual author(s) and contributor(s) and not of MDPI and/or the editor(s). MDPI and/or the editor(s) disclaim responsibility for any injury to people or property resulting from any ideas, methods, instructions or products referred to in the content.

