Abstract
Phenolic chemicals are poisonous and have long-term impacts on humans and animals. Even in low quantities, as carcinogens, they destroy red blood cells and the liver. These biological waste products pollute groundwater. Thus, removing these organic chemicals to meet discharge limits is difficult. Electrochemical oxidation, redox reactions, membrane separation, and photocatalytic degradation help remove phenolic chemicals from water. Recently, phenolic chemicals have been shown to be removed via adsorption and photocatalysis employing carbon materials and clays. Due to their unique chemical and physical properties, nanometric materials are crucial to these processes. These substances’ structures, classification, entry points, and reactivity or interaction with other aquatic components have been extensively studied. Phenolic substances can be removed from the water before usage. This has led to the development of water treatment technologies and methods like activated carbon adsorption, solvent extraction, the electro-Fenton method, membrane-based separation method, photocatalysis, and others that have been shown to successfully remove phenolic compounds from water. Activated carbon is the most promising adsorbent for numerous contaminants (dyes, metals, etc.). However, low-cost agricultural materials are typically used to switch to more environmentally friendly ones. This study uses low-cost, eco-friendly adsorbents to remediate biomedical effluents. Pyrolysis of potato peels (waste) from a restaurant produced carbon samples. Absorption–desorption experiments examined pH, temperature, starting drug concentration, contact time, and regeneration ability.
1. Introduction
Any waste that is produced during the diagnosis, treatment, or immunization of people or animals, or in research relevant to such processes, as well as in the manufacturing or testing thereof, is referred to as bio-medical waste. This includes both solid and liquid waste, as well as their containers and any intermediate products. It can yield significant environmental problems, such as groundwater contamination [1,2]. Phenolic pollutants are found in wastewater from several industries, including biomedical waste, resin production, high-temperature coal conversion, and petroleum refining [3]. These aromatic hydroxyl compounds are regarded as priority pollutants because they are hazardous at low concentrations, capable of damaging aquatic life, and proven or probable carcinogens at high doses [4]. Phenol enters the environment through industrial effluents and is removed because it is present in many industrial effluents in extremely high concentrations [5]. Due to phenol’s high toxicity and challenging biological degradation, there are strict limits on how much phenol is allowed in the environment [6]. The creation of materials and efficient procedures that enable the removal of these contaminants from water is crucial because these compounds are poisonous and difficult to degrade [7].
2. Methodology
Biomedical model effluent—Stock aqueous solutions of phenol (500 mg/L) were created for the creation of synthetic biomedical solutions by weighing and dissolving the appropriate quantity of the respective component in distilled water. These solutions were then stored and subjected to spectrophotometric analyses to determine their quality. When used, a stock solution was diluted to a lower concentration than its original concentration. Subsequently, 0.467 mL of phenol was dissolved in 1000 mL of distilled water to create a phenol stock solution with a 500-ppm concentration, and the stock solution was then diluted to create other concentrations.
Synthesis of modified activated carbons from potato peels—A potato peel is an advanced green adsorbent since it is rich in high-value elements, particularly polysaccharides, and lignin, which may be burned to produce carbonaceous material. The potato skins used in the experiment were sourced from either Greek cultivars or leftovers from restaurants. The potato peels were thoroughly cleaned with distilled water before being baked in an oven for 24 h at 393 K to eliminate dust and other inorganic contaminants [8]. The dry material was crushed, and then a uniform particle size of 0.45–0.15 mm was obtained using sieving.
Estimation of Sample—A UV–visible spectrophotometer was used to analyze the estimate of phenol. At 270 nm, phenol’s maximum wavelength was discovered [9]. To determine different optical densities at various concentrations, the sample was calibrated. The calibrated findings, which display a graphical depiction of the calibration of phenol, are highly useful for determining the specific phenol removal capabilities of various adsorbents. To calculate the amount of phenol absorbed (qe, mg/g), the following relationship was used [10]:
where V is the volume of the solution (L), M is the weight of the adsorbent utilized (g), and C0 is the initial concentration of phenol (mg/L). Ce is the equilibrium liquid phase concentration of phenol [11]. The following equation was used to express the percentage of phenol elimination:
where Ce denotes the final concentration and C0 denotes the initial concentration of phenol.
3. Results and Discussion
The phenol sample was calibrated to determine different optical densities at different concentrations. The calibrated results are highly useful for determining each adsorbent’s phenol elimination capabilities. The standard stock solution was made in various concentrations, and a spectrophotometer was used to measure the absorbance of each concentration.
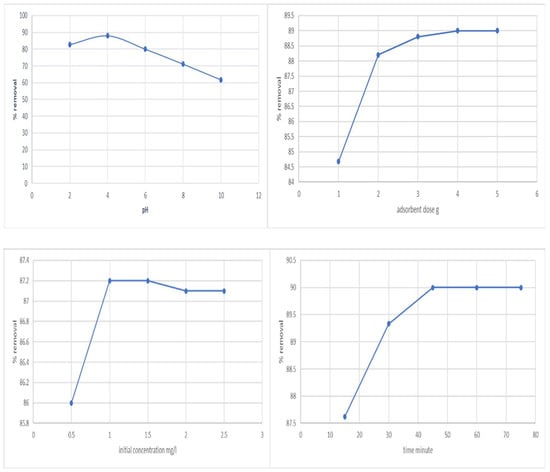
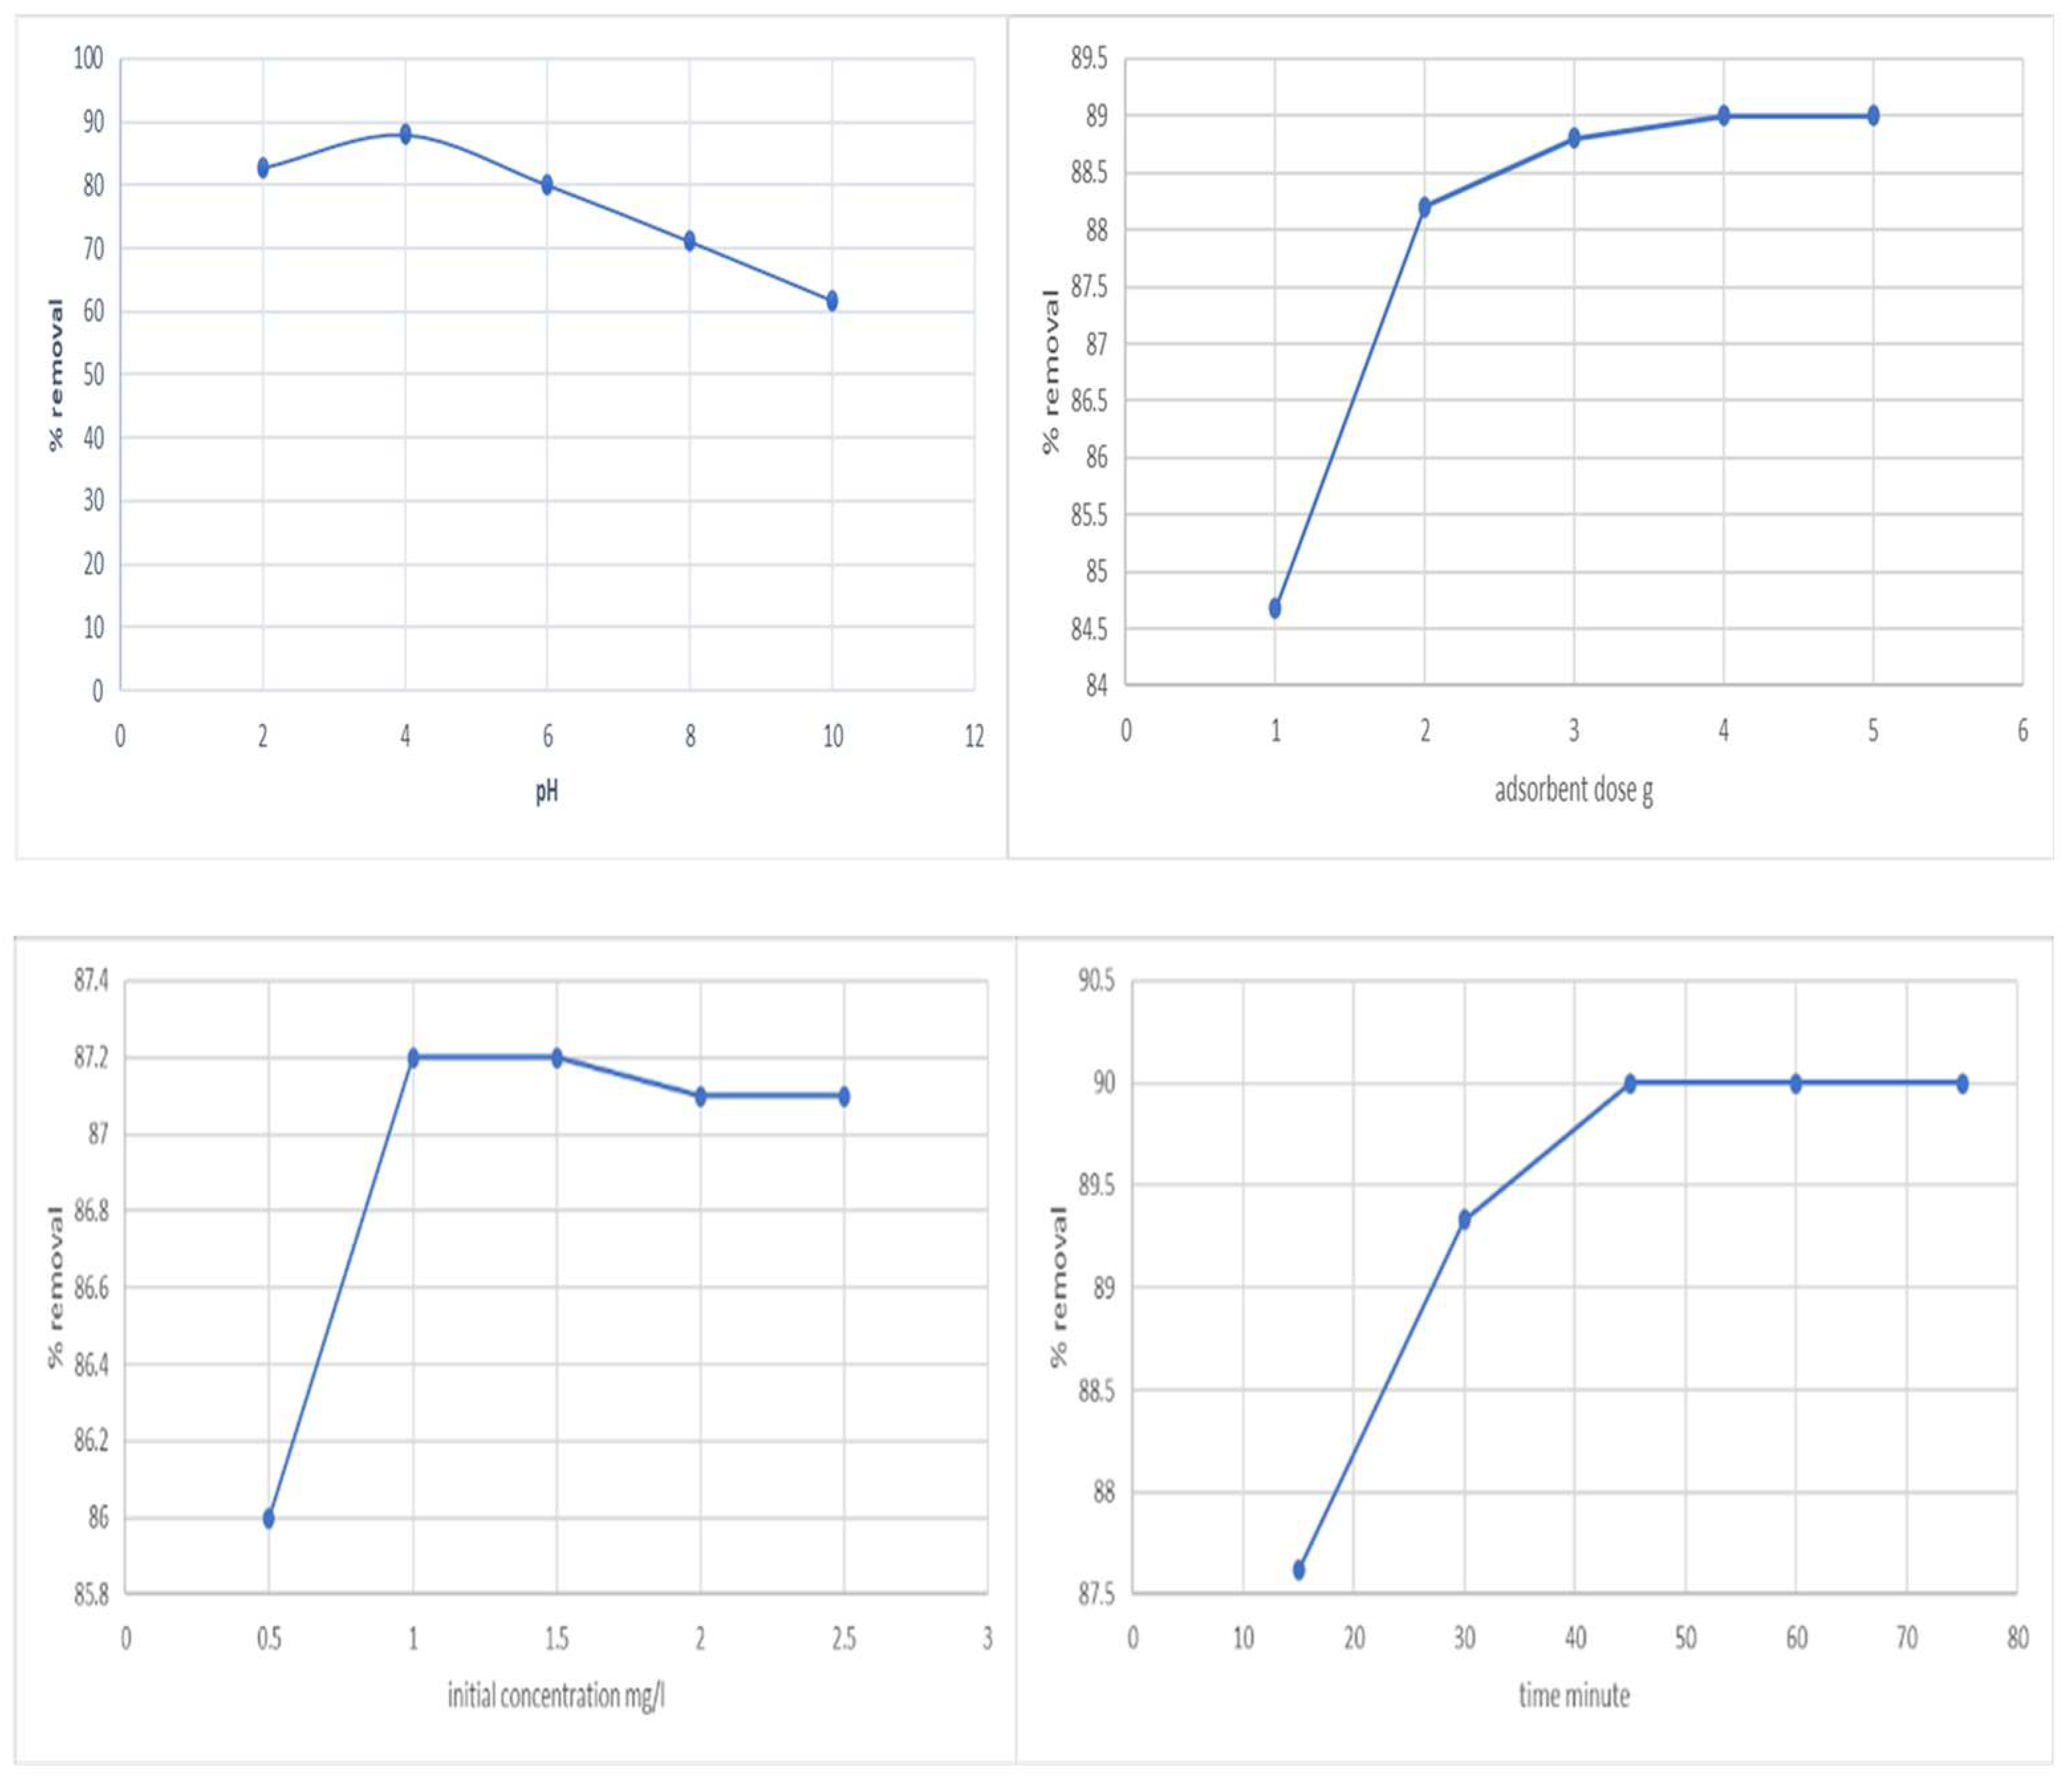
Effect of pH—The degree of ionization of the adsorbate during the reaction is influenced by pH, which also affects the solubility of phenol ions in the solution and replaces some of the positive ions present at the active sites. Within a pH range of 2 to 10, pH’s initial impact on phenol’s adsorption was determined (Figure 1). At pH 4, the maximum adsorption was found to be 88.07%. The difference in the concentrations of H+ and OH- in the solutions may be the cause of this.
Figure 1.
Effect of pH, adsorbent dose, initial concentration, and time vs. removal of phenol.
Effect of adsorbent dosage—The dosage of the adsorbent is a crucial parameter since it controls the system’s sorbent–sorbate equilibrium as well as the adsorbent’s capacity for a particular phenol concentration. Within the adsorbent dosage range of 1–5 g/L, the adsorbent dose’s impact on phenol’s adsorption was evaluated (Figure 1). Adsorption effectiveness was shown to rise with increasing adsorbent dosage; however, adsorption volume was found to decrease. The adsorption efficiency did not considerably increase after a particular dosage. Therefore, 2 g/L was chosen as the ideal concentration for the subsequent adsorption trials.
Effect of initial concentration—The initial concentration acts as a crucial driving factor to go around all of phenol’s mass transfer resistance between the aqueous and solid phases. The initial phenol concentration is controlled between 0.5 and 2.5 mg/L (Figure 1). The starting phenol content was increased up to 1 mg/L, and this modestly improved the equilibrium adsorption efficiency of the activated carbon.
Effect of time—The properties of activated carbon and the number of sorption sites it offered influenced how long it took to reach equilibrium. Time was restricted to 15 to 75 min for this experiment (Figure 1). In the first 30 min, significant amounts of phenol were eliminated, and equilibrium was established in 45 min.
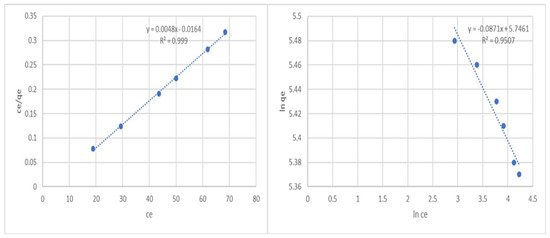
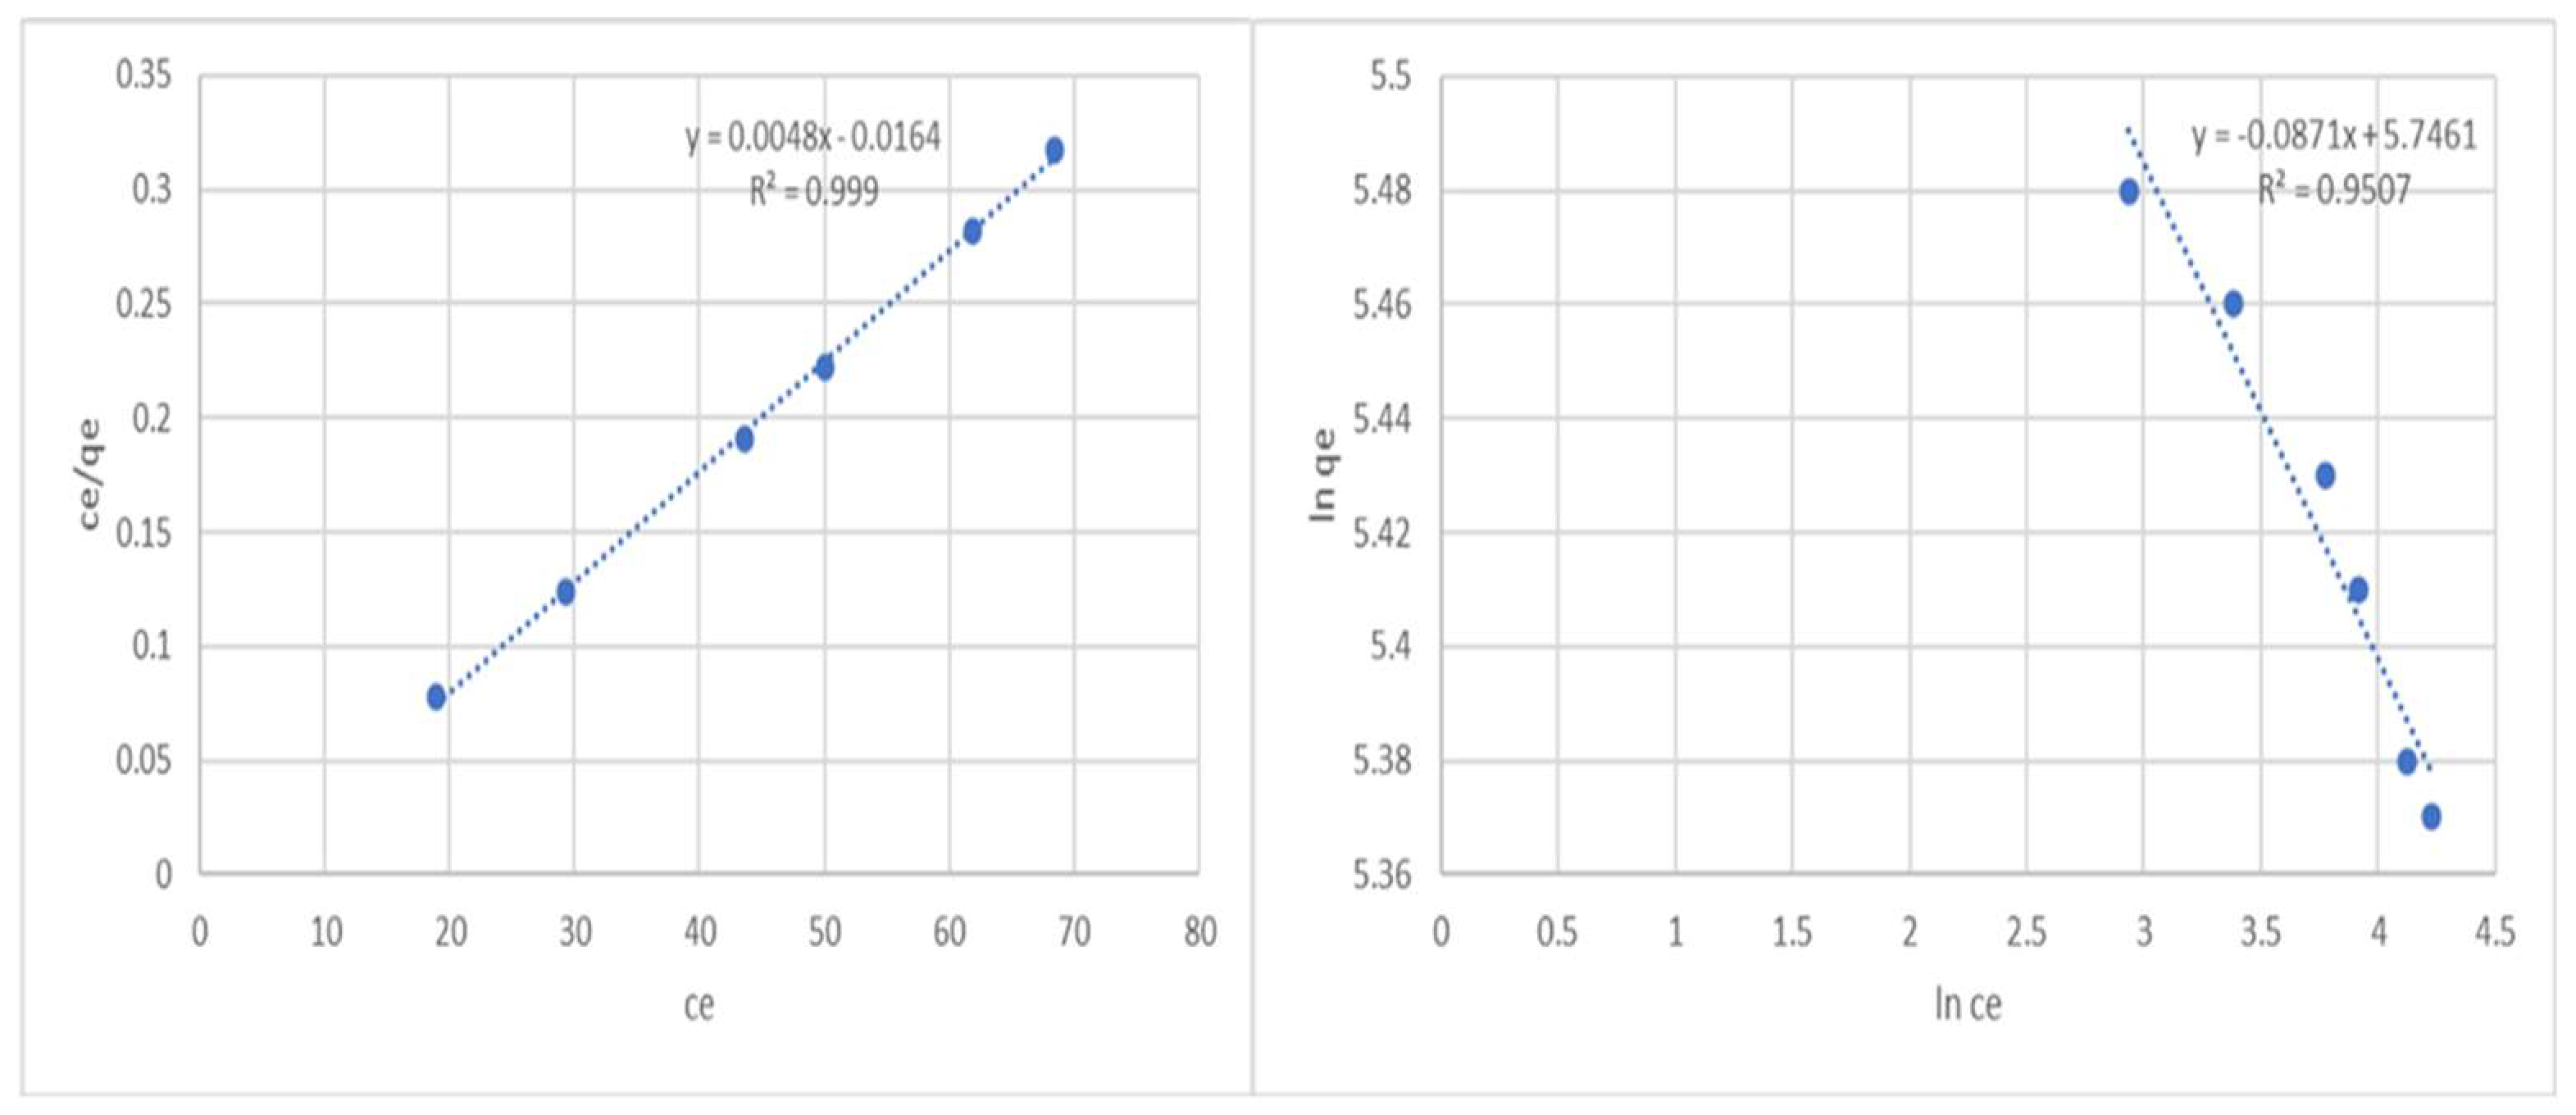
Isotherm—To best utilize adsorbents, it is essential to understand how solutes interact with them by using the term “adsorption isotherm.” The link between the volume of phenol adsorbed and its equilibrium concentration in solutions was modeled by the Langmuir and Freundlich isotherms. The Langmuir isotherm is given by the following equation:
where Ce (mg/L) denotes the equilibrium concentration of the adsorbate, qe (mg/g) is the quantity of adsorbate adsorbed per unit mass of adsorbent, qo denotes the Langmuir constants linked to adsorption capacity, and kL denotes the constant relating to the free energy of adsorption. The following equation can be used to express the Langmuir isotherm in its linearized version:
To determine the Langmuir constants, a graph between Ce/qe and Ce is drawn (Figure 2). The dimensionless separation factor (RL) can be used to express the key features of the Langmuir isotherm. RL is represented in the following equation:
where the concentration of phenol is highest in Co. The value of RL indicates whether the isotherm is unfavorable (RL > 1), irreversible (RL = 0), linear (RL = 1), or favorable (0 < RL < 1). The graph illustrates a linear relationship between Ce/qe and Ce based on experimental data, demonstrating the Langmuir model’s applicability (R2 = 0.999). The Langmuir isotherm is favorable for the adsorption of phenol onto the activated carbon, as demonstrated by the value of RL, which was discovered to be 0.00678.
Figure 2.
Langmuir and Freundlich adsorption isotherms of phenol onto an adsorbent.
The Freundlich isotherm is given by the following equation:
where (1/n) is a measure of the adsorption intensity, and Kf generally represents the adsorption capacity. The Freundlich isotherm model’s linearized form is as follows:
A straight line with a slope of 1/n and an intercept of lnKf is produced by plotting lnqe versus lnCe (Figure 2). The size of the exponent n determines how favorable adsorption is. According to conventional wisdom, n numbers between 2 and 10 indicate favorable adsorption quality, 1–2 indicate highly challenging adsorption quality, and n numbers less than 1 indicate undesirable adsorption quality. Our n value of 11.48 indicates good adsorption properties. The R2 value, 0.9507, is lower than the Langmuir isotherm model’s value. Therefore, the Freundlich isotherm is not the ideal isotherm model to describe the phenol adsorption mechanism.
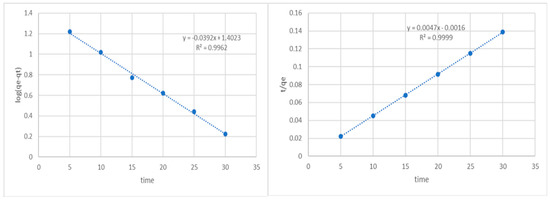
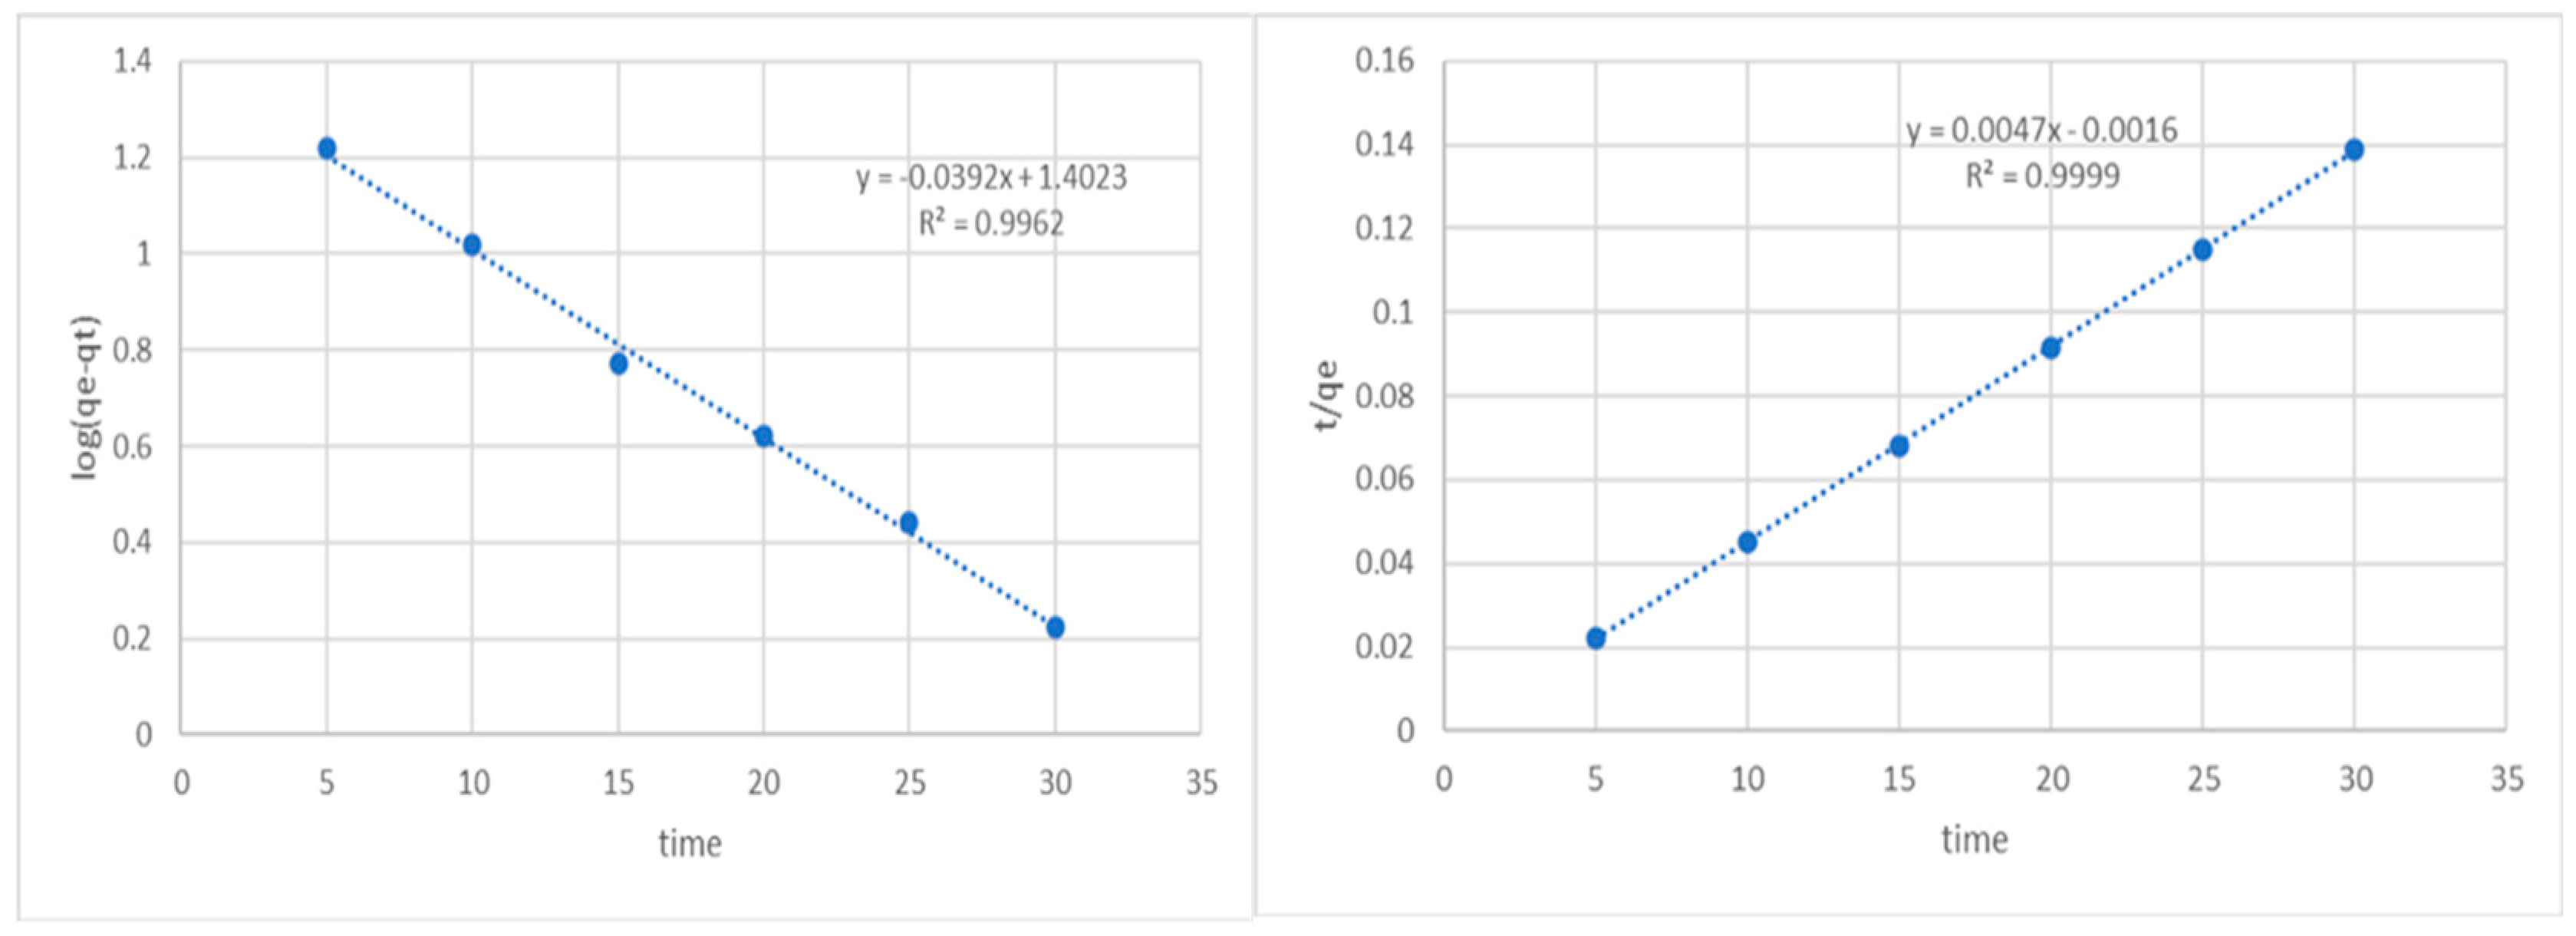
Kinetics studies—The rate of the adsorption process and potential rate-controlling phase were examined using kinetics models. These investigations provided information on the rate of change in the reaction. Pseudo-first-order and pseudo-second-order models were used to analyze the kinetic data gathered from studies. The conformance between the kinetic models and the experimental data was expressed using the correlation coefficient (R2).
The Lagergren pseudo-first-order model has been widely used to predict the phenol kinetics, and its formula is given as follows:
where K1 is the equilibrium rate constant of pseudo first order adsorption (1/h), qe denotes the quantity of phenol adsorbed (mg/g) at equilibrium, and qt is the amount of phenol adsorbed (mg/g) at any time. The linearized form of the equation is given as follows:
The slope and intercept can be calculated from the plot of log (qe − qt) over time, which is typically used to calculate the equilibrium adsorption density qe and first-order rate constants K1 and R2 (Figure 3). We discovered that there was a significant disparity between the calculated (qe, cal) and experimental (qe, exp) adsorption capacity values and that the R2 value derived for the pseudo-first-order kinetic model exhibits a consistent trend. The computed qe is substantially lower than the experimental qe (225 mg/g) at 25.45 mg/g.
Figure 3.
Pseudo first-order and second-order kinetics of phenol on potato peel adsorbent.
The behavior is predicted by the pseudo-second-order model for the whole adsorption range. It is consistent with the rate-controlling step being an adsorption mechanism.
The equation is as follows:
K2 is the equilibrium rate constant of pseudo-second-order adsorption. The linearized form of the equation is given as follows:
The values of qe and the second-order rate constant K2 were determined using the slope and intercept of the plot of t/qt vs. t, respectively (Figure 3). The linear relationship between the plot of t/qt versus t indicates that second-order kinetics is appropriate in this situation. As the initial phenol concentration rose, the rate constant generally dropped. The second-order kinetic model’s correlation coefficient was higher than 0.99. The experimental findings (225 mg/g) and the value computed by the qe (212.76 mg/g) correspond extremely well.
4. Conclusions
The elimination of phenol from biomedical waste using potato peels has been proven to be effective (removal efficiency of 97%). The phenol-activated carbon system performed best when the time (t = 45 min, pH = 4), starting concentration (Co = 1 mg/L), and adsorbent dose (m = 2 g/L) were met. The adsorption capacity of activated carbon significantly increased as the pH of the solution decreased. The results obtained demonstrate that activated carbon has a high capacity for phenol adsorption from biomedical waste. Activated carbon has a maximum adsorption capacity of 225 mg/g. The findings from our kinetics study show that pseudo-second-order kinetics may accurately model the adsorption of phenol on a solution of biomedical waste. Because it demonstrates linear regression of the experimental data and suggests the monolayer adsorption of phenol on the surface of activated carbon, over-equilibrium model analysis shows the suitability of the Langmuir isotherm model to the phenol-activated carbon adsorption system. Because of its accessibility, affordability, high surface area, and adsorption capacity, the activated carbon generated from the chemical activation of potato peels appears to be an efficient adsorbent for the removal of phenol from biomedical waste.
Author Contributions
Conceptualization, methodology, experiments, writing—original draft preparation, review and editing was all carried out by A.P., A.K., A.A., A.S. and P.A.K. All authors have read and agreed to the published version of the manuscript.
Funding
This research received no external funding.
Institutional Review Board Statement
Not applicable.
Informed Consent Statement
Not applicable.
Data Availability Statement
Not applicable.
Conflicts of Interest
The authors declare no conflict of interest.
References
- Alam, A.; Singh, A. Groundwater quality evaluation using statistical approach and water quality index in Aurangabad. Rasayan J. Chem. 2022, 188, 180–188. [Google Scholar] [CrossRef]
- Alam, A.; Kumar, S. Groundwater Quality Assessment and Evaluation of Scaling and Corrosiveness Potential of Drinking Water Samples †. Environ. Sci. Proc. 2023, 25, 64–70. [Google Scholar]
- Kilic, M.; Apaydin-Varol, E.; Putun, A.E. Adsorptive removal of phenol from aqueous solutions on activated carbon prepared from tobacco residues: Equilibrium, kinetics, and thermodynamics. J. Hazard. Mater. 2011, 189, 397–403. [Google Scholar] [CrossRef] [PubMed]
- Khalid, M.; Joly, G.; Renaud, A.; Magnoux, P. Removal of Phenol from Water by Adsorption Using Zeolites. J. Ind. Eng. Chem. Res. 2004, 43, 5275–5280. [Google Scholar] [CrossRef]
- Kamble, S.P.; Mangrulkar, P.A.; Bansiwal, A.K.; Rayalu, S.S. Adsorption of phenol and o-chlorophenol on surface altered fly ash based molecular sieves. Chem. Eng. J. 2008, 138, 73–83. [Google Scholar] [CrossRef]
- Kennedy, L.J.; Vijaya, J.J.; Kayalvizhi, K.; Sekaran, G. Adsorption of phenol from aqueous solutions using mesoporous carbon prepared by a two-stage process. Chem. Eng. J. 2007, 132, 279–287. [Google Scholar] [CrossRef]
- Dash, S.N.; Murthy, V.R.C. Preparation of Carbonaceous Heavy Metal Adsorbent from Shorea Robusta Leaf Litter Using Phosphoric Acid Impregnation. Int. J. Environ. Sci. 2010, 3, 296–313. [Google Scholar]
- Kumar, S.; Zafar, M.; Prajapati, J.K.; Kumar, S.; Kannepalli, S. Modelling studies on simultaneous adsorption of phenol and resorcinol onto granular activated carbon from simulated aqueous solution. J. Hazard. Matter 2011, 185, 287–294. [Google Scholar] [CrossRef] [PubMed]
- Langmuir, I. The adsorption of gases on plane surfaces of glass, mica and platinum. J. Am. Chem. Soc. 1918, 40, 1361–1403. [Google Scholar] [CrossRef]
- Kumar, A.; Kumar, S.; Kumar, S.; Gupta, D.V. Adsorption of phenol and 4- nitrophenol on granular activated carbon in basal salt medium: Equilibrium and kinetics. J. Hazard. Mater. 2007, 147, 155–166. [Google Scholar] [CrossRef] [PubMed]
- Bansal, R.C.; Goyal, M. Activated Carbon Adsorption; Taylor & Francis Group, LLC: London, UK, 2005. [Google Scholar]
Disclaimer/Publisher’s Note: The statements, opinions and data contained in all publications are solely those of the individual author(s) and contributor(s) and not of MDPI and/or the editor(s). MDPI and/or the editor(s) disclaim responsibility for any injury to people or property resulting from any ideas, methods, instructions or products referred to in the content. |
© 2023 by the authors. Licensee MDPI, Basel, Switzerland. This article is an open access article distributed under the terms and conditions of the Creative Commons Attribution (CC BY) license (https://creativecommons.org/licenses/by/4.0/).