Abstract
Groundwater contamination is a rising issue worldwide, and it must be treated well as most of the world relies on it. Groundwater pollution occurs when undesirable substances in groundwater rise. Understanding, simulating, and predicting solute mobility in groundwater helps to treat polluted groundwater. MT3DMS has been used to model contaminant movement with a non-linear Freundlich sorption isotherm. MT3DMS stands for “Modular three-dimensional multispecies transport model”. MT3DMS software has several categories of solute transport solution techniques, like FDM and the higher-order finite-volume TVD method, in a unique single code. Applying the combination of these solution techniques is believed to give the best possible solution with greater precision and accuracy. In the current work, the benchmark problem (P2) of the MT3DMS package was taken, and the chemical reaction package was modified according to our problem. Multiple simulations were run with different adsorption capacities and intensities, incorporating the nonlinear Freundlich sorption isotherm. After that analysis of BTC trends, at a position 8 cm from the source, the pulse input of contamination was discharged for 160 s. The simulation lasted 1500 s. The observation output files were imported to plot BTCs for trend analysis and visualize simulation results. After comparing the various BTCs, it was found that the adsorption capability of porous medium enhances retention capacity so contaminants are sorbed and retarded by the solid phase more, slowing the contaminant movement and delaying the BTC peak. For similar adsorption capacity at a lower adsorption intensity, the solid retains more contaminant and the peak is attenuated as well as delayed; but, as the adsorption intensity increases, the relative concentration in the aqueous phase increases, and the peak is enhanced early as the solid retains less contaminant.
1. Introduction
Groundwater pollution is one of the major emerging challenges globally [1]. Since groundwater is a potential source of water for use in daily life and for basic usages like drinking, it should be strongly considered for assessment and remedial techniques for its pollution should be designed [2]. Generally, it is assumed that the migration of a reactive solute in any porous media with groundwater is driven by a linear sorption isotherm [3]. Though research efforts are focused on determining the non-linear isotherms’ functional structure, principles, and features, hydrologists and environmental engineers are often also engrossed in predicting the plume propagation and breakthrough curves for multiple, or a single set of, contamination schemes and scenarios. For the present study, we will take the pulse concentration source with a single contaminant for a better understanding of its fate and transport with nonlinear sorption. The processes responsible for the transport of solutes in groundwater as per [4] are advection, mechanical dispersion, molecular diffusion, sorption, and colloid transport [5]. Their study used HYDRUS 1D/2D software for the simulation of solute transport, making variations to the critical parameters of flow and transport for various soil conditions [6]. The study was conducted for the remediation of metal contaminants in groundwater and greywater. Heavy metals were extracted efficiently from test samples using the adsorption process.
2. Methodology
2.1. MT3DMS
For this study, the simulation was performed with the help of MT3DMS software downloaded from the website of the U.S. Geological Survey Department (https://www.usgs.gov (accessed on 1 February 2023). MT3DMS can be used to simulate various physical and chemical changes occurring in solute transport processes. Also, there is independence in the selection of different boundary conditions. A basic chemical reaction package named RCT can solve single species with conditions like equilibrium-controlled or non-linear sorption and 1st order kinetic reactions.
The governing equation of the solute transport model in MT3DMS is
( = Porosity of media, dimensionless; C = dissolved concentration in aqueous phase, ML−3; t = time, seconds; Vi = seepage velocity, LT−1; qs = discharge per unit volume of medium, T−1; q′s = rate of change in GW storage, T−1; b = bulk density medium, ML−1; = sorbed contaminant concentration on the medium, MM−1; = first order reaction rate for dissolved phase, T−1; 2 = first order reaction rate for the sorbed phase, T−1; R = retardation factor).
2.2. Chemical Reaction Package
For the simulation in MT3DMS, the assumption of the equilibrium condition is made generally, i.e., that sorption is instantaneous and the sorption reaction is faster as compared to seepage velocity.
As we know, at constant temperature, the sorption process is explained by the functional relationship between sorbed and dissolved concentrations. It is termed the sorption isotherm. The retardation factor (R), described in governing Equation (1), is commonly used to integrate equilibrium-controlled sorption isotherms into the transport model. Since, this study incorporates the non-linear Freundlich sorption isotherm, the empirical equation for this is
(Kf = Freundlich constant (adsorption capacity/partition factor), (L3M−1); a = Freundlich exponent (adsorption intensity) dimensionless).
The retardation factor can be defined as
2.3. Transport Model Formation and Validation
For this study, the same problem is opted for as demonstrated in [7], considering Freundlich isotherms, and the input files for the same problem are given in benchmark problem P2 of the MT3DMS software. For the creation of input files, according to our study, desired changes in the existing input files of the chemical reaction package of MT3DMS input files (RCT package) were made, and modifications were made as per directions suggested in the MT3DMS user manual [8] for the creation of the desired input files.
The model parameters were taken as follows: grid-space (∆X) = 0.160 cm, dispersivity (αL) = 1.0 cm, GW-seepage velocity (v) = 0.1 cm/s, porosity (θ) = 0.37, bulk density (ρb) = 1.587 g/cm3, source concentration (Co) = 0.05 mg/L, pulse input time (to) = 160 s.
Here, due to the low Peclet number (0.16), the transport mechanism will not be advection-dominating and the migration of the solute will be due to sorption.
The initial and boundary conditions for our model are provided as follows:
C (x, 0) = 0
The boundary conditions for the flow model in this study involve setting constant hydraulic head values at both ends of the model domain. This is performed by assigning an arbitrary hydraulic head value to achieve the desired Darcy flux. As the flow field is steady-state, only one stress period is necessary for the flow model. However, the transport model requires two stress periods to account for changes in source concentration.
In the transport model used in this study, the boundary conditions involve a specified total mass flux (third-type) on the left side and zero dispersive mass flux (second-type) on the right side. To approximate the third-type boundary condition, the advective mass flux is specified using the rate of inflow or outflow across the boundary (represented by q). To implement this in the test problem, the concentration of the inflow at the constant-head node on the left is set to 0.05 mg/L for the first and second stress periods, respectively. The second-type boundary condition is addressed by placing it far enough from the source to prevent the plume from reaching it within the given simulation time.
The validation of the model was carried out with the benchmark problem, and the results obtained from the analytical method were similar to the numerical simulation.
2.4. Input Files, Data, and Simulation
Multiple simulations were run for this problem by altering the values within the range discussed below, and the output of each simulation was saved individually to avoid any possible error. The chemical reaction input files package (RCT package), incorporating the nonlinear Freundlich sorption isotherm, has two sorption parameters, SP1 = Kf and SP2 = a, and the input data variation was made with different sets of these two parameters as follows:
- Set number-1 Kf = 0.20 to 1.40 & a = 0.70,
- Set number-2 Kf = 0.20 to 1.40 & a = 0.60,
- Set number-3 Kf = 0.20 to 1.40 & a = 0.80.
For the variation in ‘Kf’ (SP1) and ‘a’ (SP2) for the above sets, the range for variation was taken from [9,10,11,12]. All other input parameters and boundary conditions of the model remained unchanged and were applied as per the standard benchmark problem.
3. Result and Discussion
All the outputs were obtained using a concentration pulse input for 160 s with an initial concentration (Co) of 0.05 mg/L and a total simulation length of 1500 s. The BTCs were displayed at a location 8 cm from the initial source point of the pulse input. By changing the values of the parameters (Kf and a), a trend analysis for the BTCs (C/Co vs. simulation time) for three alternative sets of parameters was generated with the help of MS Excel. Here, C/Co = aqueous phase relative concentration.
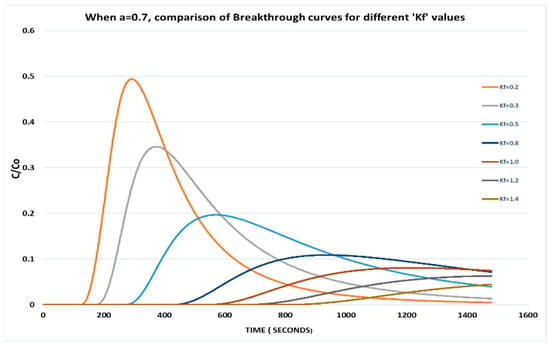
It is observed that with the same adsorption intensity (a), as the value of adsorption capacity increases, there is an attenuation in the peak of relative phase aqueous concentration since retardation to contaminants is offered by the solid phase (Figure 1).

Figure 1.
When a = 0.7, comparison of breakthrough curves for different Kf values.
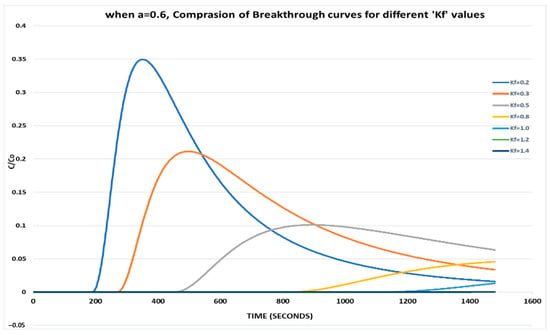
With a lower value of a = 0.6 and varying Kf, it is observed that the relative phase aqueous concentration is drastically reduced, and the peak is also delayed for each set since more resistance is offered to the contaminant (Figure 2).

Figure 2.
When a = 0.6, comparison of breakthrough curves for different Kf values.
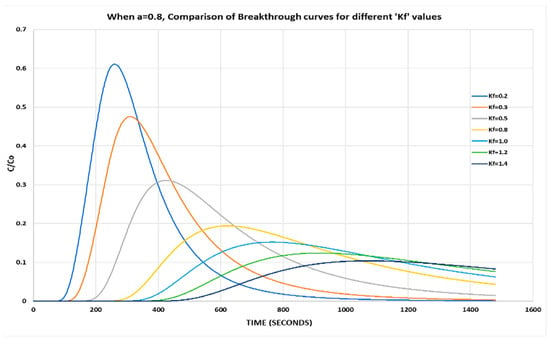
With a higher value of a = 0.8 and by varying Kf, it is observed that the relative phase aqueous concentration is increased and the peak occurs earlier as compared to previous results (Figure 3).

Figure 3.
When a = 0.8, comparison of breakthrough curves for different Kf values.
Also, it has been observed that at the same ‘a’ value and with an increase in Kf, the peak is delayed and attenuated (aqueous phase relative concentration decreases with an increase in Kf).
4. Conclusions
A porous medium’s ability to adsorb contaminants from an aqueous solution is directly proportional to its adsorption capacity. As a result, the concentration of contaminants in the aqueous phase decreases when the adsorption capacity of the porous medium is higher, since more of the contaminant is adsorbed onto the solid phase. This leads to a reduction in the peak relative aqueous phase concentration and a slower rate of pollutant migration. However, a higher adsorption intensity can have an adverse effect on pollution migration. When the adsorption intensity is high, the concentration of contaminants in the aqueous phase increases compared to the concentration at a lower adsorption intensity, even when the adsorption capacity is the same. These critical parameters can be used to design customized media with a suitable pollution removal process to treat targeted pollution.
Supplementary Materials
The presentation materials can be downloaded at: https://www.mdpi.com/article/10.3390/ECP2023-14741/s1.
Author Contributions
Conceptualization, methodology, software, formal analysis, writing—original draft preparation, review and editing was carried out by A.K., A.A. and A.S. All authors have read and agreed to the published version of the manuscript.
Funding
This research received no external funding.
Institutional Review Board Statement
Not applicable.
Informed Consent Statement
Not applicable.
Data Availability Statement
Not applicable.
Conflicts of Interest
The authors declare no conflict of interest.
References
- Alam, A.; Singh, A. Groundwater quality evaluation using statistical approach and water quality index in Aurangabad. Rasayan J. Chem. 2022, 188, 180–188. [Google Scholar] [CrossRef]
- Alam, A.; Kumar, S. Groundwater Quality Assessment and Evaluation of Scaling and Corrosiveness Potential of Drinking Water Samples. Environ. Sci. Process 2023, 25, 64–70. [Google Scholar] [CrossRef]
- Fetter, C. Contaminant Hydrogeology; Macmillan Publishing Company: New York, NY, USA, 1993. [Google Scholar]
- Fitts, C.R. 11-Groundwater Contamination; Fitts, E., 2nd, Ed.; Academic Press: Boston, MA, USA, 2013; pp. 499–585. [Google Scholar]
- Agarwal, P.; Sharma, P.K. Analysis of critical parameters of flow and solute transport in porous media. Water Sci. Technol. Water Supply 2020, 20, 3449–3463. [Google Scholar] [CrossRef]
- Alomar, T.S.; Habila, M.A.; Alothman, Z.A.; Almasoud, N. Evaluation of Groundwater and Grey Water Contamination with Heavy Metals and Their Adsorptive Remediation Using Renewable Carbon from a Mixed-Waste Source. Water 2020, 12, 1802. [Google Scholar] [CrossRef]
- Grove, D.; Stollenwerk, K. Computer Model of One-Dimensional Equilibrium Controlled Sorption Processes; US Geological Survey: Reston VA, USA, 1984. [Google Scholar] [CrossRef]
- Zheng, C.; Hill, M.; Cao, C.G.; Ma, R. MT3DMS: Model use, calibration, and validation. Trans. ASABE 2012, 55, 1549–1559. [Google Scholar] [CrossRef]
- Rahman, M.M.; Liedl, R.; Grathwohl, P. Sorption kinetics during macropore transport of organic contaminants in soils: Laboratory experiments and analytical modeling. Water Resour. Res. 2004, 40, 1–11. [Google Scholar] [CrossRef]
- Ajwa, H.; William, J.N.; Ruijun, Q.; Suduan, G. Properties of soil fumigants and their fate in the environment. In Hayes’ Handbook of Pesticide Toxicology; Academic Press: Cambridge, MA, USA, 2010; pp. 315–330. [Google Scholar]
- Igwe, J.C.; Abia, A.A. Adsorption isotherm studies of Cd (II), Pb (II) and Zn (II) ions bioremediation from aqueous solution using unmodified and EDTA-modified maize cob. Eclética Química 2007, 32, 33–42. [Google Scholar] [CrossRef]
- Chang, C.M.; Wang, M.K.; Chang, T.W.; Lin, C.; Chen, Y.R. Transport modeling of copper and cadmium with linear and nonlinear retardation factors. Chemosphere 2001, 43, 1133–1139. [Google Scholar] [CrossRef]
Disclaimer/Publisher’s Note: The statements, opinions and data contained in all publications are solely those of the individual author(s) and contributor(s) and not of MDPI and/or the editor(s). MDPI and/or the editor(s) disclaim responsibility for any injury to people or property resulting from any ideas, methods, instructions or products referred to in the content. |
© 2023 by the authors. Licensee MDPI, Basel, Switzerland. This article is an open access article distributed under the terms and conditions of the Creative Commons Attribution (CC BY) license (https://creativecommons.org/licenses/by/4.0/).