1. Introduction
Higher laboratory standards demand reduced environmental vibration, which, when transmitted through the laboratory platform, may introduce significant errors, thus hindering proper instrument functionality. Road vehicle-induced vibrations are among the primary factors influencing precision instrument performance.
Scholars worldwide have researched the characteristics of road vibration acceleration caused by vehicle driving, focusing mainly on amplitude and spectrum [
1]. Chen et al. [
2] measured ambient vibration on a soft soil site caused by heavy vehicles and found that the generated vibration exceeded the normal use standard of instruments, with heavy vehicles producing greater vibration than super-compact vehicles. Beben et al. [
3] observed that the distance between buildings and fences played a vital role in reducing traffic vibration on damaged buildings. Cao et al. [
4] identified that multi-peak ground vibration in a short time would impact the normal operation of precision instruments in a vehicle during monitoring of vehicle vibration on a trunk road in Beijing.
This study investigated the micro-dynamic response of a precision instrument vibration isolation platform to road traffic vibration using numerical simulations. Vehicle load parameter analysis was conducted on the platform at the Changping experimental base of the China Metrology Institute to provide a design and route planning reference for precision instrument vibration isolation platforms considering the impact of road traffic.
2. Three-Dimensional Dynamic Analysis Model Establishment
Engineering Background
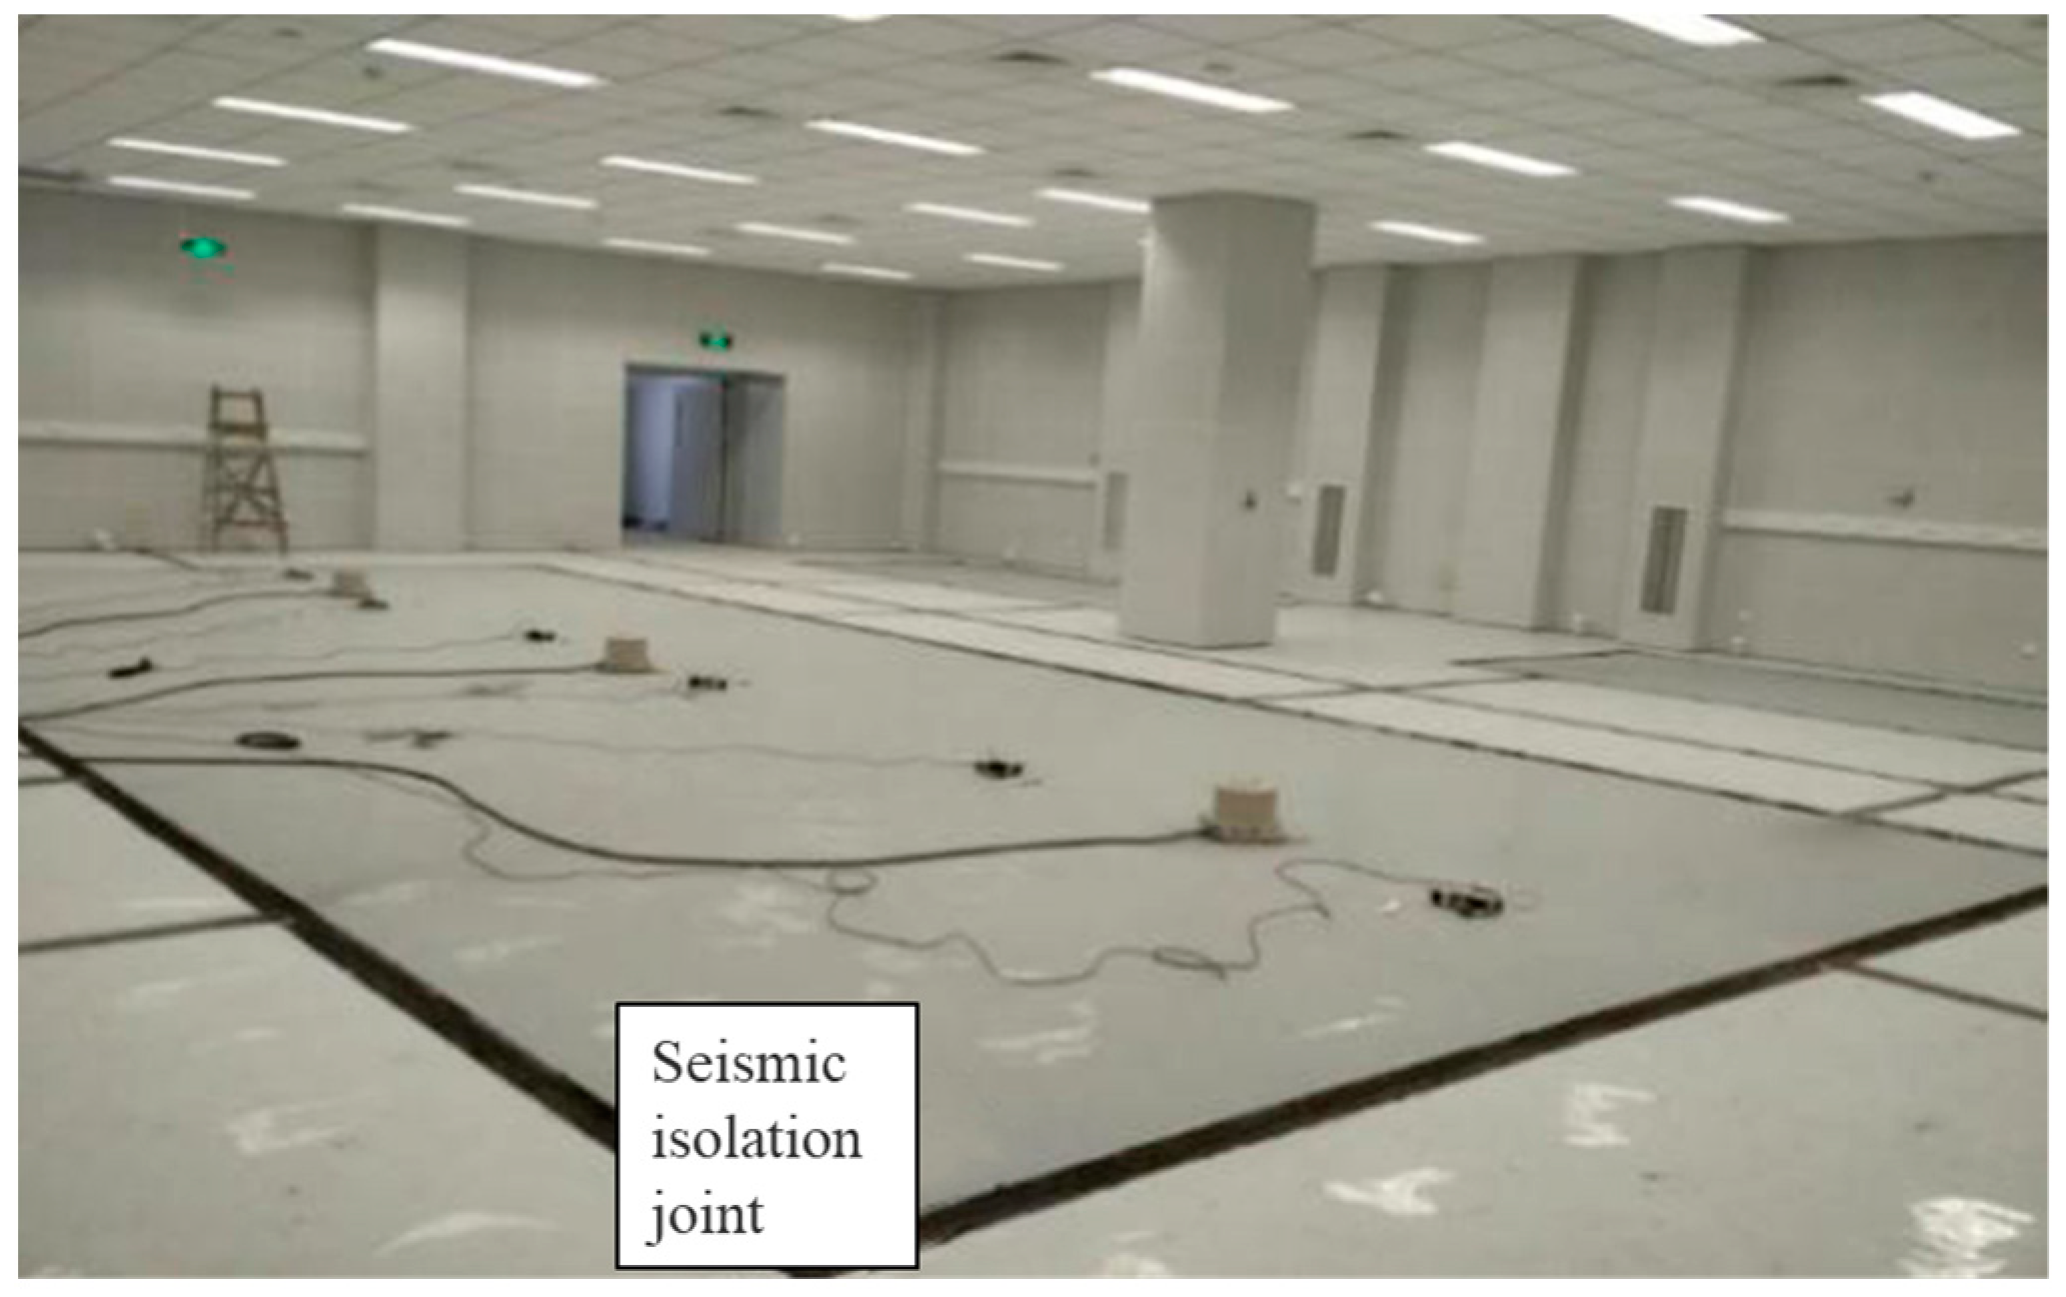
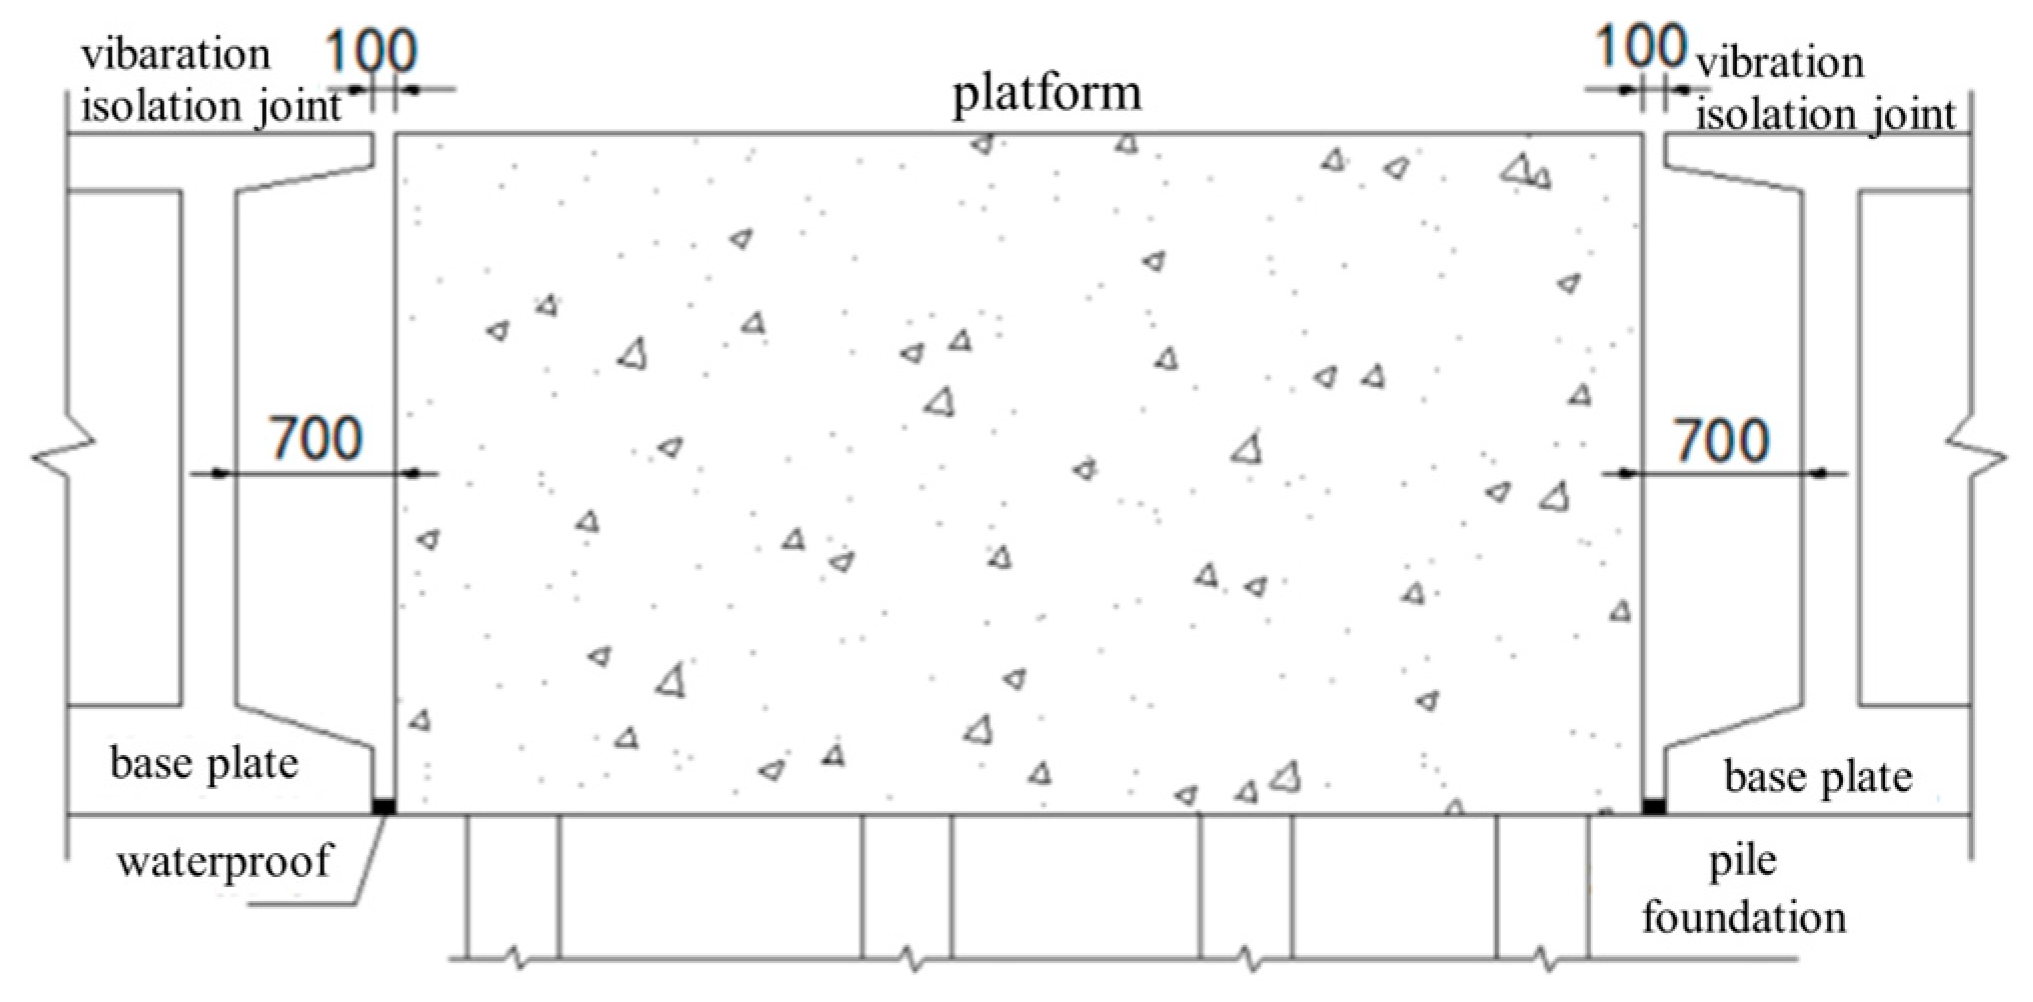
The indoor vibration isolation platform level of a mechanical metrology laboratory in Changping Experimental Base is shown in
Figure 1. The vibration isolation platform size was 13 m × 5.5 m × 3 m, with concrete strength class C30, modulus of elasticity
= 30 GPa, Poisson ratio
= 0.2, and density
= 2500 kg/m
3, as shown in
Figure 2.
In order to accurately reflect the vibration response of a vibration isolation platform, a finite element model including the Upper Structure–Vibration Isolation Platform–Soil Layer of the experimental building was established. The overall finite element model that has been established is illustrated in
Figure 3.
3. Micro-Dynamic Response Analysis
3.1. Analysis of Velocity Time-History Results of Vibration Isolation Platform
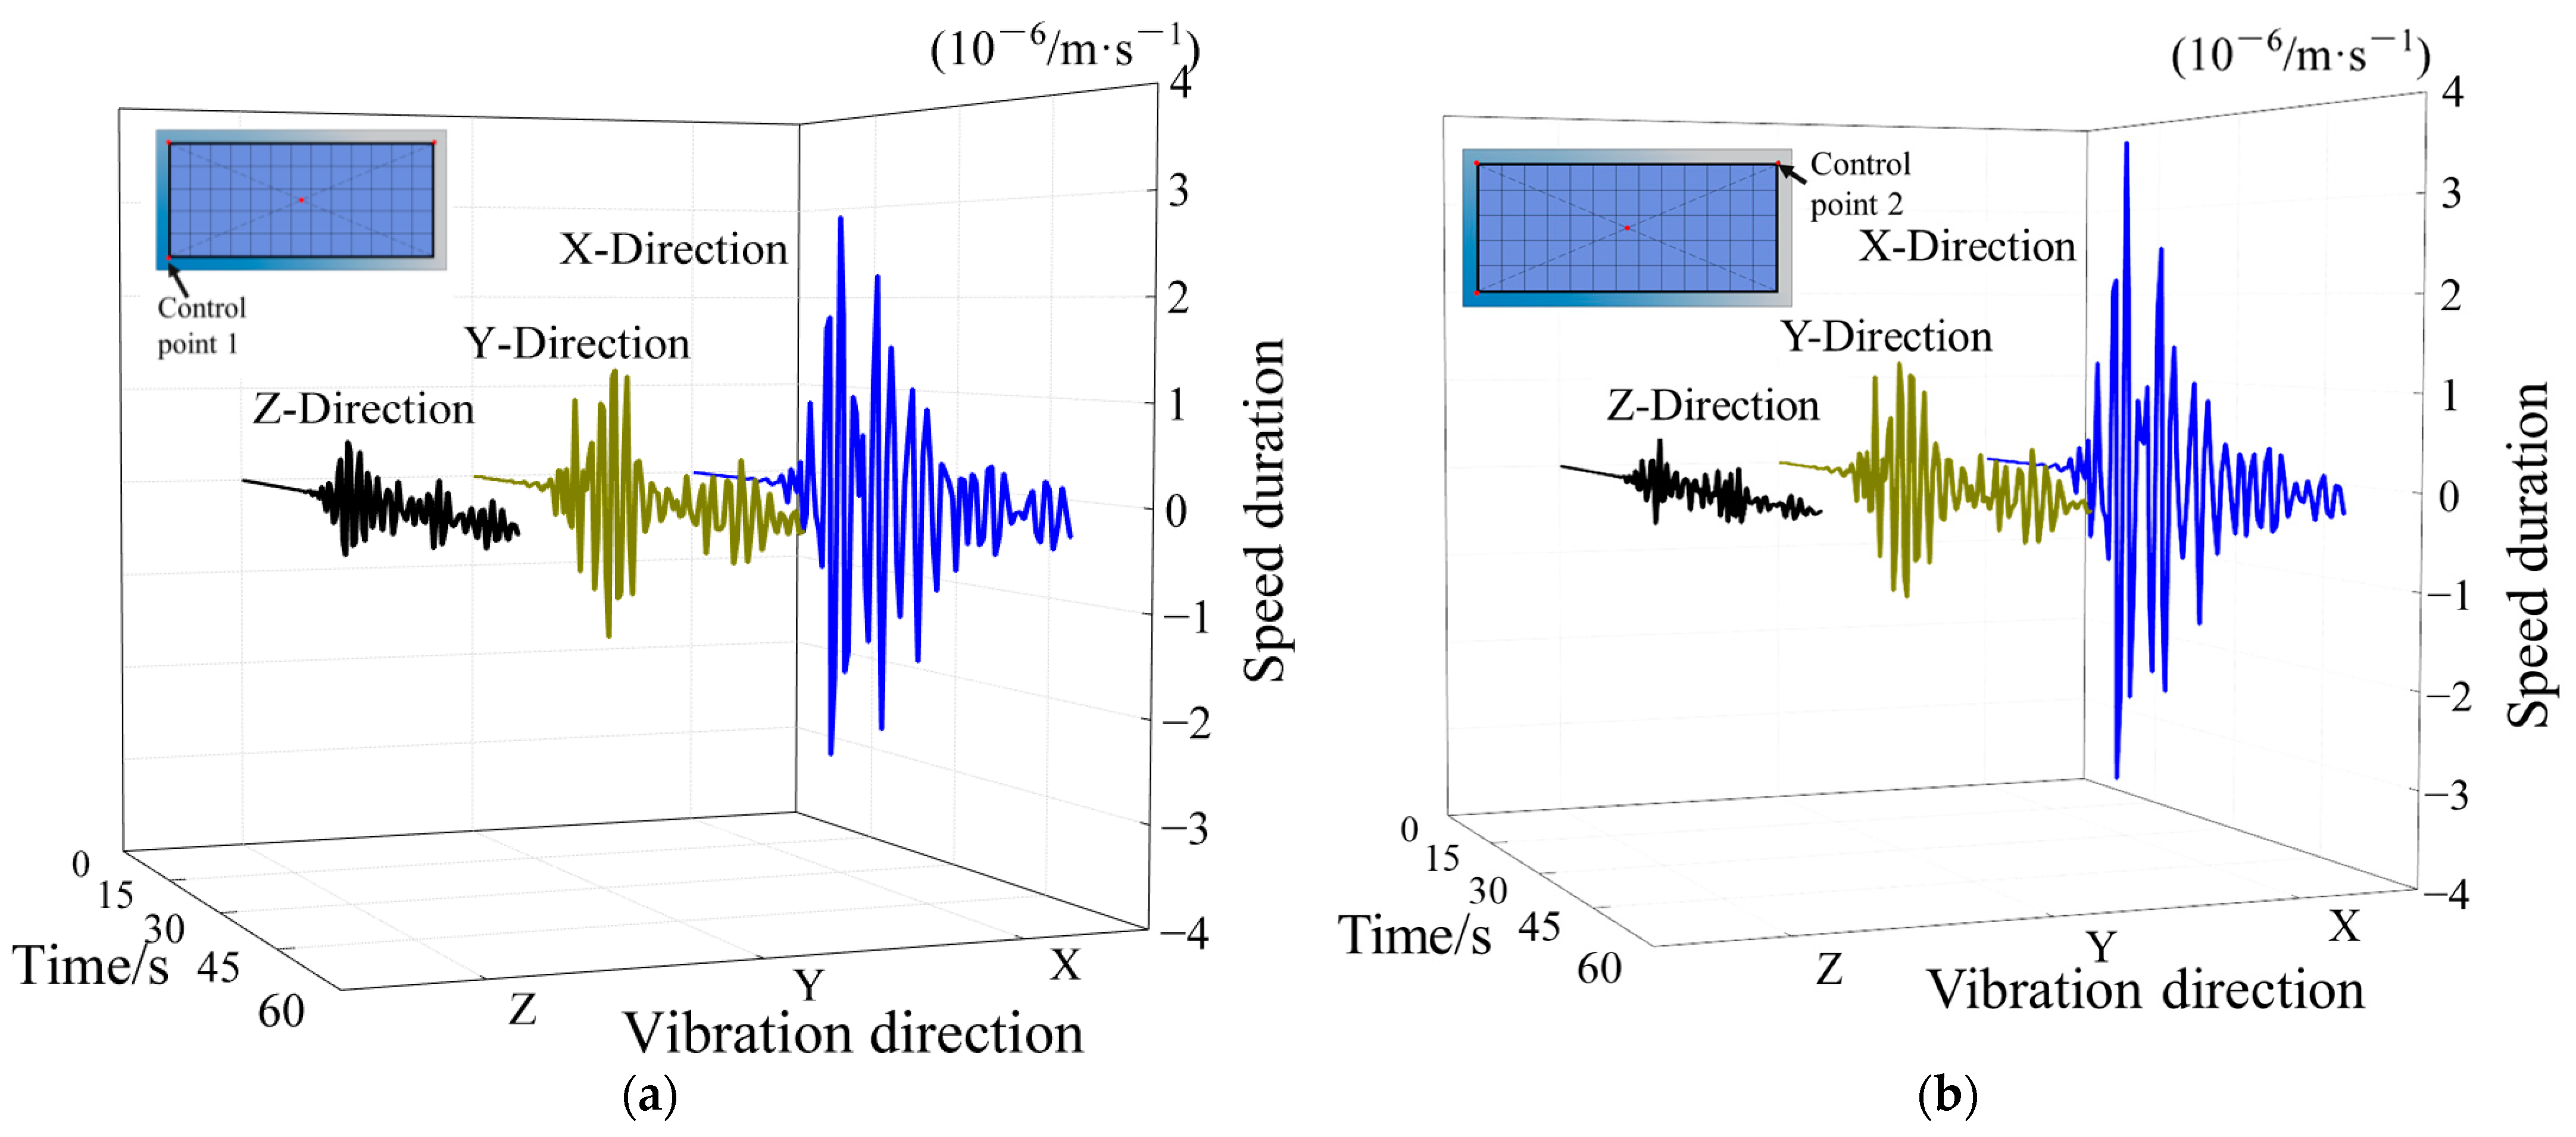
As shown in
Figure 4, diagonal control points 1 and 2 were selected on the vibration isolation platform based on the platform requirements and micro-vibration observations.
Figure 4 shows the velocity response time-history curves in the X, Y, and Z directions for these points. Under the action of a vehicle load on the road surface, the horizontal speed response of the vibration isolation platform perpendicular to the vehicle driving route (X) was the largest, followed by the horizontal response parallel to the driving route (Y) and the vertical speed response (Z) was the smallest. Therefore, precision instruments functioning in the horizontal direction can reduce the impact of traffic vibration by properly designing the platform direction.
3.2. Vehicle Load Parameter Analysis
When the distance between the vibration sources was constant (35 m), the peak vertical vibration speed of the vibration isolation platform was extracted as shown in
Figure 5. As can be seen from
Figure 5, when the vibration source distance was constant and the vehicle speed was 20 m/s, the peak speed increased with the increase in vehicle load.
For a vehicle speed below 20 m/s, when the load exceeded 16 t, the peak curve showed a downward turning point. It can be seen that the vibration isolation platform had the largest dynamic response when the vehicle speed was 12 m/s and the load was 16 t.
When the vehicle load was constant (16 t), the variation of the peak vertical vibration speed of the vibration isolation platform with the source distance were extracted at different vehicle speeds, as shown in
Figure 6. It can be seen from
Figure 6 that when the vehicle load was constant, the peak vibration speed increased as the vibration source distance decreased. At a speed of 12 m/s and a vibration source distance of 35 m, the vibration isolation platform had the largest dynamic response.
In summary, through parameter analysis of three key influencing factors, i.e., vehicle load, horizontal distance of vibration source, and driving speed, it can be concluded that the vibration response of vibration isolation platform is the most violent when driving at a medium speed with a vibration source distance of 35 m, load of 16 t, and speed of 12 m/s, which can be considered as the most unfavorable calculation conditions.
4. Comparison and Analysis of Field Vibration Measurement
High-precision sensors are required for monitoring the dynamic response of structures affected by traffic vibration due to the very small amplitude. Two high-precision sensors, VSE-355G3 from Tokyo and 941B vibration pick-up instrument from China Seismological Bureau, were utilized in the field as illustrated in
Figure 7.
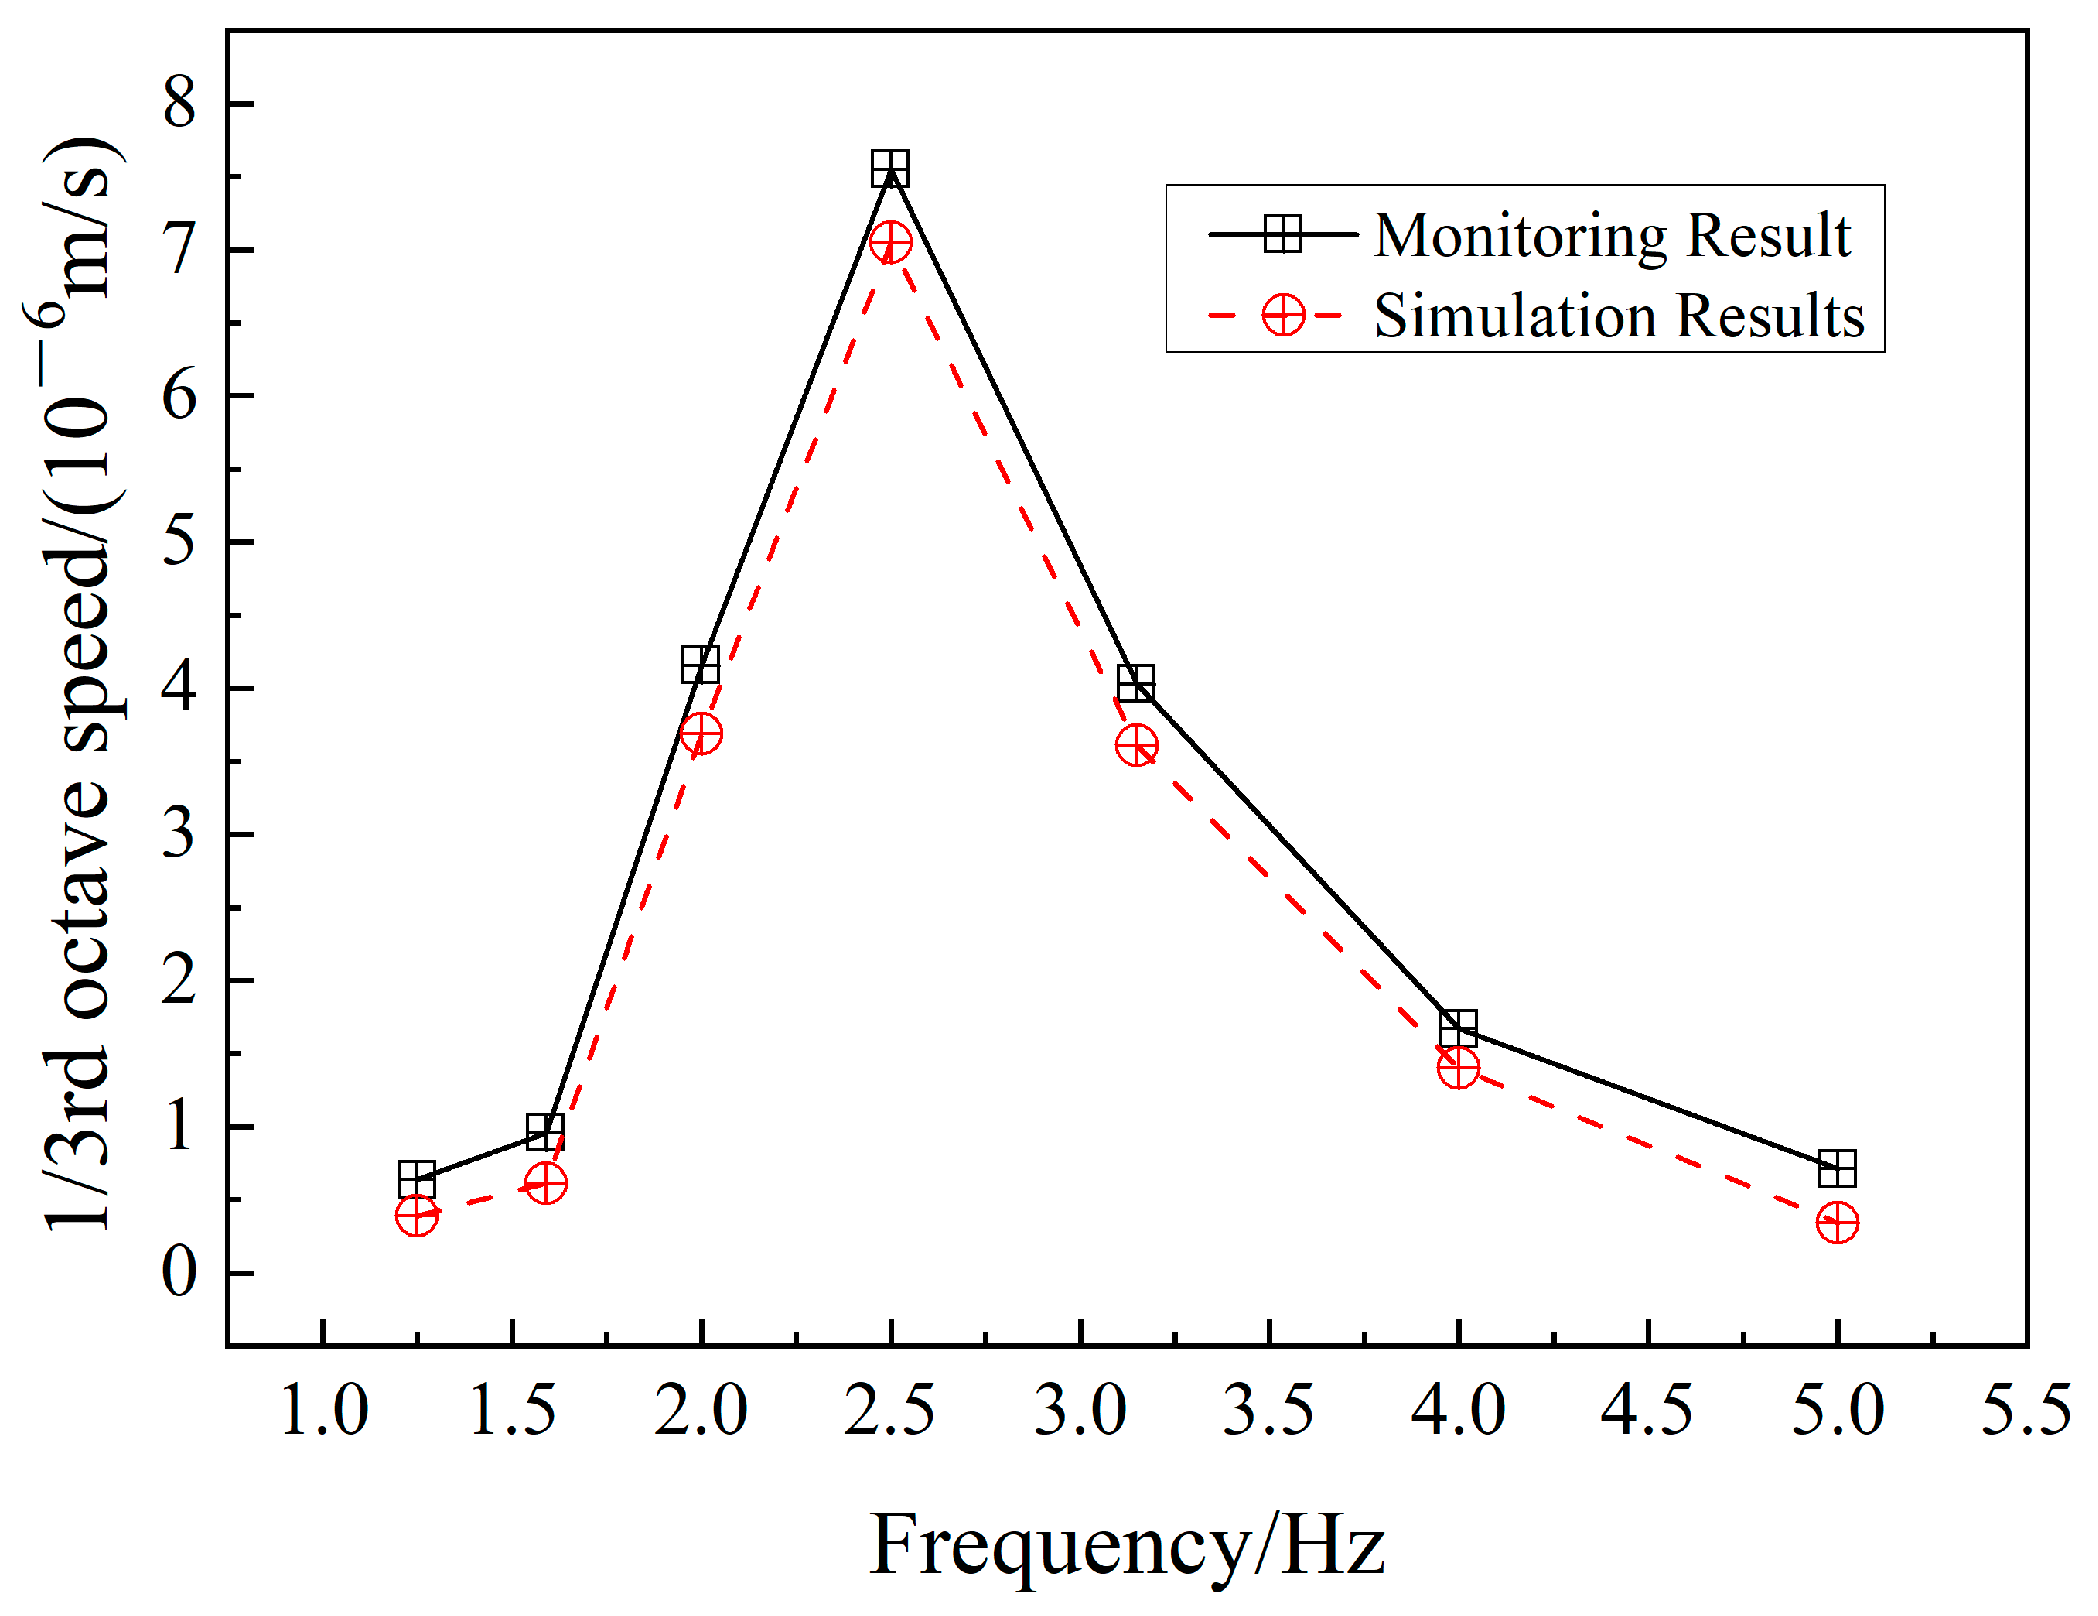
To compare the measured and simulated results, a common mini-bus with a 2-ton weight, driving at 12 m/s and at a horizontal distance of 35 m from the vibration isolation platform was used. The vertical vibration speed time history was extracted and converted to 1/3 times frequency range results, as shown in
Figure 8. The dynamic response dominant frequency of the vibration isolation platform caused by road traffic vibration was mainly concentrated at 2.5 Hz, which is a low frequency. The measured results were generally larger than the numerical simulation results due to the influence of on-site background vibrations. However, the results measured in the field match the numerical simulation results in terms of the change trend, verifying the accuracy of the numerical model.
5. Conclusions
(1) There is a directional difference in the peak velocity response of an isolation platform caused by vehicle load. The horizontal velocity response perpendicular to the vehicle’s driving direction is the largest, followed by the horizontal velocity response parallel to the driving direction, and the vertical velocity response is the smallest. Therefore, the impact of traffic vibration can be reduced by designing the platform direction.
(2) We conducted parameter analysis on three key influencing factors: vehicle load, vibration source horizontal distance, and driving speed. The vibration response of the isolation platform was the most severe when the vibration source distance was 35 m, the load was 16 tons, and the vehicle speed was 12 m/s. This set of parameters can be used as the most unfavorable working conditions for evaluating the micro-dynamic response of precision instruments.
(3) The dominant frequency of the dynamic response of the isolation platform caused by road vehicle loads was concentrated at 2.5 Hz, with low-frequency vibrations being the main factor. Due to the influence of on-site background vibration, the overall monitoring results were greater than the numerical simulation results. The variation trends of the on-site measurement results and numerical calculation results are basically consistent, verifying the correctness of the numerical model. Use of specifications that exceed their limits may affect the normal use of the instrument.
Author Contributions
Methodology, B.S. and X.W.; Software, C.L. and X.W.; Validation, C.L. and Y.Z.; Formal analysis, B.S. and X.W.; Investigation, K.L.; Writing—review and editing, Y.Z. All authors have read and agreed to the published version of the manuscript.
Funding
This research was funded by the National Natural Science Foundation of China, No. 52078038, and the USTB Research Center for International People-to-People Exchange in Science, Technology, and Civilization, No. 2022FKYB012.
Institutional Review Board Statement
Not applicable.
Informed Consent Statement
Not applicable.
Data Availability Statement
The data are not publicly available due to privacy restriction.
Conflicts of Interest
The authors declare no conflict of interest.
References
- Zhang, F.; Feng, D.; Ling, X.; Wang, Z.; Zhu, Z. Vertical dynamical analysis model of heavy vehicle-pavement-subgrade during spring-thawing period. China J. Highw. Transp. 2011, 24, 7–14. [Google Scholar]
- Chen, X.; Jiang, J.; Hu, Y.; Sheng, T.; Tang, K. Experimental Study on The Influence of Precision Instruments Caused by Heavy Vehicles Vibration. J. Phys. Conf. Ser. 2021, 2044, 012113. [Google Scholar] [CrossRef]
- Beben, D.; Maleska, T.; Bobra, P.; Duda, J.; Anigacz, W. Influence of Traffic-Induced Vibrations on Humans and Residential Building—A Case Study. Int. J. Environ. Res. Public Health 2022, 19, 5441. [Google Scholar] [CrossRef] [PubMed]
- Cao, Y.; Li, Z.; Yang, C. On-Site Experiment and Characteristics Analysis of Ground Vibrations Induced by Vehicle Loads Moving on an Urban Trunk Road. Transp. Res. Rec. 2023, 2677, 1500–1519. [Google Scholar] [CrossRef]
| Disclaimer/Publisher’s Note: The statements, opinions and data contained in all publications are solely those of the individual author(s) and contributor(s) and not of MDPI and/or the editor(s). MDPI and/or the editor(s) disclaim responsibility for any injury to people or property resulting from any ideas, methods, instructions or products referred to in the content. |
© 2023 by the authors. Licensee MDPI, Basel, Switzerland. This article is an open access article distributed under the terms and conditions of the Creative Commons Attribution (CC BY) license (https://creativecommons.org/licenses/by/4.0/).


