1. Introduction
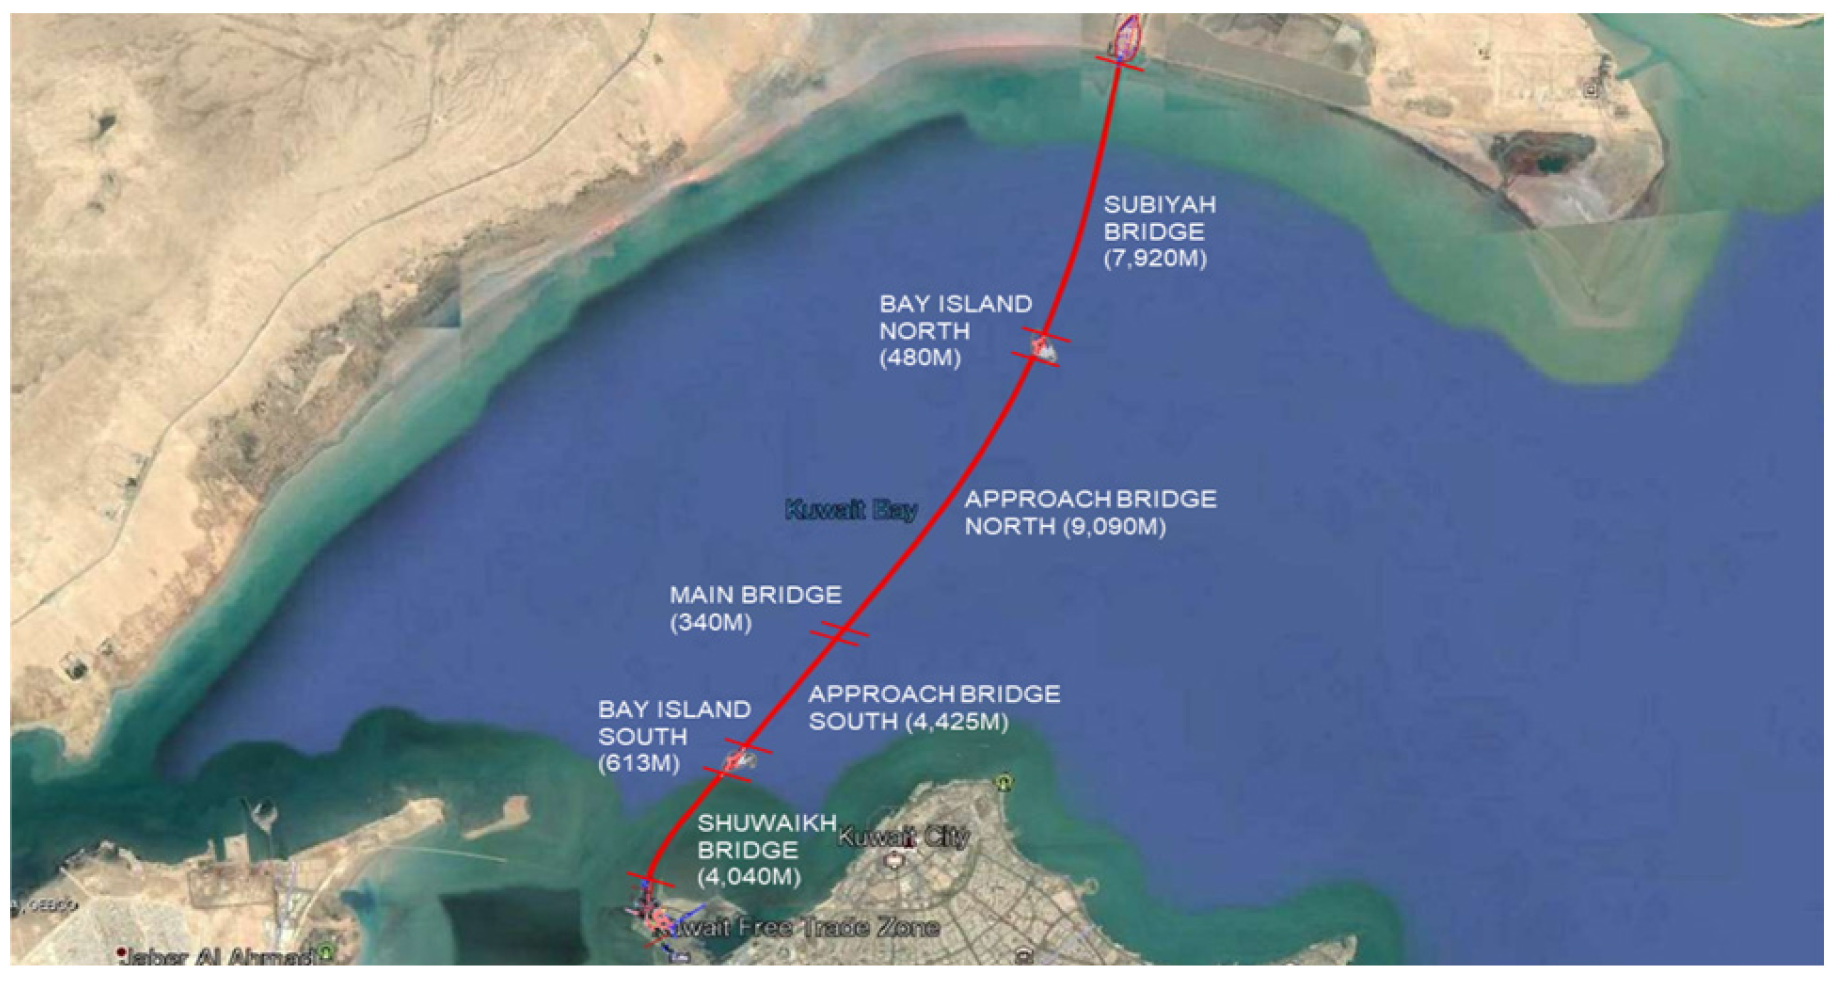
The target structure of this paper is a marine bridge with a total length of 36.14 km that connects Kuwait City to the new city of Subiyah, as shown in
Figure 1.
The span composition of this marine bridge was constructed with an asymmetric cable-stayed bridge (340 m), which is the main bridge, and a PSC box girder bridge (35.80 km), and the initial value data, which are the basic foundation for the maintenance entity to carry out efficient maintenance work, were obtained.
Although the initial value data vary somewhat depending on the requirements of the ordering organization, which is the managing entity for the relevant bridge, the results of deflection and strain tests are basically obtained, and to that end, a full load test was performed.
Based on the acquired data, it is possible to quantitatively evaluate changes in the stiffness and sectional force of the bridge in use as of the time of completion, and it is expected that efficient maintenance work can be planned and executed based on the results [
1,
2].
2. Measuring Instrument Installation
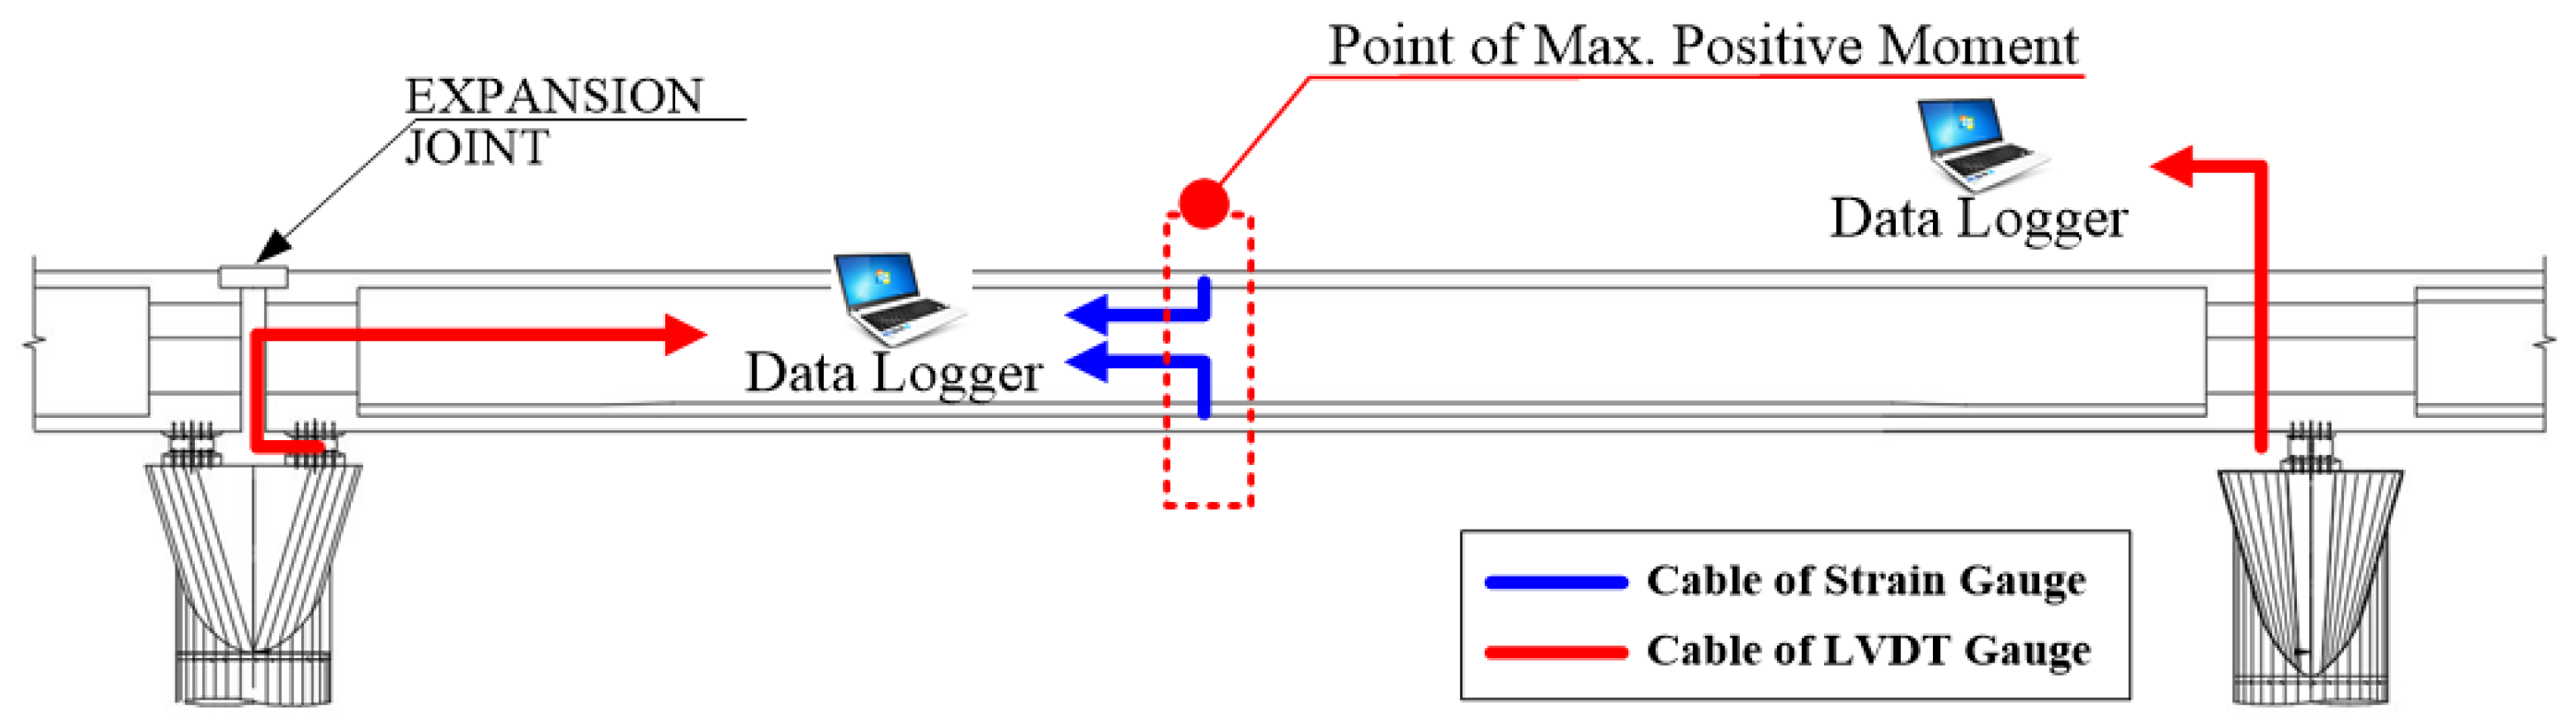
In this load test, a total of three types of measuring instruments were used, which are LVDT, strain gauge, and total station. The linear variable displacement transducer (LVDT) was installed at the position of the elastomeric bearing at the supporting point to measure the amount of deflection of the bearing, and the strain gauges were installed inside the box girder to obtain the strain value as shown in
Figure 2. In addition, considering that the space under the bridge is the sea, the amount of deflection was measured using the total station at the top of the bridge.
During the measurement, the data loggers were placed along the shortest moving line to minimize noise, and two data loggers were used to that end.
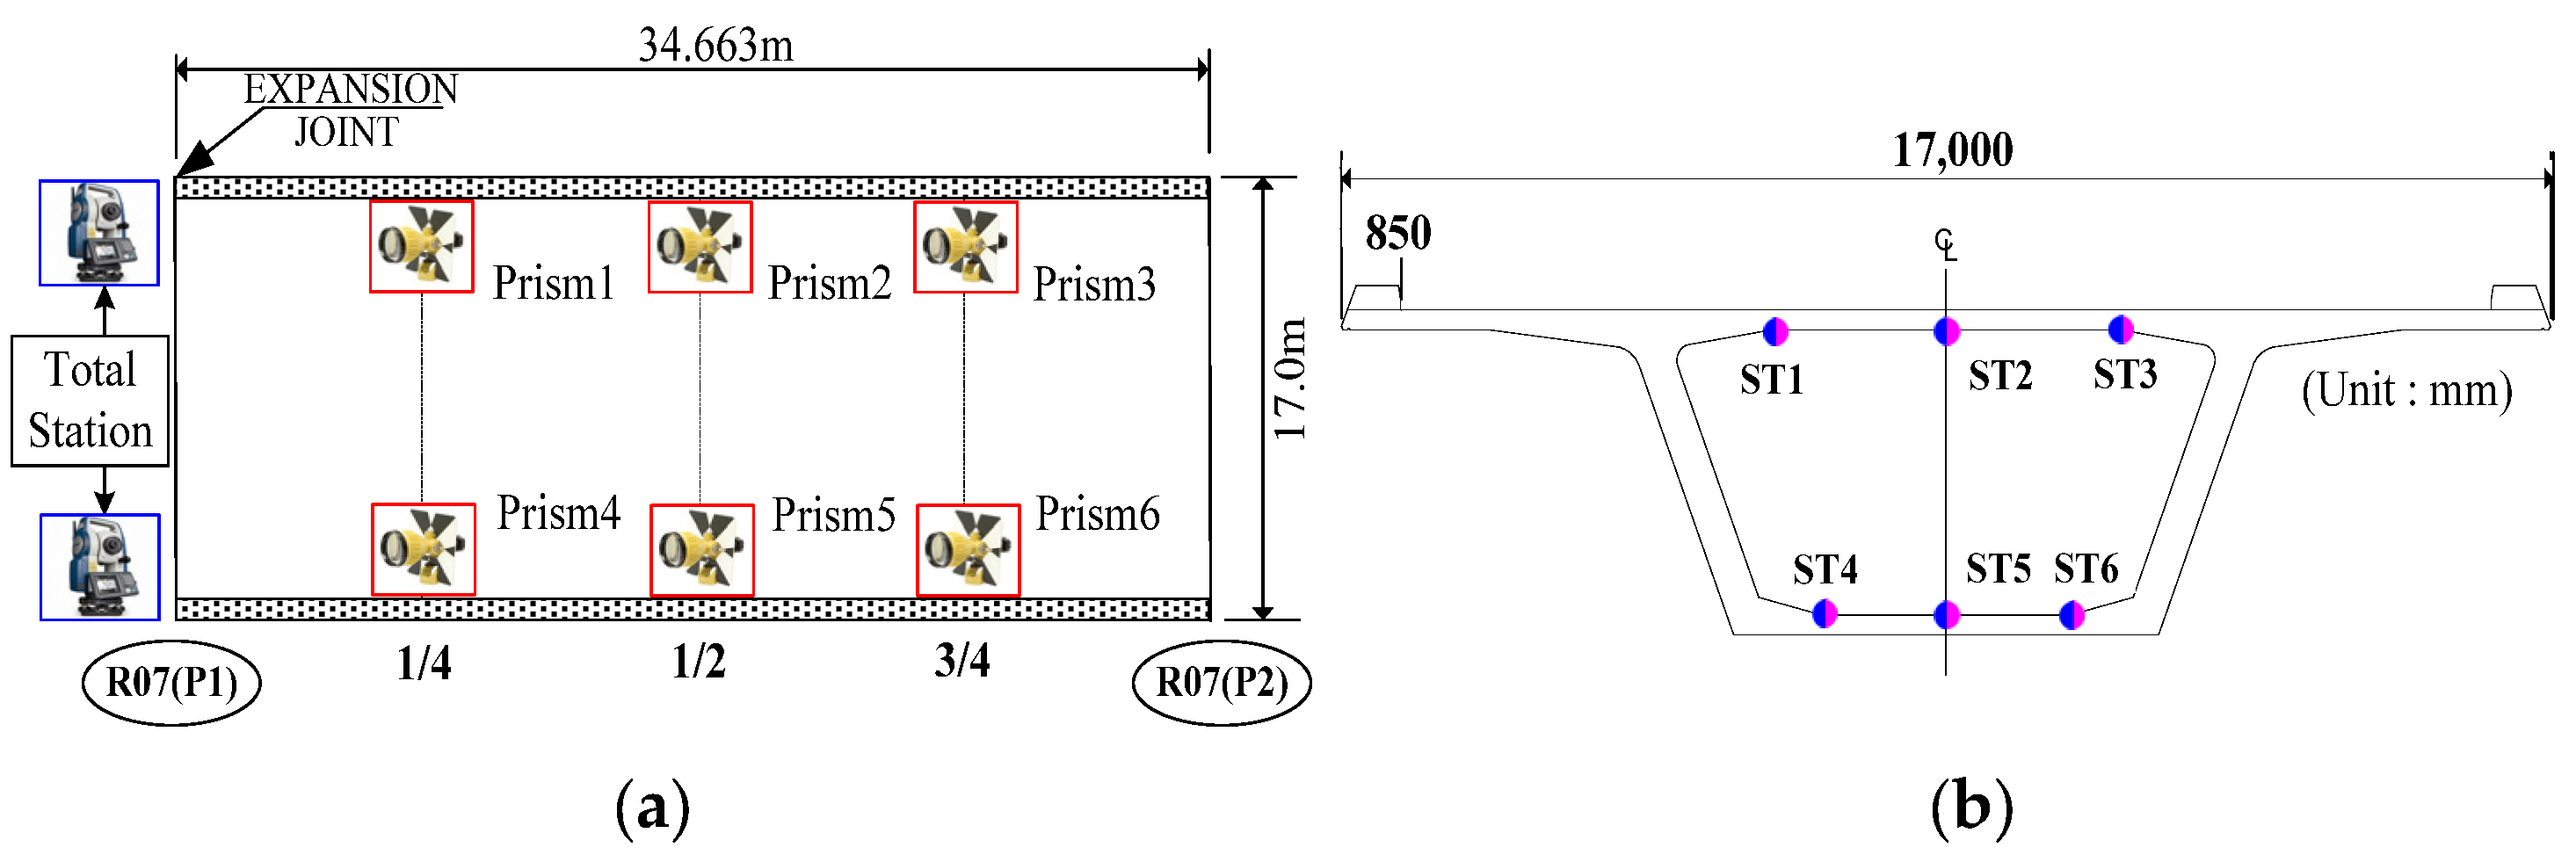
Measuring Instrument Installation Location
The location of the prism installed on the top of the bridge and the location of the strain gauge installed inside the box are shown in
Figure 3, and the total station was located outside the expansion joint of the relevant span to eliminate the influence of loaded vehicles.
3. Load Test
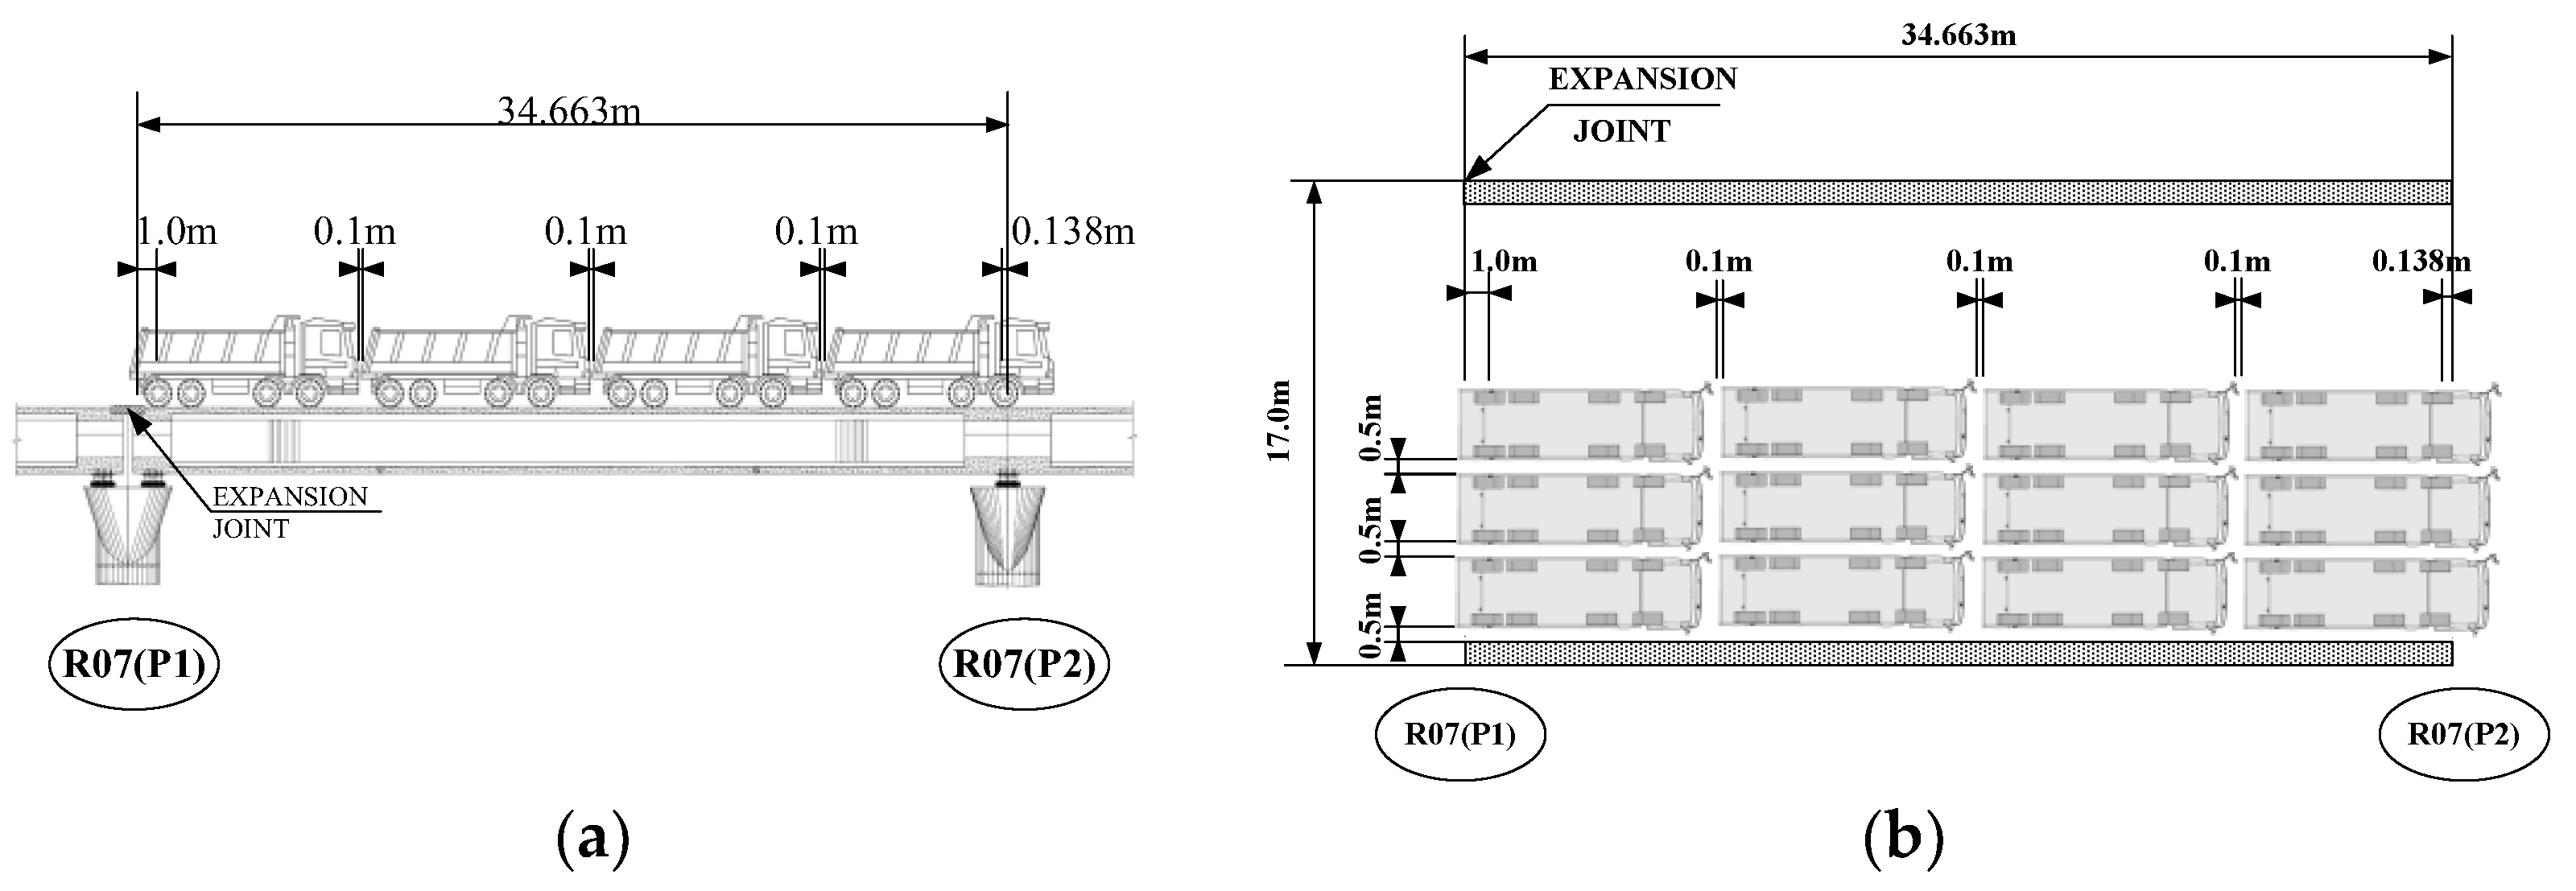
3.1. Loading Vehicle Location Map
The target load for the load test was set as the design moment (14,310 kNm), and to that end, the number of trucks and the size of the load were determined through finite element analysis in advance. The sectional moment generated by the truckload used in this case was set as 14,092 kNm, which is 98.47% of the design load. Twelve 40 tonf dump trucks were loaded in the longitudinal and transverse directions as shown in
Figure 4.
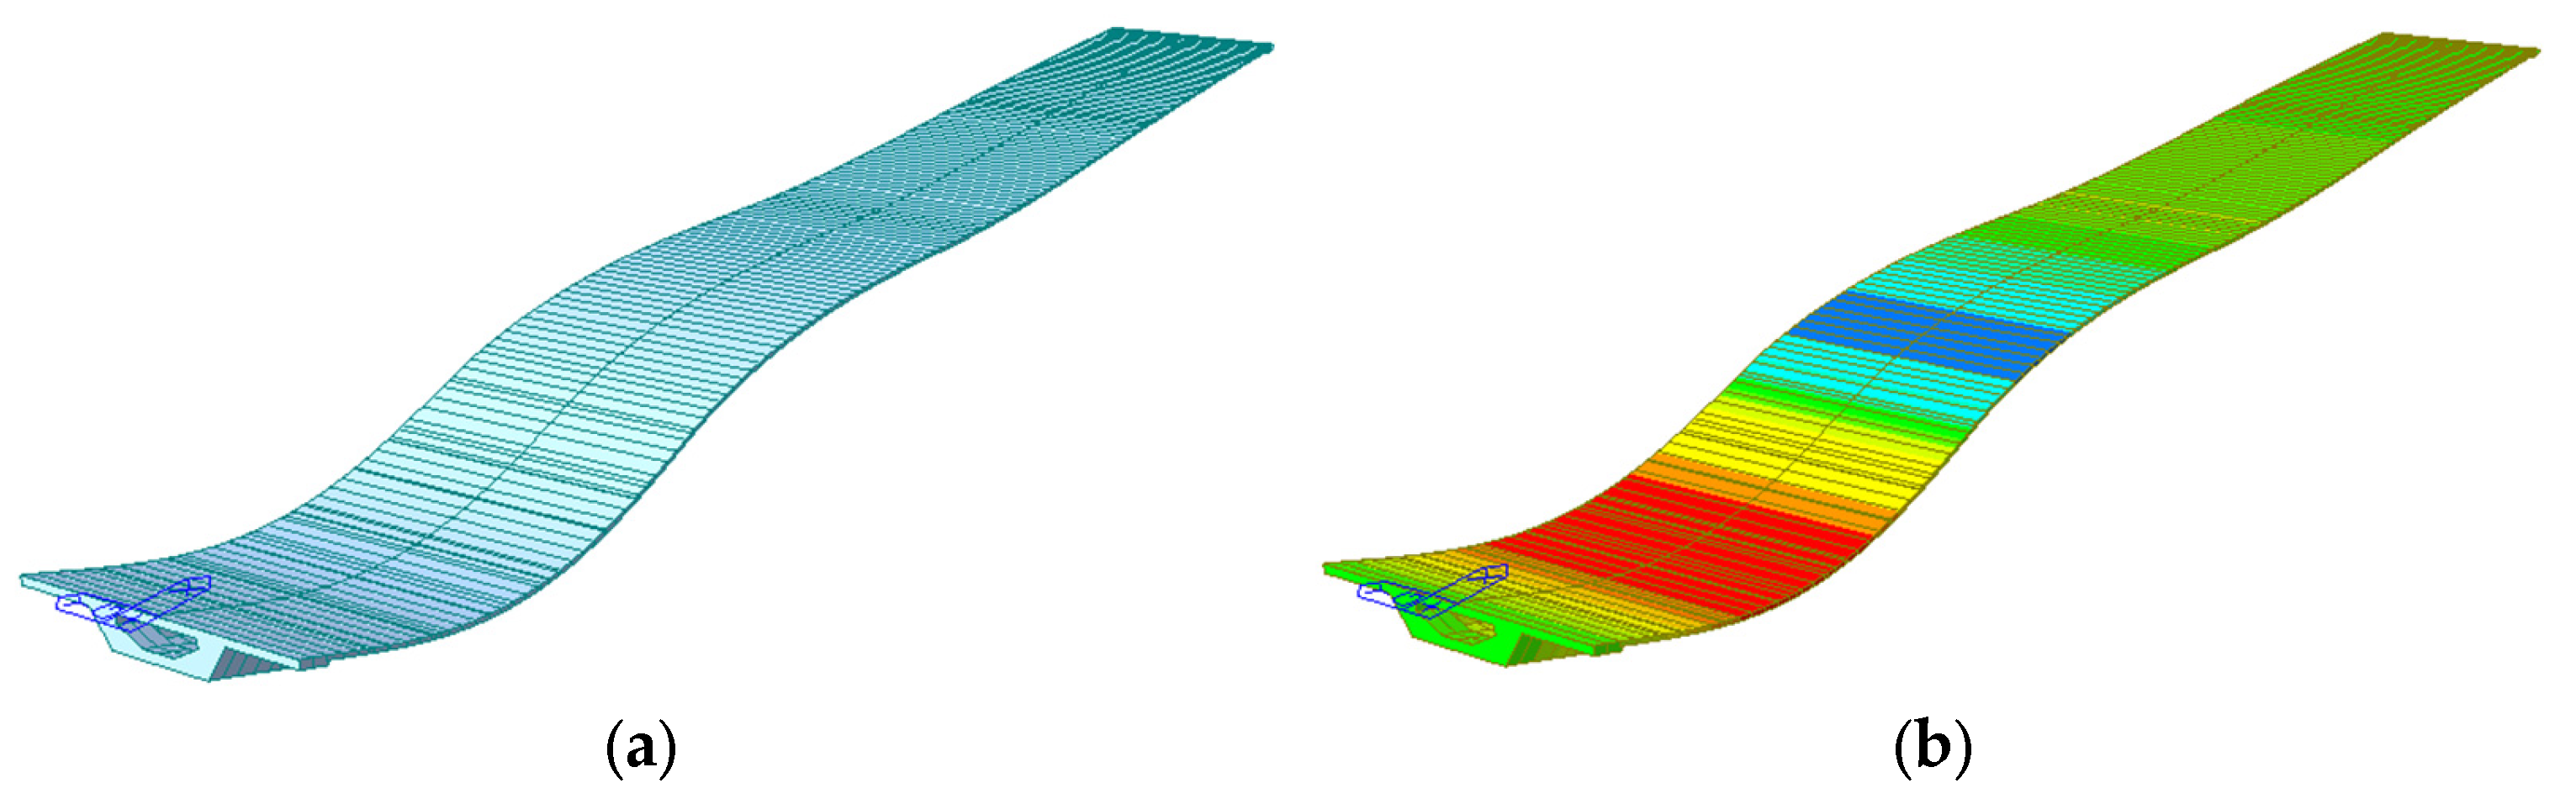
3.2. Finite Element Analysis
It was determined to set the target load as close to the design moment as possible, and to that end, the load positions, and the load, which was 98.47% of the design moment, were determined through repetitive finite element analyses [
3,
4].
The deflection and strain values calculated as a result of the finite element analyses were compared and analyzed with the measured resultant values to verify the adequacy of the behavior of the theoretical structure and to quantitatively calculate the variation in the stiffness of the actual structure compared to the design, as shown as
Figure 5.
3.3. PSC Results of Test of the Resilience of the PSC Girder
After the load test, additional amounts of defection were checked while maintaining the loaded vehicles for 24 h, but there was no change. In addition, it was identified that when all 12 loaded vehicles were removed, all the deflection was restored.
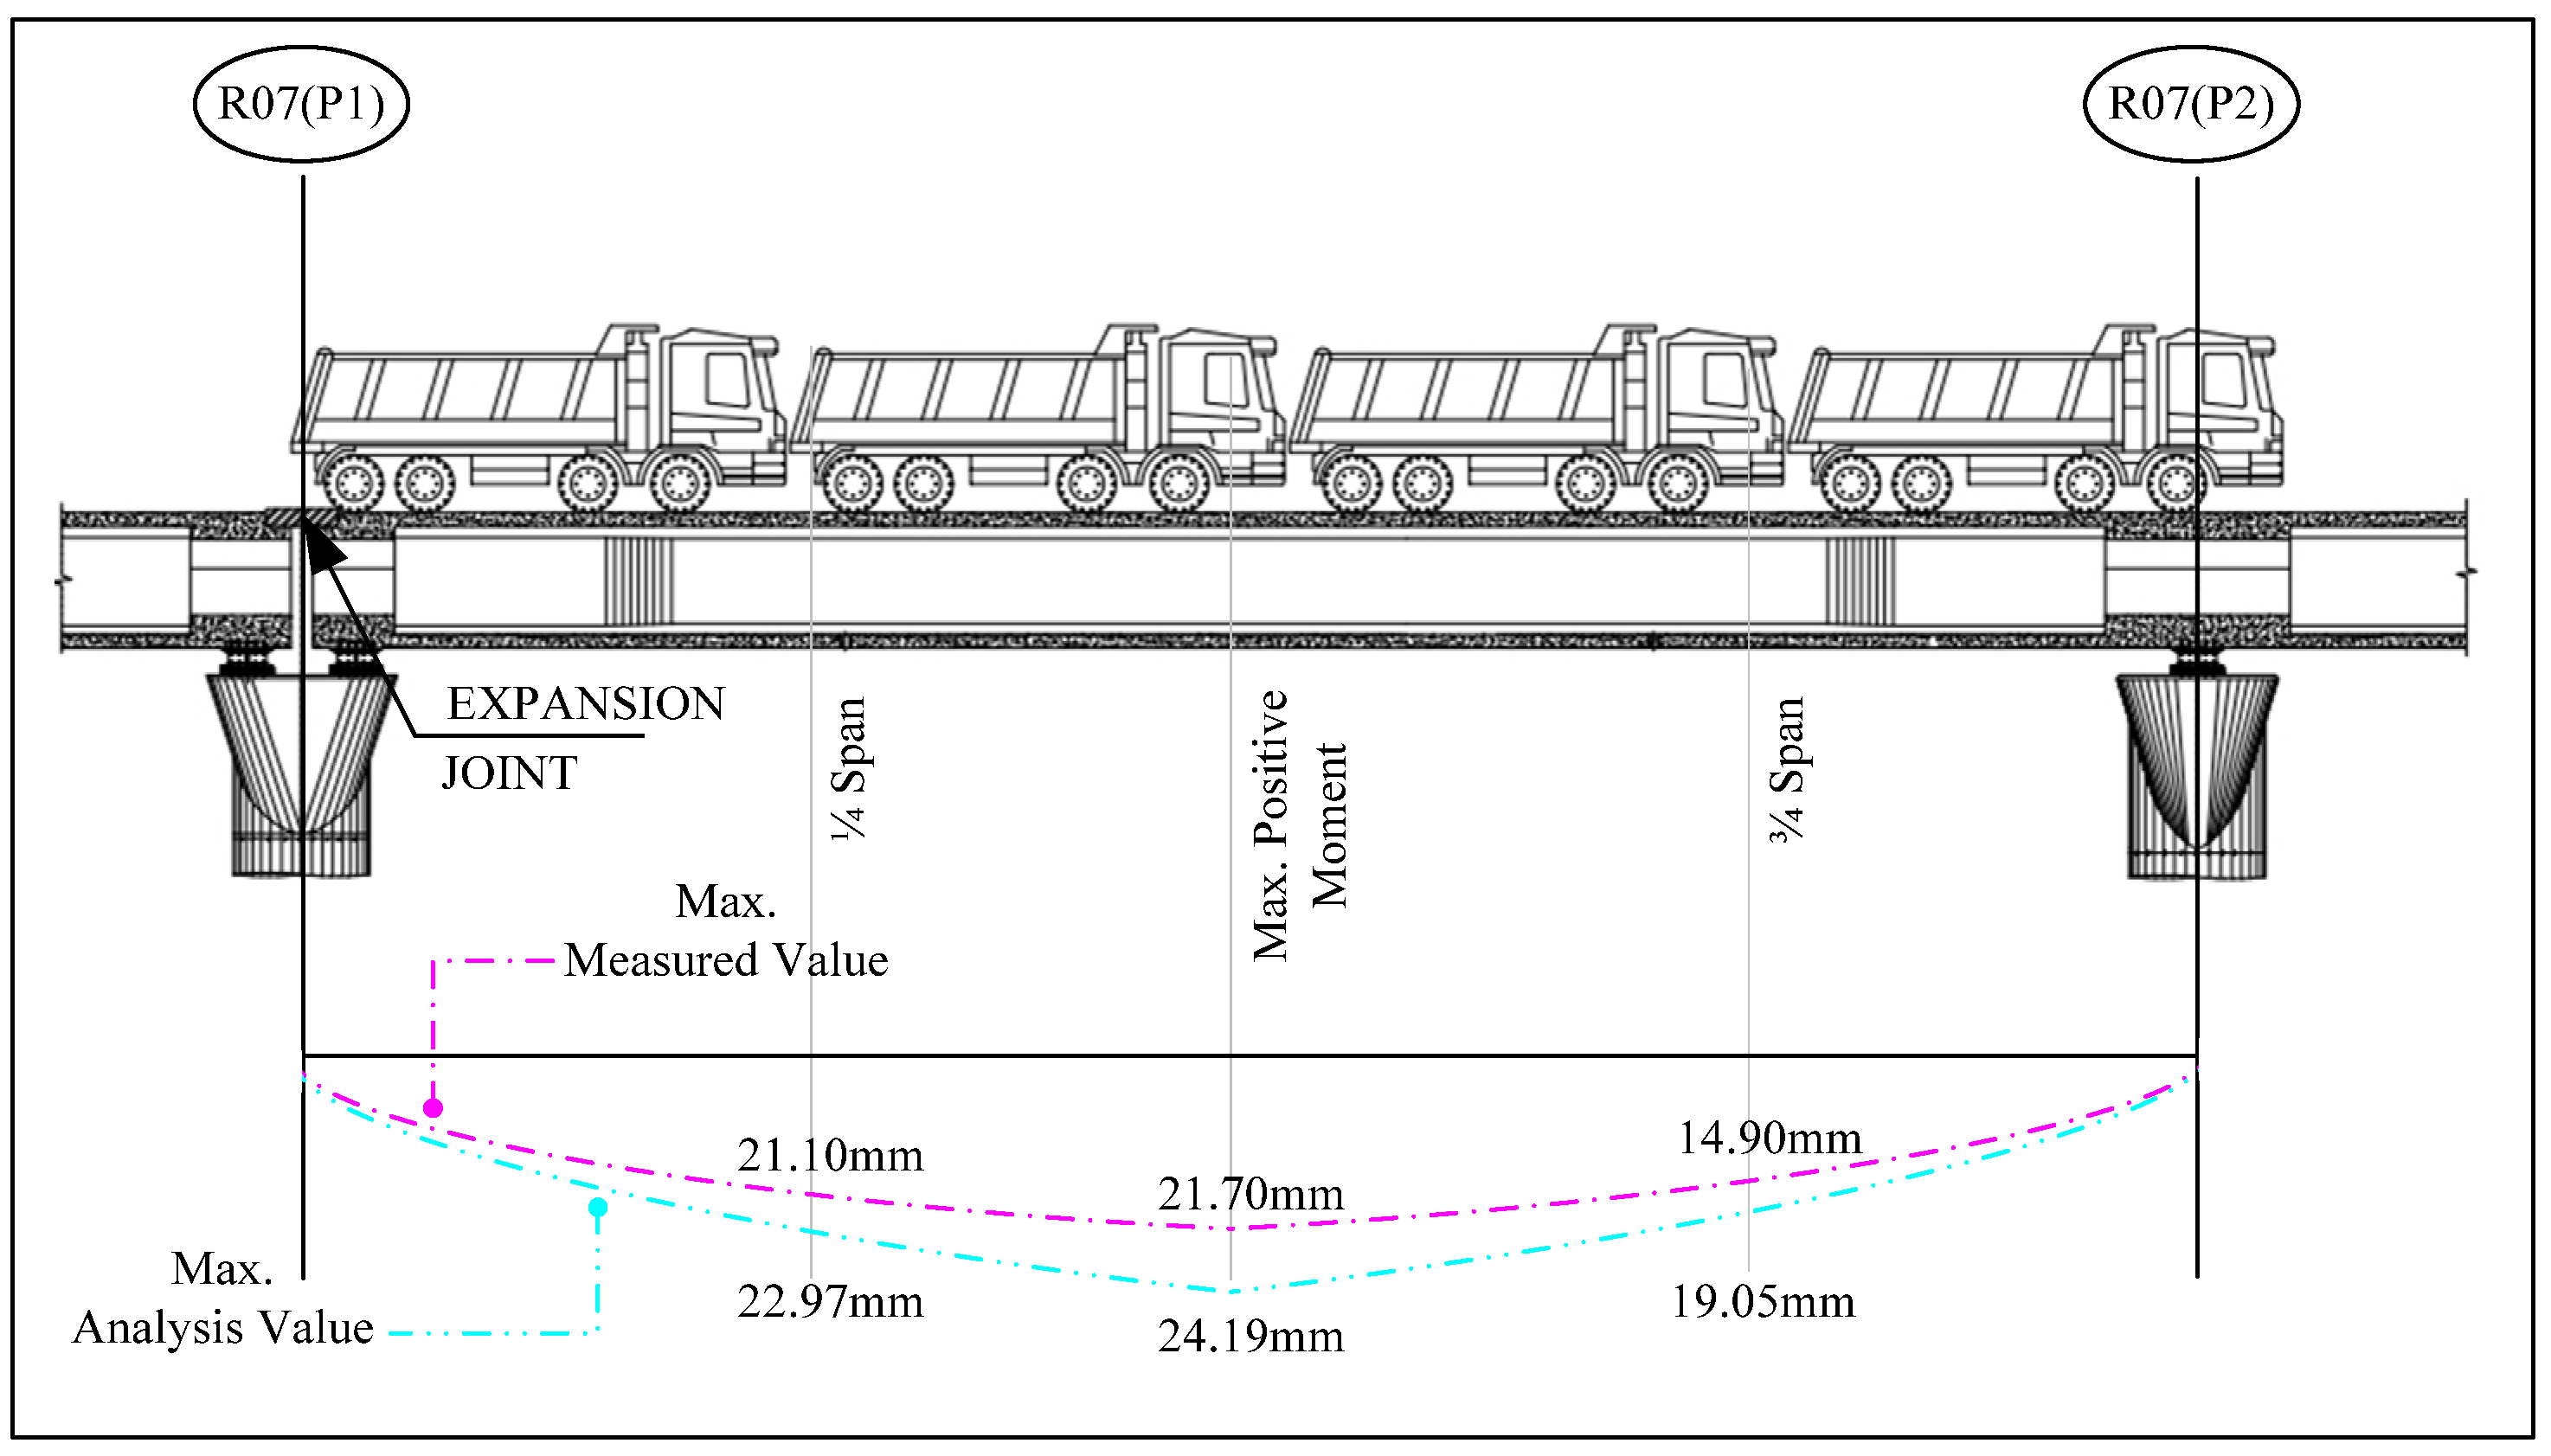
3.4. Results of Measurement of the Amount of Defection and Strain
The measured values of the amount of deflection and strain were compared with the values obtained analytically, and as a result of the comparison at the maximum point of the positive moment, a maximum response ratio of 1.12 was derived in the deflection, and a result exceeding the predetermined reference value was obtained in strain, as shown in
Figure 6 and
Table 1.
4. Conclusions
This study was conducted to provide basic data for planning and execution of maintenance work in use hereafter by performing load tests at the time of completion of the bridge and analyzing the measurement results. By analyzing the results of the test performed in a limited range, it was confirmed that the stress range and mechanical behavior characteristics were similar to the results of the analysis.
Author Contributions
Conceptualization, K.K. and R.L.; methodology, K.K.; software, J.P.; validation, J.P., I.H. and S.L.; formal analysis, K.K.; investigation, S.L.; resources, R.L.; data curation, I.H.; writing—original draft preparation, K.K.; writing—review and editing, D.C.; visualization, D.C.; supervision, D.C.; project administration, S.L.; funding acquisition, R.L. All authors have read and agreed to the published version of the manuscript.
Funding
This research received no external funding.
Institutional Review Board Statement
Not Applicable.
Informed Consent Statement
Not Applicable.
Data Availability Statement
Not Applicable.
Conflicts of Interest
The authors declare no conflict of interest.
References
- Bathe, K.-J. Formulation of the Finite Element Method. In Finite Element Procedures; Prentice Hall: Englewood Cliffs, NJ, USA, 1995; pp. 153–186. [Google Scholar]
- Hambly, E.C. Box Girder Deck. Bridge Deck Behaviour, 2nd ed.; E & FN SPON: London, UK, 1991; pp. 135–156. [Google Scholar]
- Logan, D.L. Development of Beam Equations. In A First Course in the Finite Element Method; PWS Publishing Company: Boston, MA, USA, 1993; pp. 151–187. [Google Scholar]
- Precast Prestressed Concrete Bridge Design Manual; PCI: Chicago, MI, USA, 1997; Volume 1, pp. 354–387.
| Disclaimer/Publisher’s Note: The statements, opinions and data contained in all publications are solely those of the individual author(s) and contributor(s) and not of MDPI and/or the editor(s). MDPI and/or the editor(s) disclaim responsibility for any injury to people or property resulting from any ideas, methods, instructions or products referred to in the content. |
© 2023 by the authors. Licensee MDPI, Basel, Switzerland. This article is an open access article distributed under the terms and conditions of the Creative Commons Attribution (CC BY) license (https://creativecommons.org/licenses/by/4.0/).


 ,
, 
