Abstract
In order to achieve a more efficient allocation of healthcare resources in the near future, it is crucial to understand the patterns and causes of excess mortality and hospitalizations. Neonatal mortality still poses a significant challenge, particularly in developed nations where the mortality rates are already low and healthcare resources are generally available to most of the population. Furthermore, the low mortality rates mean that the data available for modeling are often very limited, restricting the modeling methods that can be used. It is also important that the chosen methods allow for explainable, non-black-box models that can be interpreted by healthcare professionals. Considering these challenges, the work hereby presented thoroughly analyzed the time series of the neonatal mortality rates in Portugal between 2014 and 2019 in terms of trend and seasonal patterns. The applicability and performance of different data-based methods were also analyzed. Furthermore, the mortality rates were studied in terms of their relation to environmental variables, such as temperature and air pollution indicators, with the goal of establishing causal relations between such variables and excess mortality. The preliminary results show that ARMA, neural and fuzzzy models are able to forecast the studied mortality rates with good performance. In particular, neural models have the best predictive performance, while fuzzy models are well suited to obtain interpretable models with acceptable performance.
1. Introduction
The survival and prosperity of children are at the heart of any thriving society. This is especially true for developed countries, where advances in medical technology and better living standards have led to a longer life expectancy, altering the population distribution among different age groups.
Children are the future labor force, responsible for keeping the economy moving and caring for the older generation while preparing the next generation for the challenges ahead. Regardless of a country’s location or socioeconomic status, children are the foundation of any nation’s success, and their welfare is vital to ensuring a prosperous future.
One of the most significant achievements in global health is the decline in child mortality rates [1]. The number of deaths in children under the age of five has fallen drastically from 19.6 million in 1950 to 9.6 million in 2000 and 5.0 million in 2019 [2], indicating a worldwide decrease of 74.5% over the last 70 years.
However, there is still much work to be done. The United Nations’ Sustainable Development Goals aim to end preventable deaths of newborns and children under the age of five by 2030 [3], with a target of reducing neonatal mortality to no more than 12 per 1000 live births and under-five mortality to no more than 25 per 1000 live births.
Child mortality rates are influenced by a variety of factors, which vary greatly across different regions of the world. Developing countries face significant challenges such as malnutrition, lack of access to clean water and inadequate healthcare and public safety infrastructure [4]. Addressing these issues is crucial to reducing child mortality rates. In contrast, European nations have some of the lowest child mortality rates globally [5], reflecting their strong commitment to children’s health and well-being. Ultimately, a country’s geographic location, socioeconomic status and cultural profile have a significant impact on child mortality rates and the factors that determine them.
Neonatal mortality refers to the death of infants within the first 28 days of life [6]. It is still one of the most significant challenges facing the global health community, particularly in low- and middle-income countries, and a critical indicator of a country’s health status, healthcare system and socioeconomic development. According to the World Health Organization (WHO), an estimated 2.4 million neonatal deaths occurred globally in 2019, less than half of the 5.0 million that occurred in 1990 [7].
Neonatal mortality is preventable, and several interventions can help to reduce it. These include improving access to quality healthcare services, particularly during pregnancy, childbirth and the postnatal period [8]. Ensuring adequate nutrition for pregnant women and infants is also crucial [9], as well as promoting healthy behaviors such as breastfeeding and providing essential newborn care. Reducing neonatal mortality has far-reaching benefits beyond saving lives. It can lead to a healthier population, increased economic productivity [10] and improved social outcomes. Addressing the underlying socioeconomic determinants of neonatal mortality may also play a critical role.
Examining neonatal mortality data in a country such as Portugal, where rates are already extremely low, is still crucial for several reasons. First, even in countries with low neonatal mortality rates, there can be regional or socioeconomic disparities that need to be addressed. By analyzing the data, policymakers can identify areas where there may be higher rates of neonatal mortality and develop targeted interventions to address these disparities.
Secondly, analyzing neonatal mortality data can help to identify trends and patterns over time. Even if the overall rates are low, there may be changes in specific causes of neonatal mortality or demographic groups that require attention. For example, there may be an increase in the number of premature births, which would require additional resources and interventions to address.
Thirdly, neonatal mortality studies can help to evaluate the effectiveness of interventions and policies aimed at reducing neonatal mortality. Even in countries with low rates, there may still be room for improvement, and analyzing the data can help to identify areas where additional efforts are needed.
While countries such as Portugal may have made significant progress in reducing neonatal mortality, there is still a long way to go to achieve the Sustainable Development Goals. Therefore, it is critical to raise awareness and advocate for continued efforts to reduce neonatal mortality globally. By highlighting the importance of this issue and sharing best practices, policymakers and public health officials can continue to work towards improving the health outcomes of mothers and newborns worldwide.
The aim of this study is to forecast and explain neonatal mortality in Portugal using machine learning techniques. We analyzed a range of mortality and environmental variables to identify the most significant predictors of neonatal mortality. Furthermore, we developed three predictive models that can forecast neonatal mortality rates in Portugal over the next couple of years. The results of this study will provide valuable insights into the determinants of neonatal mortality in Portugal and may have implications for the design of public health interventions to reduce neonatal mortality rates in the country.
The remainder of this paper is structured as follows. Section 2 shows the data used in this study, as well as how the data was prepared. In Section 3, a forecast of neonatal mortality is presented based on the past values of the time series using ARMA models. In Section 4 and Section 5, models using the past values of the time series as well as exogenous values are presented, namely neural and Takagi–Sugeno fuzzy models. Finally, in Section 6, an overview of the conclusions drawn from this study is presented.
2. Data Preparation
For this study, we had access to data regarding all neonatal deaths provided by Directorate-General for Health, “Direção Geral de Saúde” (DGS), from January 2014 to December 2019. Furthermore, we used exogenous data to develop the models in Section 4 and Section 5, such as temperature and various pollution indicators.
Regarding the neonatal mortality data, firstly, the data were aggregated by month of death as we had the exact date. Then, data were divided into a trend and deviation from such trend, as in [11]. Firstly, we computed the moving average by considering the current month and the 11 that preceded it, which aided in smoothing out data fluctuations and improving the representation of the underlying trend, as in [12]. In order words, the average calculated for December 2014 uses data from January 2014 to December 2014. Note that this is the first sample that was actually used, because samples from previous months would require data from 2013.
Next, we calculated the deviation from the moving average to each real value, which highlighted unusual patterns in the data. For this, data were divided into training and test sets. It was established that data from December 2014 to December 2017 is used as training data, and those from January 2018 to December 2019 are the test data.
Regarding exogenous variables, such data were provided for each municipality individually, similar to [13] but at a larger scale. However, this study focuses on forecasting mortality in the country, so national values would be preferable. To obtain a national value for each exogenous variable for each month, the average weighted by the population was calculated, in the following way:
where t represents time; i a municipality; a raw (by municipality) exogenous variable, such as temperature; X the respective transformed (nationwide) variable; and the population of a municipality. By calculating the weighted sum in this way instead of a simple average, we guarantee that the values of the more heavily populated areas have more impact on the final value since more people are exposed to those conditions. Table 1 presents the exogenous variables used for the modeling procedure.

Table 1.
Exogenous variables.
3. ARMA Modeling
As an initial approach, an AutoRegressive Moving Average (ARMA) model was utilized to predict neonatal mortality in 2018 and 2019 due to its widespread usage and established effectiveness in modeling time series data, see [14,15,16]. ARMA models have proven to be particularly useful in scenarios where a clear dependence exists between the current value of the time series and its past values.
We employed an ARMA model to predict the moving average segment of the time series. Subsequently, we created another ARMA model to predict the deviation segment of the time series. For both ARMA models, data regarding the last 12 months were utilized. Eventually, summing up the two predictions derived the ultimate prediction value, accounting for both the trend and variations in the data, which enhanced the prediction performance.
Overall, the procedure facilitated the accurate analysis of the neonatal mortality time series and generated precise predictions for future values. Incorporating the moving average and deviations from it, along with utilizing ARMA models for prediction, allowed the trend and variations in the data to be accounted for, resulting in more accurate predictions.
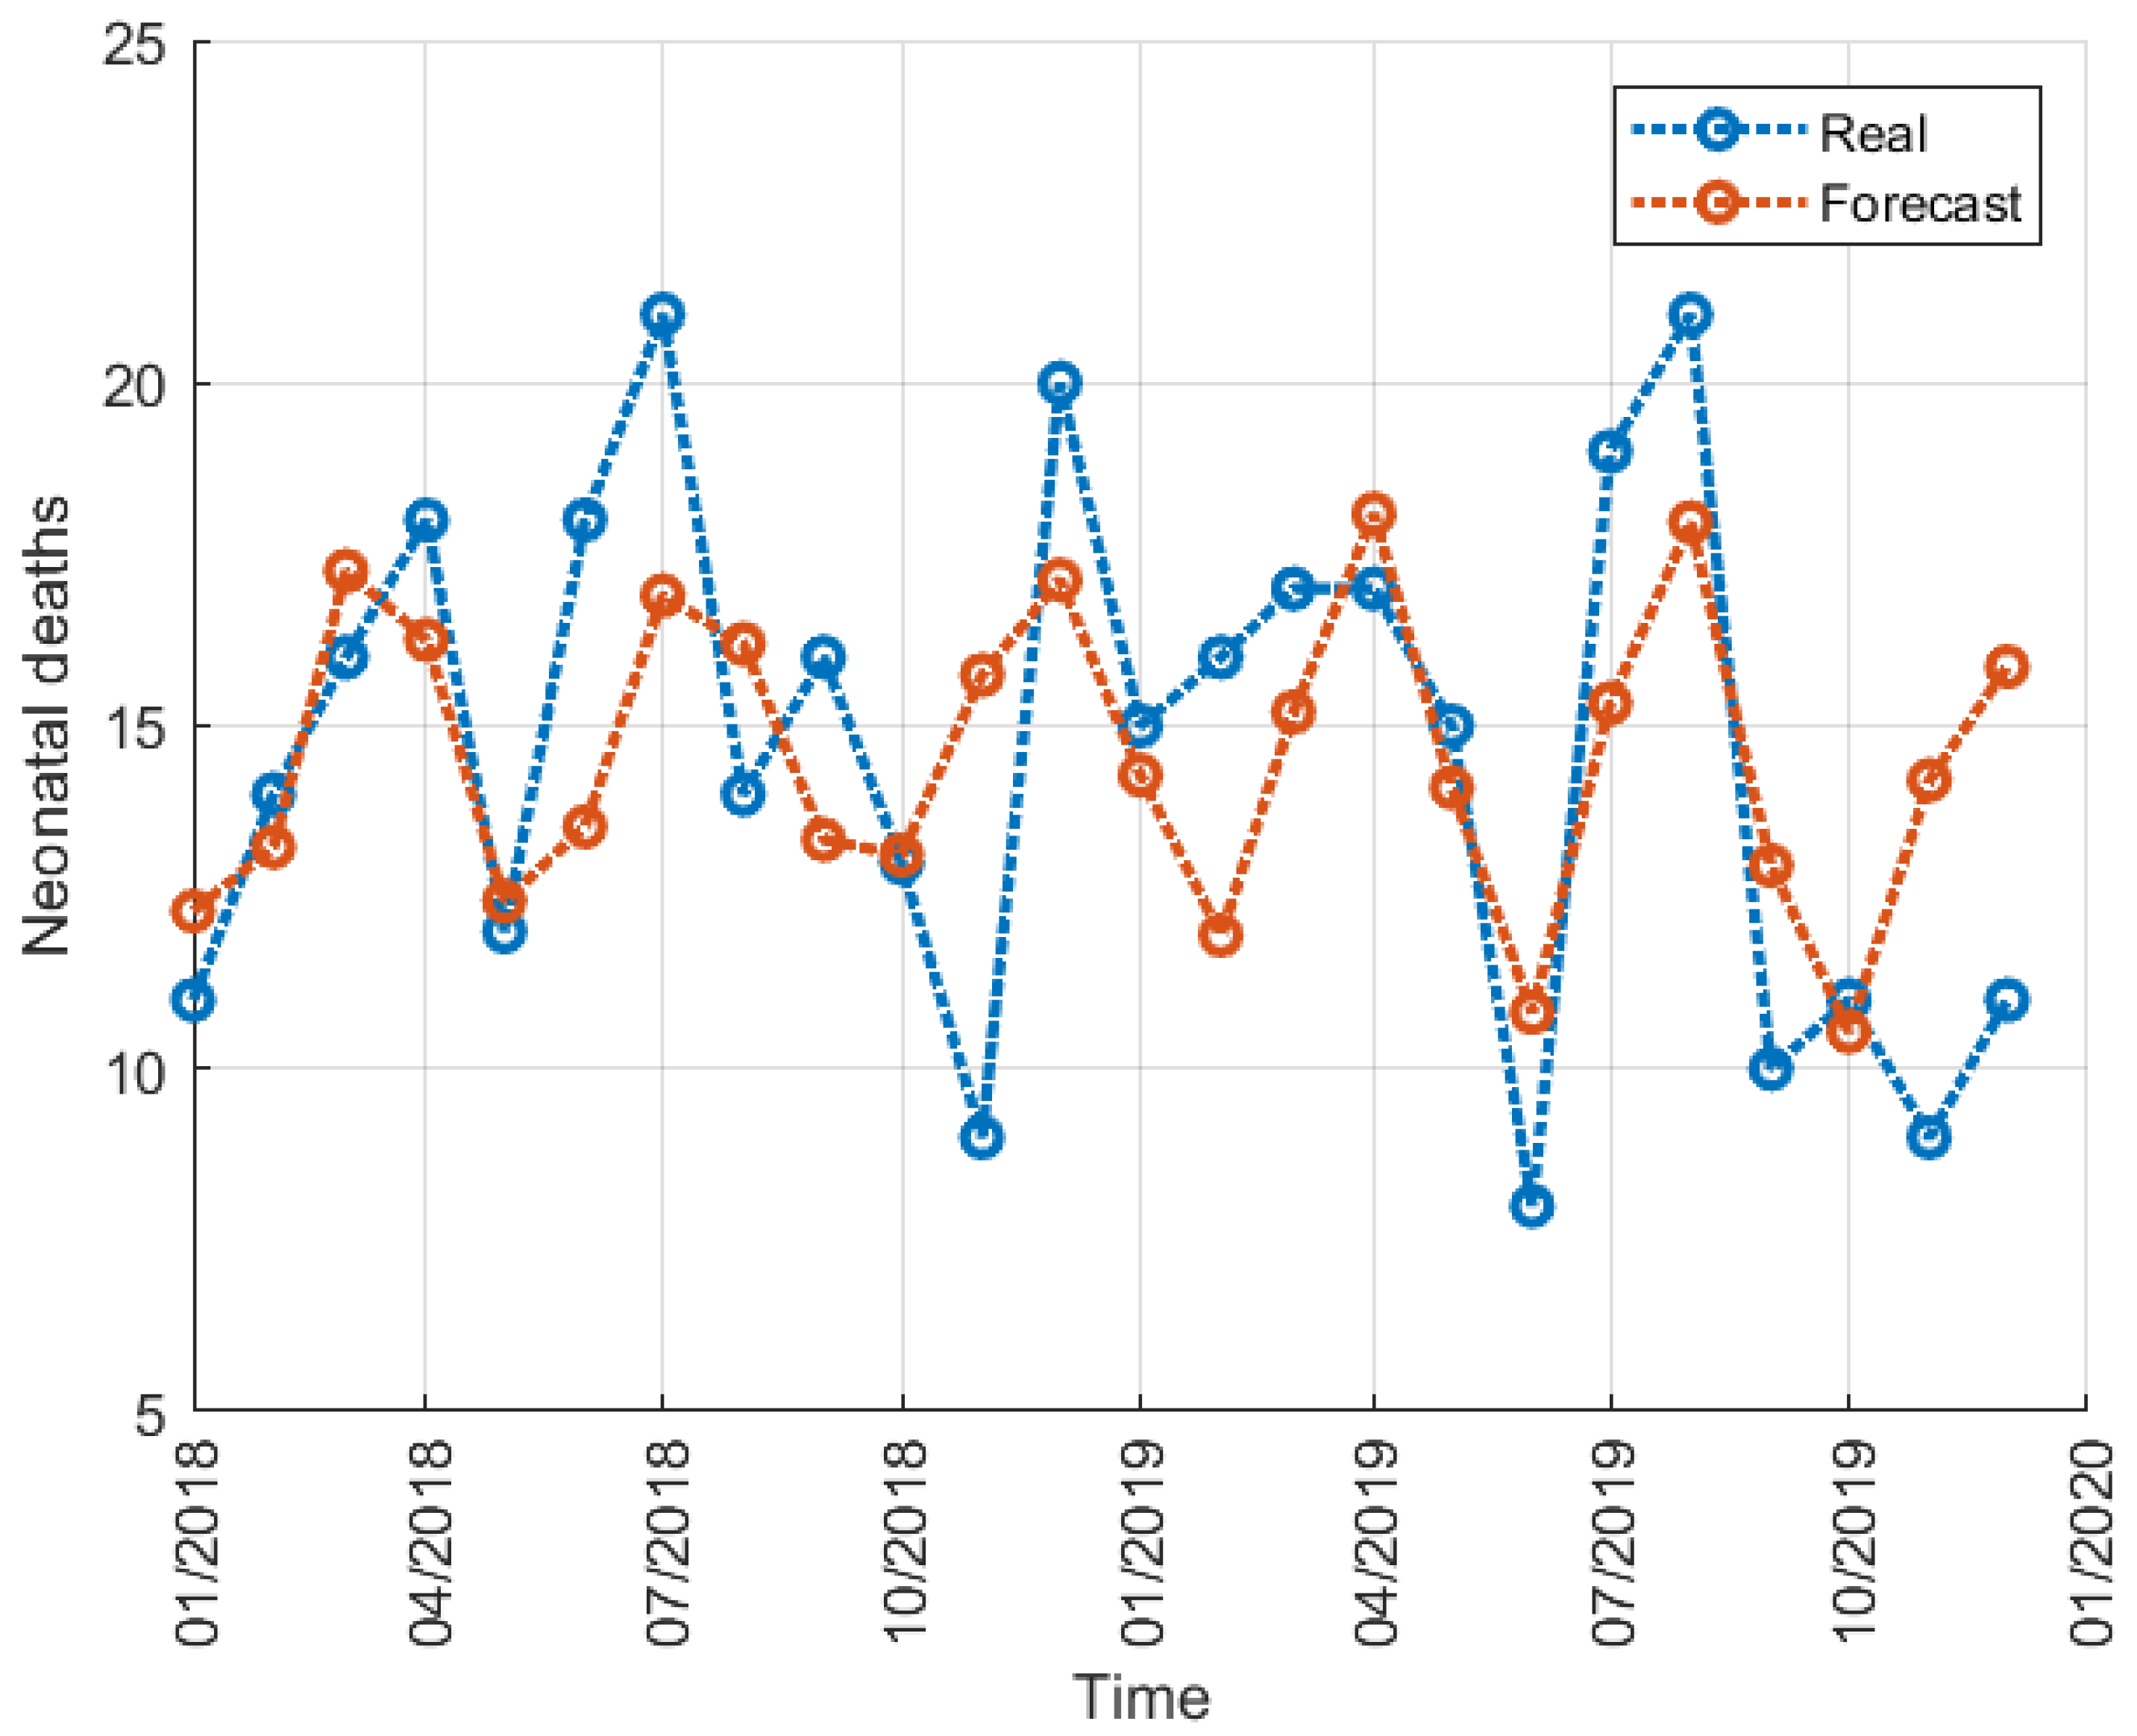
Although there are differences between the predicted and actual values, this can be attributed to noise and variability in the data, as well as the assumptions and limitations of the ARMA models utilized. The obtained results (Figure 1) indicated that ARMA models are effective in capturing the underlying patterns and dependencies in the data, with an RMSE of 3.042 and a VAF of 0.36 indicating an average difference of 3 units from the actual values, which is reasonable given the time series data’s range of values. However, it is crucial to note that the RMSE is just one measure of prediction accuracy, and there may be other metrics or measures that can provide different insights [17].
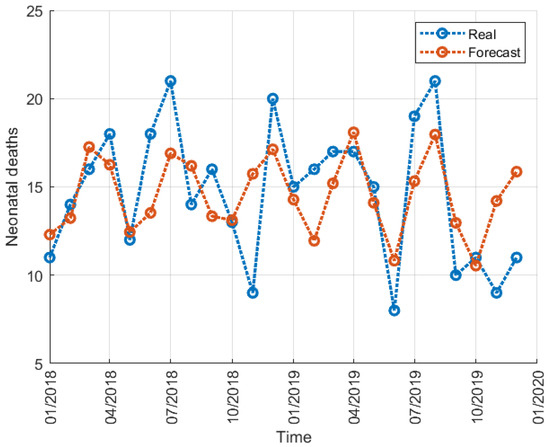
Figure 1.
Neonatal deaths forecast using yearly and monthly ARMA model.
4. Neural Network Modeling
ARMA models used only the previous values of the time series to predict its future values. Considering such results, the next step is to use also exogenous variables with the goal of achieving better predictive performance. Exogenous variables are variables that are measured alongside the forecast time series and can help determine its future values. In the context of the work hereby presented, the exogenous variables are the environmental variables presented in Table 1.
In this section, we propose to use an artificial neural network (NN) model, as in [18,19], to incorporate the exogenous variables into the modeling process. The proposed NN model takes as inputs the exogenous variables, as well as the previous values of the time series. Following the procedure for the ARMA model, the 12 previous values of the 4 exogenous variables as well as the 12 previous values of the time series moving average and deviations are given as input to the NN model, which then forecasts the mortality for the next time period. Therefore, the proposed network has a total of 72 inputs and one output. Considering such characteristics, the proposed NN is a shallow network with 73 neurons in the hidden layer. Table 2 shows the other relevant properties of the NN model.

Table 2.
Neural nework model parameters.
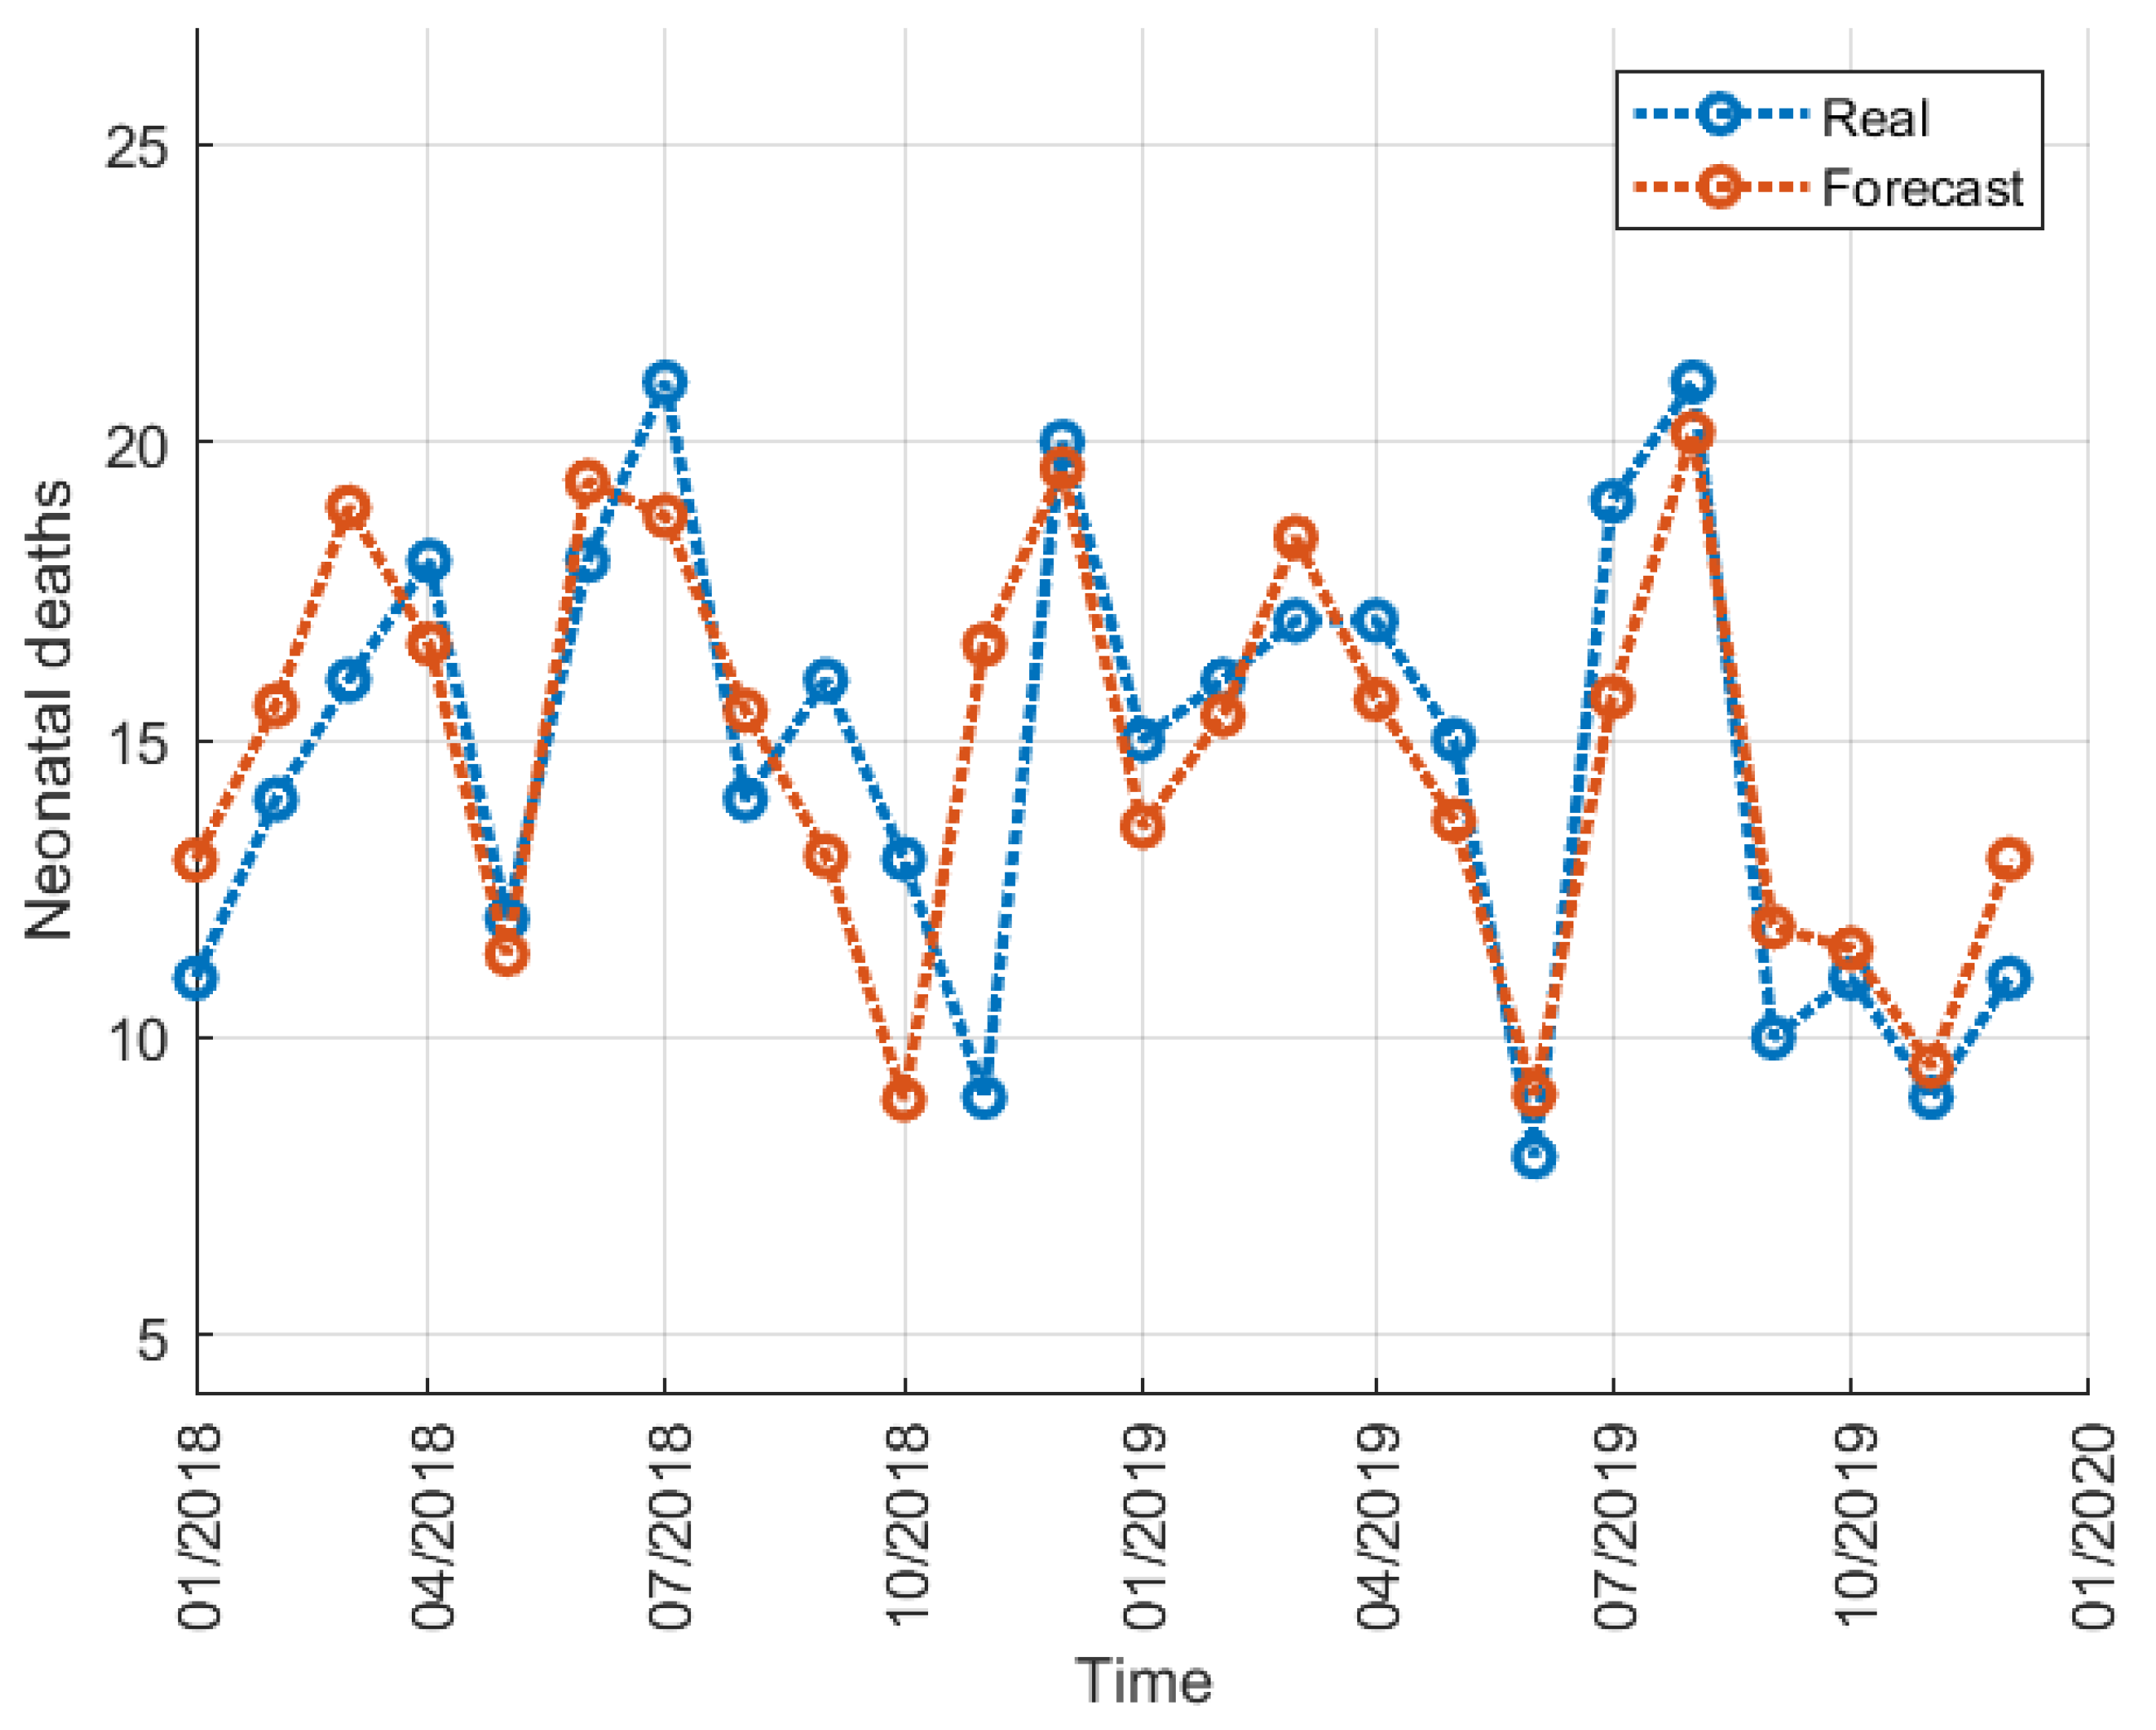
The results (Figure 2) show that the NN model achieved better predictions than the ARMA models with an RMSE of 2.394 and a VAF of 0.61. The improvement in RMSE may be attributed to the inclusion of exogenous variables or to the non-linear nature of the NN. These results suggest that incorporating external factors and utilizing non-linear models can enhance the accuracy and predictive power of time series models.
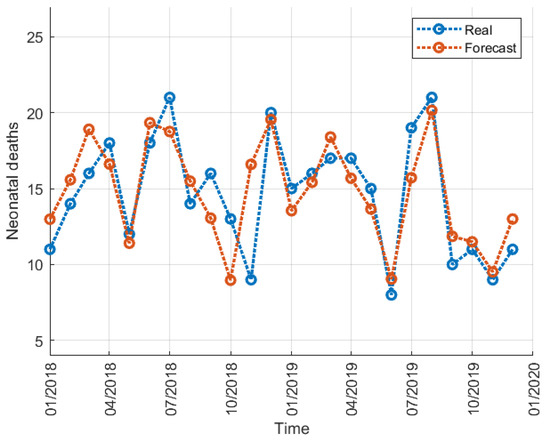
Figure 2.
Neonatal deaths forecast using the NN model.
5. Fuzzy Modeling
NN models are known as black-box models [20], meaning that, while their predictive performance may be outstanding, they are also very hard to interpret, and the reasoning between the inputs and the output is often not clear. This problem, known as interpretability, is one of the most important yet still open problems in the field of machine learning [21,22].
While much research has been carried out in the recent years on this topic, the chosen approach in the work hereby presented is the use of fuzzy logic to model the forecasting problem. Fuzzy inference systems are a class of data-based learning algorithms that are particularly well suited for modeling problems where interpretability is a priority [23,24,25]. Furthermore, Takagi–Sugeno fuzzy systems are universal learners [26], meaning that, similarly to NN models, they are able to approximate any function provided that sufficient degrees of freedom are given to the model.
The modeling approach for the fuzzy models is exactly the same as the one described for the NN in Section 4, with the same inputs and output. The parameters of the obtained fuzzy model are as shown in Table 3.

Table 3.
TSK model parameters.
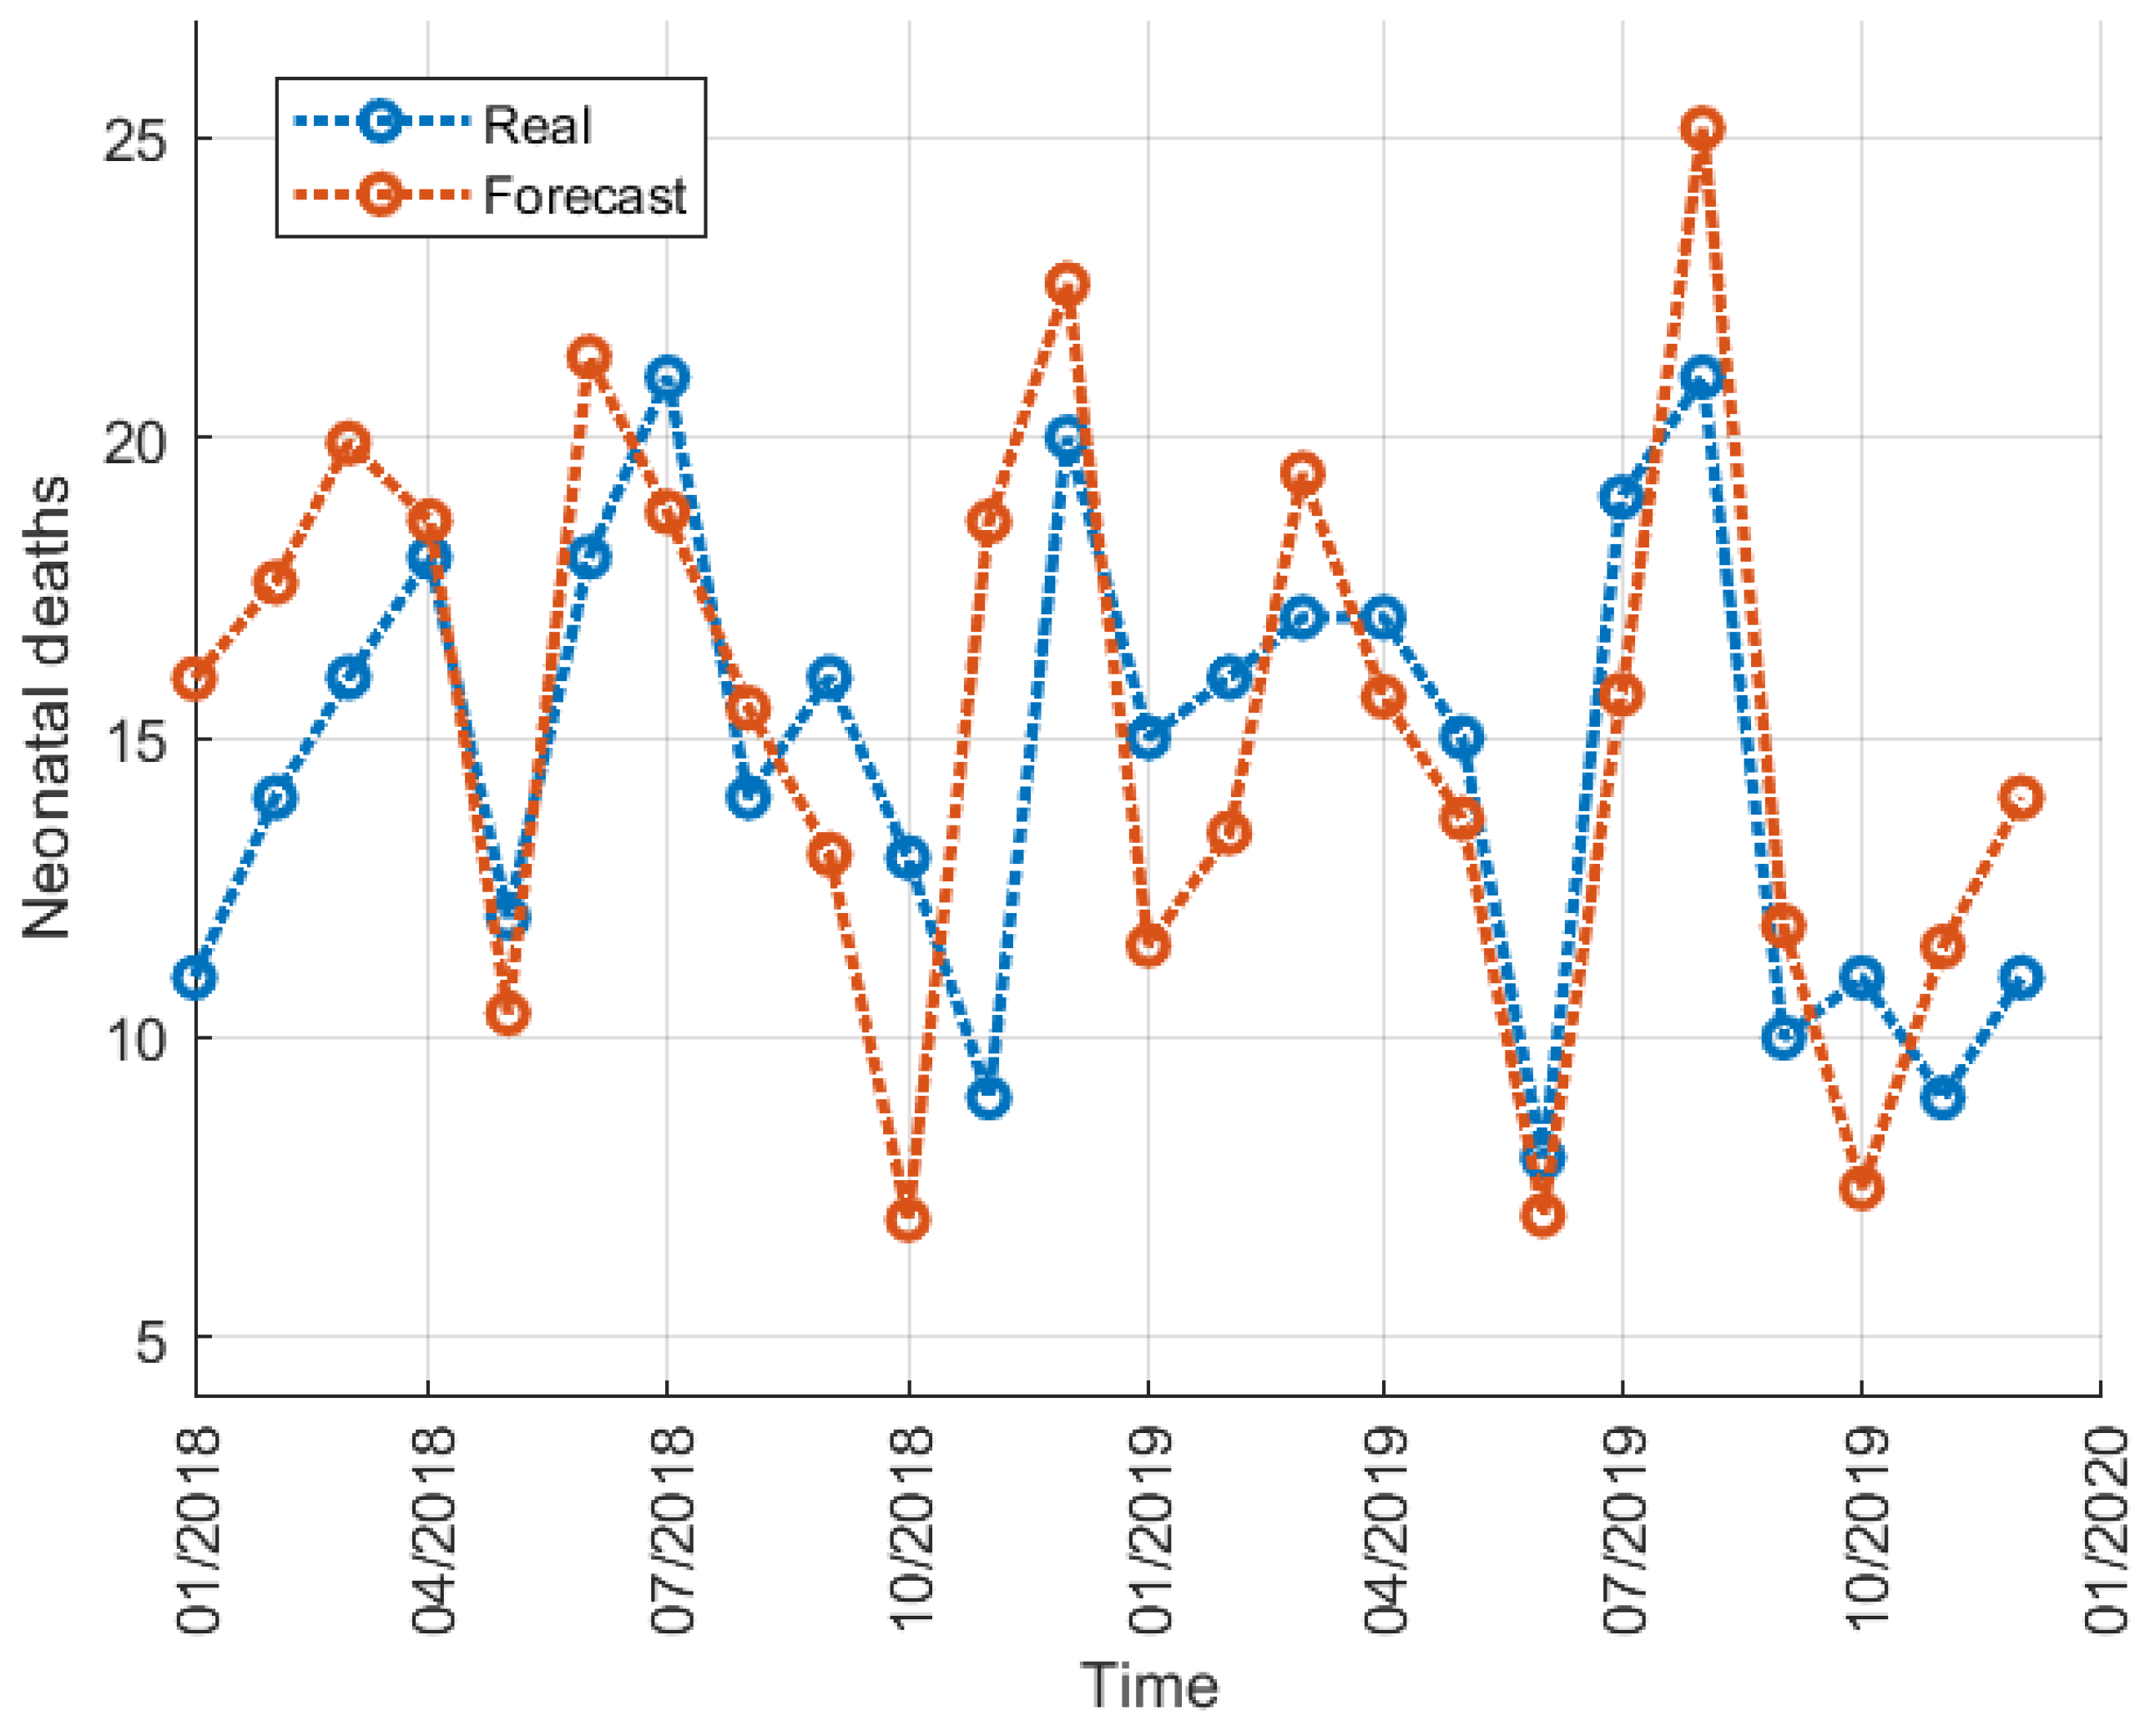
Regarding the predictive performance of the obtained model, Figure 3 shows the forecasting results which correspond to an RMSE of 3.569 and VAF of 0.15, meaning that the model is not so good as the prvious models. However, it is important to mention that the main advantage of fuzzy models is not necessarily their predictive performance, but their interpretability. So, the predictive performance is still acceptable and comparable to the other models. Still, regarding the topic of interpretability, the obtained fuzzy model has a large number of fuzzy rules that makes its interpretability hard without a further refinement of its rules by merging the fuzzy sets. However, the fuzzy model is still by far the most interpretable model obtained in this work.
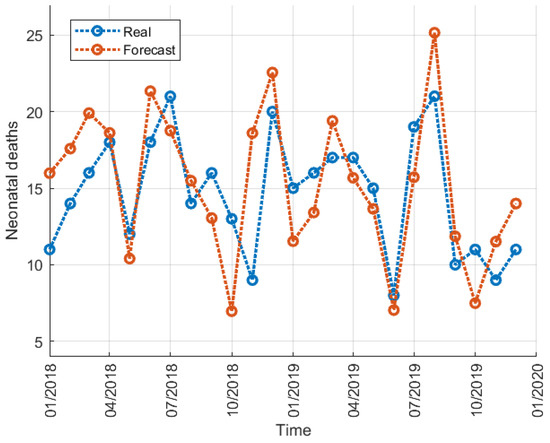
Figure 3.
Neonatal deaths forecast using TSK fuzzy system.
6. Discussion and Conclusions
In this study, three different methodologies to forecasting mortality were utilized. The first one was a junction of two ARMA models, one to predict the trend and another one to predict the deviation from the trend. The results obtained show that the majority of the variations that can be observed in the time series can be predicted by just looking at the mortality rates of the last 12 months. With the aim of improving the prediction made by the ARMA models, an NN model was utilized due to its nonlinear nature and its capability to include exogenous variables to make predictions. The results improved substantially as expected. Finally, aTakagi–Sugeno fuzzy model was utilized to create IF–THEN rules to predict mortality, as these are more interpretable to a human. This model achieved reasonable predictions when paired with a high number of rules, which hurts the interpretability of the task at hand.
Overall, according to the metrics (RMSE and VAF), the NN model is clearly the best performer. However, upon comparing Figure 1 and Figure 3, it is observable that the reason why ARMA models perform so well is that they always make more conservative predictions. In other words, the model underestimates periods of higher mortality and overestimates periods of lower mortality, always keeping its prediction close to the average value of the time series. On the other hand, the fuzzy model more effectively captures the magnitude of the highs and the lows of the time series. The model only performs poorly on both metrics because sometimes the prediction of peaks of mortality is offset by a month, dooming the score on both metrics.
When the prediction is offset from the real curve, it can be observed that prediction comes before the actual peak. These might be useful in certain scenarios because if a peak does not occur in the predicted month, it will most likely occur in the following month. In future work, other interpretable modeling techniques should be used to try to identify which variables and in what instances are critical to predicting neonatal mortality.
Author Contributions
Conceptualization, V.D., M.V.R., S.M.V. and J.M.C.S.; methodology, R.B.V., F.M.S., R.M.M., C.M.S., V.D., M.V.R., S.M.V. and J.M.C.S.; software, R.B.V., F.M.S. and R.M.M.; validation, C.M.S., V.D., M.V.R., S.M.V. and J.M.C.S.; formal analysis, C.M.S., S.M.V. and J.M.C.S.; resources, S.M.V., and J.M.C.S.; data curation, R.B.V., F.M.S. and R.M.M.; writing—original draft preparation, all authors; writing—review and editing, C.M.S., V.D., M.V.R., S.M.V. and J.M.C.S.; supervision, S.M.V. and J.M.C.S.; project administration, S.M.V.; funding acquisition, C.M.S., V.D., M.V.R. and S.M.V. All authors have read and agreed to the published version of the manuscript.
Funding
This work was supported by the Portuguese Foundation for Science Technology, FCT, through IDMEC, under LAETA, by the FCT project AI4Life DSAIPA/DS/0054/2019, and by the FCT PhD scholarships 2022.14216.BDANA, 2022.12077.BDANA and MPP2030-FCT ID 22405888735. No potential competing interests are reported by the authors.
Institutional Review Board Statement
Ethical review and approval were waived for this study due to anonymisation of data.
Informed Consent Statement
Patient consent was waived due to anonymisation.
Data Availability Statement
Data is available for researchers under the conditions defined by the Directorate-General for Health, “Direção Geral de Saúde” (DGS), Portugal.
Conflicts of Interest
No potential competing interests are reported by the authors.
References
- Centers for Disease Control and Prevention: Ten Great Public Health Achievements—Worldwide, 2001–2010. May 2011. Available online: https://pubmed.ncbi.nlm.nih.gov/21697806/ (accessed on 5 July 2022).
- Wang, H.; Abbas, K.M.; Abbasifard, M.; Abbasi-Kangevari, M.; Abbastabar, H.; Abd-Allah, F.; Abdelalim, A.; Abolhassani, H.; Abreu, L.G.; Abrigo, M.R.; et al. Global age-sex-specific fertility, mortality, healthy life expectancy (HALE), and population estimates in 204 countries and territories, 1950–2019: A comprehensive demographic analysis for the Global Burden of Disease Study 2019. Lancet 2020, 396, 1160–1203. [Google Scholar] [CrossRef] [PubMed]
- Kancherla, V.; Roos, N.; Walani, S.R. Relationship between achieving Sustainable Development Goals and promoting optimal care and prevention of birth defects globally. Birth Defects Res. 2022, 114, 773–784. [Google Scholar] [CrossRef] [PubMed]
- Saheed, R.; Hina, H.; Shahid, M. Water, Sanitation and Malnutrition in Pakistan: Challenge for Sustainable Development. Glob. Econ. Rev. 2021, 6, 1–14. [Google Scholar] [CrossRef]
- Raghupathi, V.; Raghupathi, W. The influence of education on health: An empirical assessment of OECD countries for the period 1995–2015. Arch. Public Health 2020, 78, 20. [Google Scholar] [CrossRef] [PubMed]
- Lee, H.Y.; Leslie, H.H.; Oh, J.; Kim, R.; Kumar, A.; Subramanian, S.V.; Kruk, M.E. The association between institutional delivery and neonatal mortality based on the quality of maternal and newborn health system in India. Sci. Rep. 2022, 12, 6220. [Google Scholar] [CrossRef] [PubMed]
- Mitiku, H.D. Neonatal mortality and associated factors in Ethiopia: A cross-sectional population-based study. BMC Women’s Health 2021, 21, 156. [Google Scholar] [CrossRef] [PubMed]
- Tekelab, T.; Chojenta, C.; Smith, R.; Loxton, D. The impact of antenatal care on neonatal mortality in sub-Saharan Africa: A systematic review and meta-analysis. PLoS ONE 2019, 14, e0222566. [Google Scholar] [CrossRef]
- Christian, P.; Mullany, L.C.; Hurley, K.M.; Katz, J.; Black, R.E. Nutrition and maternal, neonatal, and child health. In Seminars in Perinatology; WB Saunders: Philadelphia, PA, USA, 2015; pp. 361–372. [Google Scholar]
- Setyadi, S.; Syaifudin, R.; Desmawan, D. Human Capital and Productivity: A Case Study of East Java. Econ. Dev. Anal. J. 2020, 9, 202–207. [Google Scholar] [CrossRef]
- Gupta, R.; Pal, S.K. Trend Analysis and Forecasting of COVID-19 outbreak in India. MedRxiv 2020. [Google Scholar] [CrossRef]
- Büyükşahin, Ü.Ç.; Ertekin, Ş. Improving forecasting accuracy of time series data using a new ARIMA-NARX hybrid method and empirical mode decomposition. Neurocomputing 2019, 361, 151–163. [Google Scholar] [CrossRef]
- Padilla, C.; Lalloué, B.; Pies, C.; Lucas, E.; Zmirou-Navier, D.; Séverine, D. An ecological study to identify census blocks supporting a higher burden of disease: Infant mortality in the lille metropolitan area, France. Matern. Child Health J. 2014, 18, 171–179. [Google Scholar] [PubMed]
- Malladi, R.K.; Dheeriya, P.L. Time series analysis of cryptocurrency returns and volatilities. J. Econ. Financ. 2021, 45, 75–94. [Google Scholar] [CrossRef]
- Kumar, J.; Singh, A.K. Performance assessment of time series forecasting models for cloud datacenter networks’ workload prediction. Wirel. Pers. Commun. 2021, 116, 1949–1969. [Google Scholar] [CrossRef]
- Gu, Q.; Dai, Q. A novel active multi-source transfer learning algorithm for time series forecasting. Appl. Intell. 2021, 51, 1326–1350. [Google Scholar] [CrossRef]
- Hewamalage, H.; Ackermann, K.; Bergmeir, C. Forecast evaluation for data scientists: Common pitfalls and best practices. Data Min. Knowl. Discov. 2023, 37, 788–832. [Google Scholar] [PubMed]
- Salis, V.E.; Kumari, A.; Singh, A. Prediction of gold stock market using hybrid approach. In Emerging Research in Electronics, Computer Science and Technology; Springer: Berlin/Heidelberg, Germany, 2019; pp. 803–812. [Google Scholar]
- ul Sami, I.; Junejo, K.N. Predicting future gold rates using machine learning approach. Int. J. Adv. Comput. Sci. Appl. 2017, 8, 92–99. [Google Scholar]
- Letzgus, S. Towards transparent NARX wind turbine power curve models. arXiv 2022, arXiv:2210.12104. [Google Scholar]
- Molnar, C.; Casalicchio, G.; Bischl, B. Interpretable machine learning–a brief history, state-of-the-art and challenges. In Proceedings of the ECML PKDD 2020 Workshops: Workshops of the European Conference on Machine Learning and Knowledge Discovery in Databases (ECML PKDD 2020): SoGood 2020, PDFL 2020, MLCS 2020, NFMCP 2020, DINA 2020, EDML 2020, XKDD 2020 and INRA 2020, Ghent, Belgium, 14–18 September 2020; Springer International Publishing: Cham, Switzerland, 2021; pp. 417–431. [Google Scholar]
- Vellido, A. The importance of interpretability and visualization in machine learning for applications in medicine and health care. Neural Comput. Appl. 2020, 32, 18069–18083. [Google Scholar] [CrossRef]
- Mencar, C.; Alonso, J.M. Paving the way to explainable artificial intelligence with fuzzy modeling: Tutorial. In Proceedings of the Fuzzy Logic and Applications: 12th International Workshop, WILF 2018, Genoa, Italy, 6–7 September 2018; Revised Selected Papers. Springer International Publishing: Berlin/Heidelberg, Germany, 2019; pp. 215–227. [Google Scholar]
- Magdalena, L. Fuzzy Systems Interpretability: What, Why and How. In Fuzzy Approaches for Soft Computing and Approximate Reasoning: Theories and Applications: Dedicated to Bernadette Bouchon-Meunier. 2021. pp. 111–122. Available online: https://link.springer.com/chapter/10.1007/978-3-030-54341-9_10 (accessed on 1 June 2022).
- Shabelnikov, A.N.; Kovalev, S.M.; Sukhanov, A.V. Interpretability of fuzzy temporal models. In Proceedings of the Third International Scientific Conference “Intelligent Information Technologies for Industry”(IITI’18); Springer International Publishing: New York, NY, USA, 2019; Volume 13, pp. 223–234. [Google Scholar]
- Xie, R.; Wang, S. A wide interpretable Gaussian Takagi–Sugeno–Kang fuzzy classifier and its incremental learning. Knowl.-Based Syst. 2022, 241, 108203. [Google Scholar] [CrossRef]
Disclaimer/Publisher’s Note: The statements, opinions and data contained in all publications are solely those of the individual author(s) and contributor(s) and not of MDPI and/or the editor(s). MDPI and/or the editor(s) disclaim responsibility for any injury to people or property resulting from any ideas, methods, instructions or products referred to in the content. |
© 2023 by the authors. Licensee MDPI, Basel, Switzerland. This article is an open access article distributed under the terms and conditions of the Creative Commons Attribution (CC BY) license (https://creativecommons.org/licenses/by/4.0/).

