Abstract
The main objective of this study is to simultaneously evaluate the surface and existing layers of composite pavement using PMS data and GPR equipment. The distribution of dielectric constants according to the existing concrete conditions and the relationship between dielectric constants and surface distress was evaluated. As a result, the dielectric constant distribution of the existing concrete showed a significant difference depending on the AAR. In addition, the correlation between surface distress and the dielectric constants of the existing layers was low.
1. Introduction
The total length of aged cement concrete pavement has continued to increase in Korea. As a way to extend the life of aged concrete pavement, an asphalt overlay is generally applied. However, if the existing pavement is in poor condition or the overlay design is inadequate, it can lead to various types of damage, such as reflective cracks, potholes, and efflorescence [1,2].
The Pavement Management System (PMS) includes data collection through Automated Pavement Condition Survey (APCS) equipment and analyzing the surface distress, International Roughness Index (IRI), and rut depth. For bridge decks with an asphalt overlay on Korean expressways, condition assessments through dielectric constants have progressed considerably [3,4]. In contrast, composite pavement is typically evaluated based solely on the surface layer’s condition, and a standardized approach to maintenance is applied, which involves the use of uniform materials and thicknesses. Therefore, it is necessary to evaluate the surface layer and the existing layer in composite pavement simultaneously by using PMS data and Ground Penetrating Radar (GPR) equipment.
In this study, a case study was conducted on the correlation between surface distress and dielectric constants and the distribution of dielectric constants according to the existing concrete conditions in the pilot composite pavement section.
2. Pavement Assessment Method
2.1. Survey Equipments and Sections
The surface layer and existing pavement were evaluated concurrently using both APCS equipment and an air-coupled GPR system. PMS data (pavement image, IRI, rut depth, etc.) were collected through APCS equipment. The air-coupled GPR system includes four-channel 1 GHz air-coupled antennas with transmitter/receiver electronics (horn antenna type), a GPR control unit, a pulse encoder, and the distance measuring instrument. This GPR system was used to acquire the dielectric constant data of the existing layer.
All survey sections are currently in service, and an asphalt overlay was applied on existing concrete pavement. The Alkali-Aggregate Reaction (AAR) occurred in the existing concrete layer of Sections 1 and 2, but was not observed in Section 3 (as shown in Table 1).

Table 1.
Survey sections.
2.2. Assessment Procedure
In the assessment procedure, GPR data and PMS data (especially pavement surface images) were acquired and matched first. For analyzing and visualizing GPR data, the commercial software RADAN® [5] and Surfer® [6] were used. Additionally, surface distress was analyzed from pavement images by using image analysis software. After data analysis, the distribution of dielectric constants according to the existing concrete conditions and the relationship between dielectric constants and surface distress was evaluated.
3. Result and Discussion
3.1. GPR Survey
Figure 1 shows the dielectric constants obtained from GPS data analysis for each survey section. Generally, the dielectric constant of concrete ranges from 5 to 10 [7].

Figure 1.
Condition maps of existing concrete obtained from air-coupled GPR measurements: (a) Section 1; (b) Section 2; (c) Section 3; (d) dielectric constants scale bar.
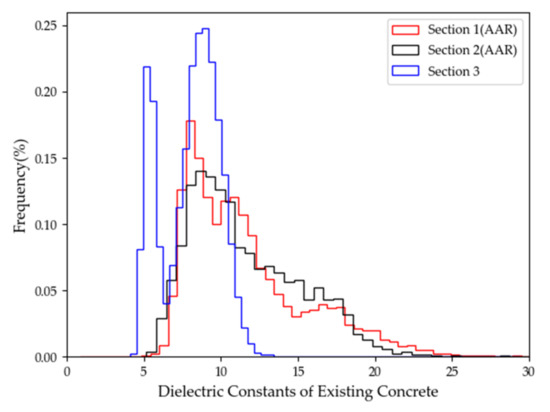
The average dielectric constants of existing pavements were 11.67 and 11.59 in Sections 1 and 2, respectively, which were very similar, and in the case of Section 3, it was 8.04, which was lower than those in Sections 1 and 2. The large dielectric constants values in Sections 1 and 2 may be due to the alkali-silicate gel caused by the AAR and the resulting concrete deformation [8]. The suspected deterioration area (with dielectric constants less than 5 and more than 10) in Sections 1 and 2 exceeds 50%, but in Section 3, it was very low at 2.6%.
Figure 2 shows a comparison of the distribution of dielectric constants from the surveyed sections. Sections 1 and 2 (AAR) show similar patterns and are evenly distributed in the direction of high dielectric constants. On the other hand, the dielectric constant distribution in Section 3 is concentrated in the range of about 4 to 13.

Figure 2.
Distribution of dielectric constants of existing concrete pavement.
3.2. Surface Distress
Table 2 shows the results of a surface distress analysis for each section, and in the case of efflorescence, the number of observed locations is shown. Figure 3 provides an example of the surface distress analysis for a 10 m unit section. Efflorescence was found in both Sections 1 and 2, where the AAR occurred in the existing layer, but there was a large difference in the total cracks (%). In other words, the amount of distress to the surface layer may occur differently even with the same material, traffic volume, and environmental load. In the surface distress figures, the blue, purple, red line, and brown rectangle represent longitudinal cracks, transverse cracks, patching, and construction joints, respectively, and the values indicate the amount of distress (length or area). For a more accurate evaluation, it is judged that laboratory experiments through the coring are necessary. In the case of Section 3, the pavement condition was very good.

Table 2.
The result of a surface distress analysis.

Figure 3.
Comparison of surface distress and existing concrete layer conditions: (a) Section 1 (104~114 m); (b) Section 2 (100~110 m).
3.3. Correlation Surface Distress and Dielectric Constants
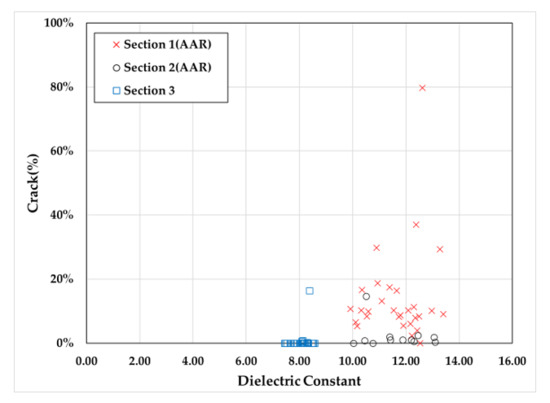
Figure 3 shows the result of comparing the surface distress with the condition of the existing layer. In the case of Figure 3a, a wide range of patching and efflorescence occurred in the surface layer, and the dielectric constants of the existing layer were high. However, as shown in Figure 3b, the dielectric constants were high even in the section with little surface distress. In addition, as shown in Figure 4, as a result of comparing the dielectric constant of the existing layer and the total cracks (%) of the surface layer, it was found that the correlation between the two variables was low.

Figure 4.
Comparison of the dielectric constant and the total cracks (%).
4. Conclusions
This investigation revealed a significant difference in the dielectric constant distribution of existing concrete depending on the presence of the AAR. Sections 1 and 2 (AAR) had wider dielectric constant distributions than Section 3, indicating possible deterioration in the existing concrete layer. In addition, the correlation between surface distress and the dielectric constants of the existing layer was low, so it was difficult to estimate the condition of the existing layer only by the surface condition. Therefore, it is necessary to introduce an investigation system capable of simultaneously considering the surface and existing layers in order to evaluate the performance of the composite pavement.
Author Contributions
Conceptualization, C.-K.J. and J.-H.L.; methodology, J.-H.L.; validation, Y.-M.Y. and B.-S.K.; formal analysis, Y.-M.Y.; investigation, T.-S.K., Y.-M.Y. and B.-S.K.; data curation, B.-S.K.; writing—original draft preparation, T.-S.K.; writing—review and editing, J.-H.L.; visualization, T.-S.K.; supervision, J.-H.L.; project administration, J.-H.L.; funding acquisition, C.-K.J. All authors have read and agreed to the published version of the manuscript.
Funding
This research received no external funding.
Institutional Review Board Statement
Not applicable.
Informed Consent Statement
Not applicable.
Data Availability Statement
Not applicable.
Conflicts of Interest
The authors declare no conflict of interest.
References
- Kim, Y.K.; Lee, S.W. Performance evaluation of bonded concrete overlay. Constr. Build. Mater. 2013, 49, 464–470. [Google Scholar] [CrossRef]
- Suh, Y.C.; Lee, E.J. Development of distress progress model for determining the appropriate time for overlaying durability cracks in concrete pavement. KSCE J. Civ. Eng. 2022, 26, 1773–1781. [Google Scholar] [CrossRef]
- Rhee, J.-Y.; Park, K.-E.; Lee, K.-H.; Kee, S.-H. A Practical Approach to Condition Assessment of Asphalt-Covered Concrete Bridge Decks on Korean Expressways by Dielectric Constant Measurements Using Air-Coupled GPR. Sensors 2020, 20, 2497. [Google Scholar] [CrossRef] [PubMed]
- Rhee, J.-Y.; Choi, J.-J.; Kee, S.-H. Evaluation of the depth of deteriorations in concrete bridge decks with asphalt overlays using air-coupled GPR: A case study from a pilot bridge on Korean expressway. Int. J. Concr. Struct. Mater. 2019, 13, 23. [Google Scholar] [CrossRef]
- Geophysical Survey Systems, Inc. (GSSI). RADAN 7 Manual; GSSI: Nashua, NH, USA, 2020; Available online: http://www.geophysical.com (accessed on 27 February 2023).
- Golden Software, LLC. Available online: https://www.goldensoftware.com (accessed on 27 February 2023).
- ASTM D6432-19; Standard Guide for Using the Surface Ground Penetrating Radar Method for Subsurface Investigation. ASTM International: West Conshohocken, PA, USA, 2020.
- Heifetz, A.; Strow, M.; Liu, Y.; Bevington, P.; Zapol, P.; Bakhtiari, S.; Bentivegna, A. Monitoring of dielectric permittivity in accelerated alkali-silica reaction concrete with microwave backscattering. Mater. Struct. 2020, 53, 130. [Google Scholar] [CrossRef]
Disclaimer/Publisher’s Note: The statements, opinions and data contained in all publications are solely those of the individual author(s) and contributor(s) and not of MDPI and/or the editor(s). MDPI and/or the editor(s) disclaim responsibility for any injury to people or property resulting from any ideas, methods, instructions or products referred to in the content. |
© 2023 by the authors. Licensee MDPI, Basel, Switzerland. This article is an open access article distributed under the terms and conditions of the Creative Commons Attribution (CC BY) license (https://creativecommons.org/licenses/by/4.0/).