Proceeding Paper

Study on Traffic Incident Management Boundary Based on Gis and Its Historical Travel Time Data †

Department of Transportation Systems Engineering, Korea National University of Transportation, 157 Cheoldobangmulkwan-ro, Uiwang 16106, Republic of Korea
*
Author to whom correspondence should be addressed.
Presented at the Second International Conference on Maintenance and Rehabilitation of Constructed Infrastructure Facilities, Honolulu, HI, USA, 16–19 August 2023.
Eng. Proc. 2023, 36(1), 22; https://doi.org/10.3390/engproc2023036022
Published: 4 July 2023

Abstract

:
This study proposes a method to determine a spatial boundary of traffic operation and management techniques in strategic schemes against sudden traffic incidents based on historical data in the Seoul metropolitan area. Through the combination of data analysis and a geographical information system, it was found that there were general tendencies after the occurrence of an incident pertaining to its significance and how long the effects of incidents last. We classified the properties of accidents based on their duration and the space left available within the relevant road lane. This study found that the longer the incident’s duration, the greater the effect of the traffic incident. When the number of available lanes was one, the impact of the traffic accident was greater. In the case of two or more available lanes, the spatial boundary tended to be identical, while changes in travel speed were affected by incident type.

1. Introduction and Objectives

Traffic incidents can be classified into two types: predictable and unpredictable. To reduce the likelihood of such incidents, construction sites’ specific traffic management strategies and tactics can be prepared in advance. In the case of an unpredictable accident, the development of relevant traffic management measures would be difficult and delayed by the amount of time needed to detect the accident. To deal with such unexpected incidents, traffic management schemes should be established based on the time–space boundary of their effects. A potential approach would be (1) dispersion of traffic influx in that space boundary to reduce the inbound traffic and (2) additional capacity to increase the throughput of the outbound traffic. Previous studies have suggested utilizing traffic information provision techniques, such as variable message signs (VMS), car navigation systems (CNSs), and lane control systems (LCSs). Although it has always been necessary in order to prepare a strategy to deal with traffic congestion expanding over time, no guideline has been made available to determine the time–space boundary of unexpected traffic accidents.
This study intends to analyze the historical changing trends of the time–space boundary of urban highway networks affected by such traffic incidents that have occurred in Seoul’s metropolitan areas. When specific patterns of accidents’ time–space boundaries exist, and such patterns can be explained by certain factors of traffic accidents, understanding these patterns would be fundamental to the development of future traffic management strategies.

2. Data Collection and Analysis

2.1. Materials and Methods
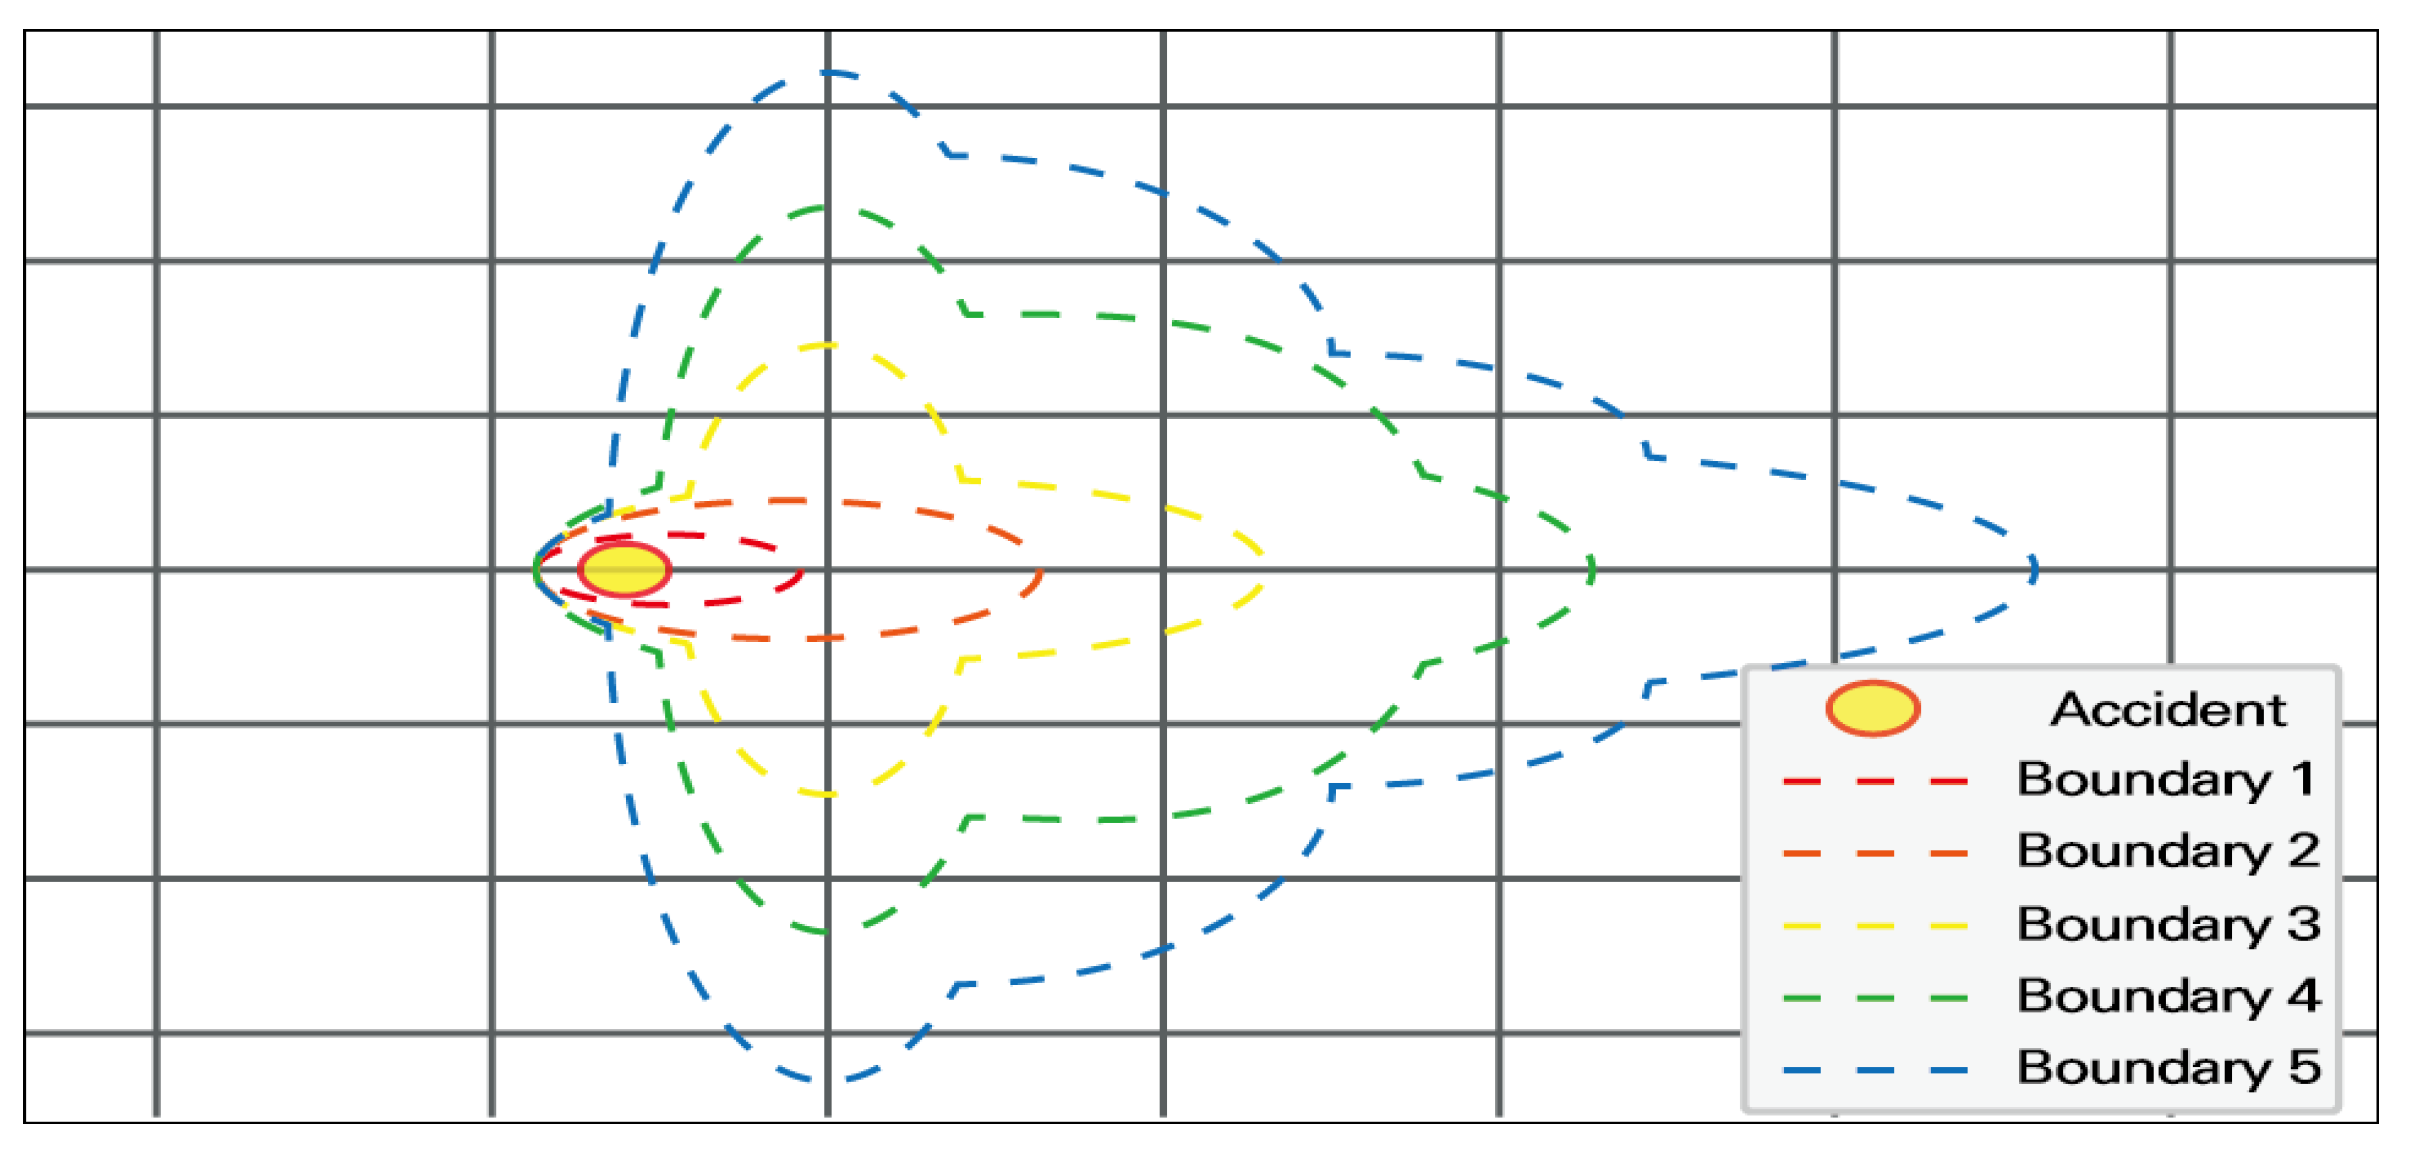
This study employed the historical travel speed data, which were obtained through ‘OpenAPI’ from the Seoul transportation operation and information service center (TOPIS). The travel speed data were collected every 5 min for each of 5358 urban highway links for a duration of 2 months (1 March 2020–30 April 2022). The total number of collected data items was 94,129,344. The collected TOPIS data were refined based on the Korean national standard node-link scheme.
During that time period, it was officially reported that a total of 2281 traffic accidents occurred. To analyze the influence of traffic accidents based on the data, we attempted to set a boundary for the traffic accidents. The size of the boundary was defined to count from one to up to five upstream links, where the traffic accident occurred (see Figure 1).
The traffic accidents were classified by the number of available lanes and the duration of the accident in order to analyze the impact of a traffic accident. The number of available lanes was classified into one lane, two lanes, and more than three lanes by calculating the number of lanes of the accident link and the number of lanes controlled due to the occurrence of a traffic accident (see Figure 2). In the case of the duration of the accident, the analysis was performed by classifying the time taken from the occurrence of a traffic accident to the end time, into 30 min or less, 30 min to 1 h, and over 1 h.
To analyze the change in cruising speed according to the occurrence of a traffic accident, the speed up to 40 min after the occurrence of a traffic accident was analyzed every 5 min. The boundary of a traffic accident’s impact was extracted from the 5-min-interval-based analysis of percent speed changes. Table 1, Table 2 and Table 3 show average speed decrease every 5 min in each case. The minus sign represents the percentage of speed decrease, and the plus represents the percentage of speed increase.

2.2. Results

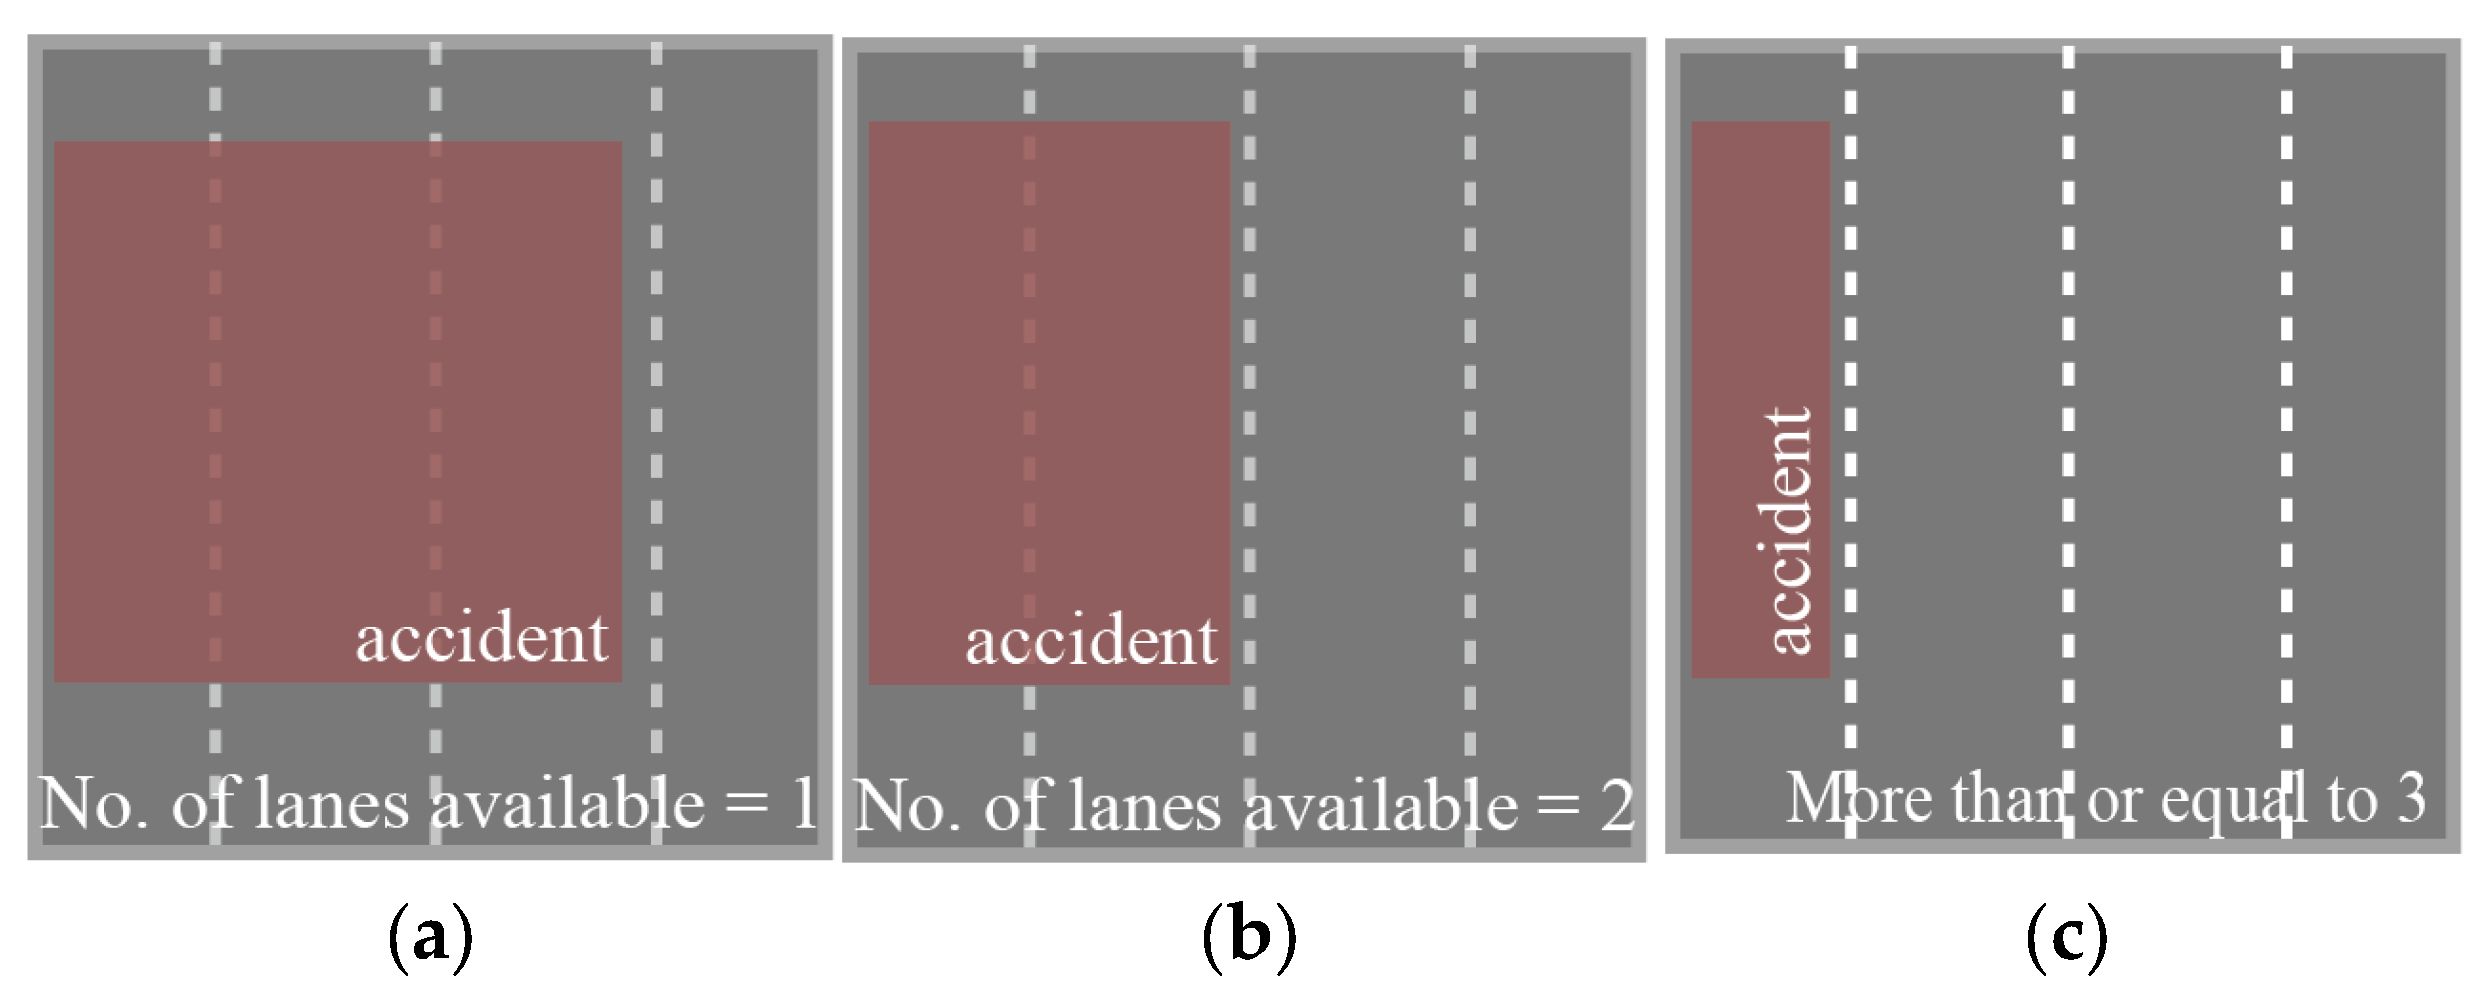
2.2.1. CASE 1 (Number of Available Lanes Is One)

The results show that the incident management boundary differed for each incident case. When incident duration was over 60 min, the time–space boundary lasted until 15–20 min after the accident. It was found that there was an effect on up to three upstream intersections in the spatial range (See Table 1).

2.2.2. CASE 2 (Number of Available Lanes Is Two)

When the number of available lanes was two, it was found that the change in traffic flow was less affected than when only one lane was available. The time–space boundary lasted until 10–15 min after the accident. It was found that there was an effect on up to two upstream intersections in the spatial range (See Table 2).

2.2.3. CASE 3 (Number of Available Lanes Is More than Three)

When the number of available lanes was more than three, it was found that the traffic flow was affected up to 5 min and then recovered. Traffic flow was affected at the intersection where the accident occurred or one upstream intersection in the spatial range (See Table 3).

3. Conclusions

This study has identified changes in traffic flow conditions due to accidents, based on actual accident and traffic flow data, to determine a boundary of traffic management measures for accidents on urban roads. To analyze traffic flow condition changes caused by accidents, traffic accident information and traffic flow information were collected and analyzed, and the boundary of traffic management measures was presented according to the type of accident. The types of accidents were classified based on their duration (less than 30 min, 30–60 min, and over 60 min) and the space left available (by the number of lanes available: one, two, and more than three).
It was determined that the longer the duration of the accident, the greater its impact. The impact was also greater when the number of available lanes was one. In the case of two and three available lanes, it was found that the speed reduction rate due to an accident was higher if the number of available lanes was two, but there was no significant difference in the management boundary. When developing a traffic control plan in accordance with these suggestions, in the event of a traffic accident in the future, the boundary of management measures should vary by accident type, but in line with the results of this analysis, it is suggested to set the boundary of management (1) up to 15 min in time, and (2) up to three upstream intersections in space.

Author Contributions

Conceptualization, J.-T.K. and D.H.K.; methodology, J.-T.K.; software, D.H.K.; validation, J.-T.K. and D.H.K.; formal analysis, J.-T.K.; investigation, D.H.K.; resources, D.H.K.; supervision, J.-T.K.; project administration; J.-T.K. All authors have read and agreed to the published version of the manuscript.

Funding

This work was supported by a Korea Institute of Police Technology (KIPoT) grant funded by the Korea government (KNPA) (No.092021C29S02000, Development of on-site control technology for road traffic network control in the event of an incident or disaster).

Institutional Review Board Statement

Not applicable.

Informed Consent Statement

Not applicable.

Data Availability Statement

Not applicable.

Conflicts of Interest

The authors declare no conflict of interest.
Figure 1. Expected boundary of network area affected by incident.
Engproc 36 00022 g001
Figure 2. (a) Available number of lanes is one; (b) available number of lanes is two; (c) available number of lanes is three.
Engproc 36 00022 g002
Table 1. Percentage of speed decrease after accident occurrence in Case 1.
Incident
Duration (min)
BoundaryTime Period (min) after Accident Occurrence
0~55~1010~1515~2020~2525~3030~3535~40
>301−9.4%1.6%0.7%12.0%2.2%8.8%0.8%1.8%
2−3.6%−1.6%3.9%2.2%5.1%5.4%5.4%1.6%
3−2.1%3.1%1.0%1.7%2.8%6.2%2.2%7.5%
4−1.3%1.1%3.8%2.4%2.5%4.7%2.7%3.9%
5−3.7%3.1%3.4%3.6%2.8%6.1%6.2%4.7%
30~601−10.2%0.5%1.4%−1.1%1.6%5.9%1.5%7.1%
2−14.9%4.1%2.2%5.8%14.8%1.5%1.8%7.4%
3−6.4%7.1%0.1%3.2%0.3%8.3%3.9%3.1%
4−2.7%0.9%3.3%6.4%2.2%2.7%3.3%4.6%
5−2.7%3.7%3.2%2.6%3.8%3.1%2.4%3.8%
60 ≤1−18.6%−0.2%−4.1%−3.8%14.8%46.8%2.0%25.2%
2−7.5%6.3%−5.9%0.9%9.5%3.0%2.0%3.6%
3−6.5%1.0%7.2%−1.5%1.7%5.2%8.0%3.0%
4−5.7%3.6%4.7%5.0%3.0%0.2%5.7%−0.1%
5−4.9%2.9%1.9%7.4%1.3%2.4%5.3%4.5%
Table 2. Percent speed decrease after accident occurrence in Case 2.
Incident
Duration (min)
BoundaryTime Period (min) after Accident Occurrence
0~55~1010~1515~2020~2525~3030~3535~40
>301−9.6%3.0%3.5%4.7%1.8%5.9%−0.3%3.1%
2−8.6%3.9%2.9%7.2%3.3%6.8%8.1%2.7%
3−1.7%2.4%3.4%4.5%2.6%1.3%5.3%5.5%
4−2.5%2.4%3.0%4.5%3.7%2.9%6.1%2.3%
5−3.9%3.1%4.4%3.5%2.4%3.4%3.1%2.8%
30~601−13.0%2.3%12.1%2.1%1.1%4.9%0.1%7.5%
2−6.7%4.1%−1.0%5.1%1.7%8.9%4.9%4.8%
3−3.2%1.9%3.4%2.0%2.3%2.1%2.3%3.9%
4−3.5%3.1%4.8%1.9%3.0%3.3%3.9%2.9%
5−2.2%3.2%2.2%3.5%3.0%3.3%2.8%2.7%
60 ≤1−17.3%−1.1%−5.4%4.8%1.5%2.6%1.2%2.0%
2−8.0%−2.9%0.6%3.0%7.3%0.2%1.4%−0.3%
3−2.1%1.5%1.7%2.1%3.8%8.1%2.1%1.0%
4−3.8%2.3%4.4%3.1%3.7%2.2%2.8%2.2%
5−2.6%1.7%2.9%2.5%2.6%3.2%2.9%3.6%
Table 3. Percent speed decrease after accident occurrence in Case 3.
Incident
Duration (min)
BoundaryTime Period (min) after Accident Occurrence
0~55~1010~1515~2020~2525~3030~3535~40
>301−6.4%2.4%3.3%5.5%3.4%8.0%4.8%4.2%
2−6.4%2.5%0.7%5.6%4.5%6.0%5.1%2.1%
3−3.8%1.7%2.8%2.8%3.9%3.6%4.2%4.9%
4−2.7%2.8%1.2%3.3%2.7%3.2%3.4%4.2%
5−1.9%2.8%2.1%2.4%2.6%3.1%2.2%3.7%
30~601−9.5%−0.6%1.3%1.4%2.5%4.9%2.0%5.7%
2−5.9%−0.5%8.6%−0.4%5.1%5.6%1.5%2.7%
3−1.3%−0.6%1.5%2.8%3.8%3.2%3.4%4.3%
4−3.3%2.1%2.9%1.4%3.3%1.7%2.7%2.4%
5−2.2%2.0%2.2%3.0%2.2%3.8%2.9%1.5%
60 ≤1−12.9%3.5%−2.6%5.4%1.4%6.8%2.8%5.6%
2−8.0%4.2%−0.3%12.5%3.8%4.6%2.4%3.7%
3−6.8%1.0%3.6%2.6%0.8%2.4%−0.1%2.3%
4−1.8%2.6%7.3%1.8%1.5%1.8%2.8%2.3%
5−2.9%2.9%1.8%5.3%1.8%3.4%3.4%3.0%
Disclaimer/Publisher’s Note: The statements, opinions and data contained in all publications are solely those of the individual author(s) and contributor(s) and not of MDPI and/or the editor(s). MDPI and/or the editor(s) disclaim responsibility for any injury to people or property resulting from any ideas, methods, instructions or products referred to in the content.

