1. Introduction
Motion forecasting is a vital component in the pipeline of an autonomous vehicle. It involves predicting the future motion of other vehicles, pedestrians, bicycles, and other objects in the environment in which the autonomous vehicle is operating. This information is crucial for the vehicle to make safe and efficient decisions, such as determining when to change lanes, slow down, or stop. Without accurate motion forecasting, the autonomous vehicle may make unsafe decisions or fail to respond in a timely manner to the actions of other road users. Moreover, forecasting is necessary and currently used for the creation of realistic simulations to test and validate the performance of autonomous vehicles before hitting the road, as well as essential for the development of cooperative systems, where multiple agents, both autonomous and human-driven, share the road. It allows the autonomous vehicle to anticipate the actions of other road users and plan its own motion accordingly, ensuring safe and efficient interactions.
In autonomous driving, it is essential to understand each driving situation in order to anticipate the trajectories of other agents. In each driving scenario, agents will react differently depending on traffic conditions and road structure. By knowing the behaviour of an agent a certain number of seconds in advance, it is possible to anticipate decisions, increasing safety and comfort for subsequent manoeuvrers. Usually, agents will tend to take trajectories that are ideal for their goal, avoiding collisions and being socially accepted, i.e., following traffic rules and interacting with other agents on the road.
The problem of pedestrian trajectory prediction has been broadly explored by the community in the past years, being generally classified into two categories according to the type of analysis: pedestrians in crowded areas, where there may be erratic movements due to low speed and avoidance of potential collisions, and environments shared with vehicles and other agents, where the traffic density is reduced but inter-class interaction is incorporated. This work, summarized as shown in
Figure 1, continues the evolution of the previous one [
1], essentially inspired by the initial research developed on pedestrians [
2].
2. Related Work
In the early stages of trajectory prediction, classical approaches relied essentially on linear regression, Bayesian filtering or Markov decision process. These methods performed properly, but since they are based on physical variables, their scaling and generalization are quite limited. After the arrival of deep learning, and specifically RNNs and LSTMs, it was found that they could successfully model the relationships between agents, exploiting their time dependency to predict future vehicle manoeuvrers [
3,
4] and trajectories [
5]. In this context of social approaches, S-LSTM [
6] was proposed, connecting neighbouring LSTMs using a social pooling layer, predicting trajectories for multiple pedestrians. A similar approach was presented in [
7] for vehicles. This was refined by SR-LSTM, making use of a message passing framework to enhance social nature [
8]. Some models also propose an occupancy grid to define the interaction between agents [
9,
10]. Other authors have followed the line of generating a set of acceptable trajectories using architectures such as GAN [
11,
12] and CVAE [
13]. In GAN, the generator and discriminator are used in a complementary way to improve the generation and detection of valid trajectories, while CVAE is used to encode in a latent space and generate multi-path trajectories based on the observed paths.
Using the Vanilla-TF as a model, the context-augmented Transformer network [
14] uses interaction and semantic information as the input to provide robust prediction on datasets with strong pedestrian–vehicle interactions, similar to the inD dataset.
In parallel to these deep learning-based approaches, OSP [
15] proposes a traditional probabilistic approach, developing a pedestrian–vehicle interaction model that outperforms models such as S-GAN and MATF with real-time execution speed that is really convenient.
Although LSTMs seem to be a good model for learning trajectory sequences, they are inefficient at modelling data in long temporal sequences, and thus suffer more from the lack of input data in observations, a very common issue in real systems involving physical sensors. In this way, Transformer models [
16] have been successfully adapted to predict pedestrian trajectories in crowded spaces [
2], achieving state-of-the-art results in TrajNet benchmark [
17], by relying only on self positional information (i.e., without adding any social or interactive data). Moving beyond pedestrians, this paper will focus on vehicle trajectories, whose interaction is rather intense in the environments analysed (intersections and roundabouts).
Recent work has explored including the road graph, history and interaction between agents using more sophisticated models and a bespoke architecture for each type of input [
18]. Whereas, others have employed images and detections of mixed traffic environments to provide an explainable nature to their model, developing an important analysis concerning this issue [
19].
In this work, a Transformer model is used in its simplest form, exploiting its nature to adapt the inputs and improve the results without major changes in the architecture that could lead to greater complexity in its training and use, exploring its capabilities with augmented input data such as velocity and orientation, analysing its performance on vehicles in various datasets, and performing cross tests to assess its generalization capability.
3. Methodology
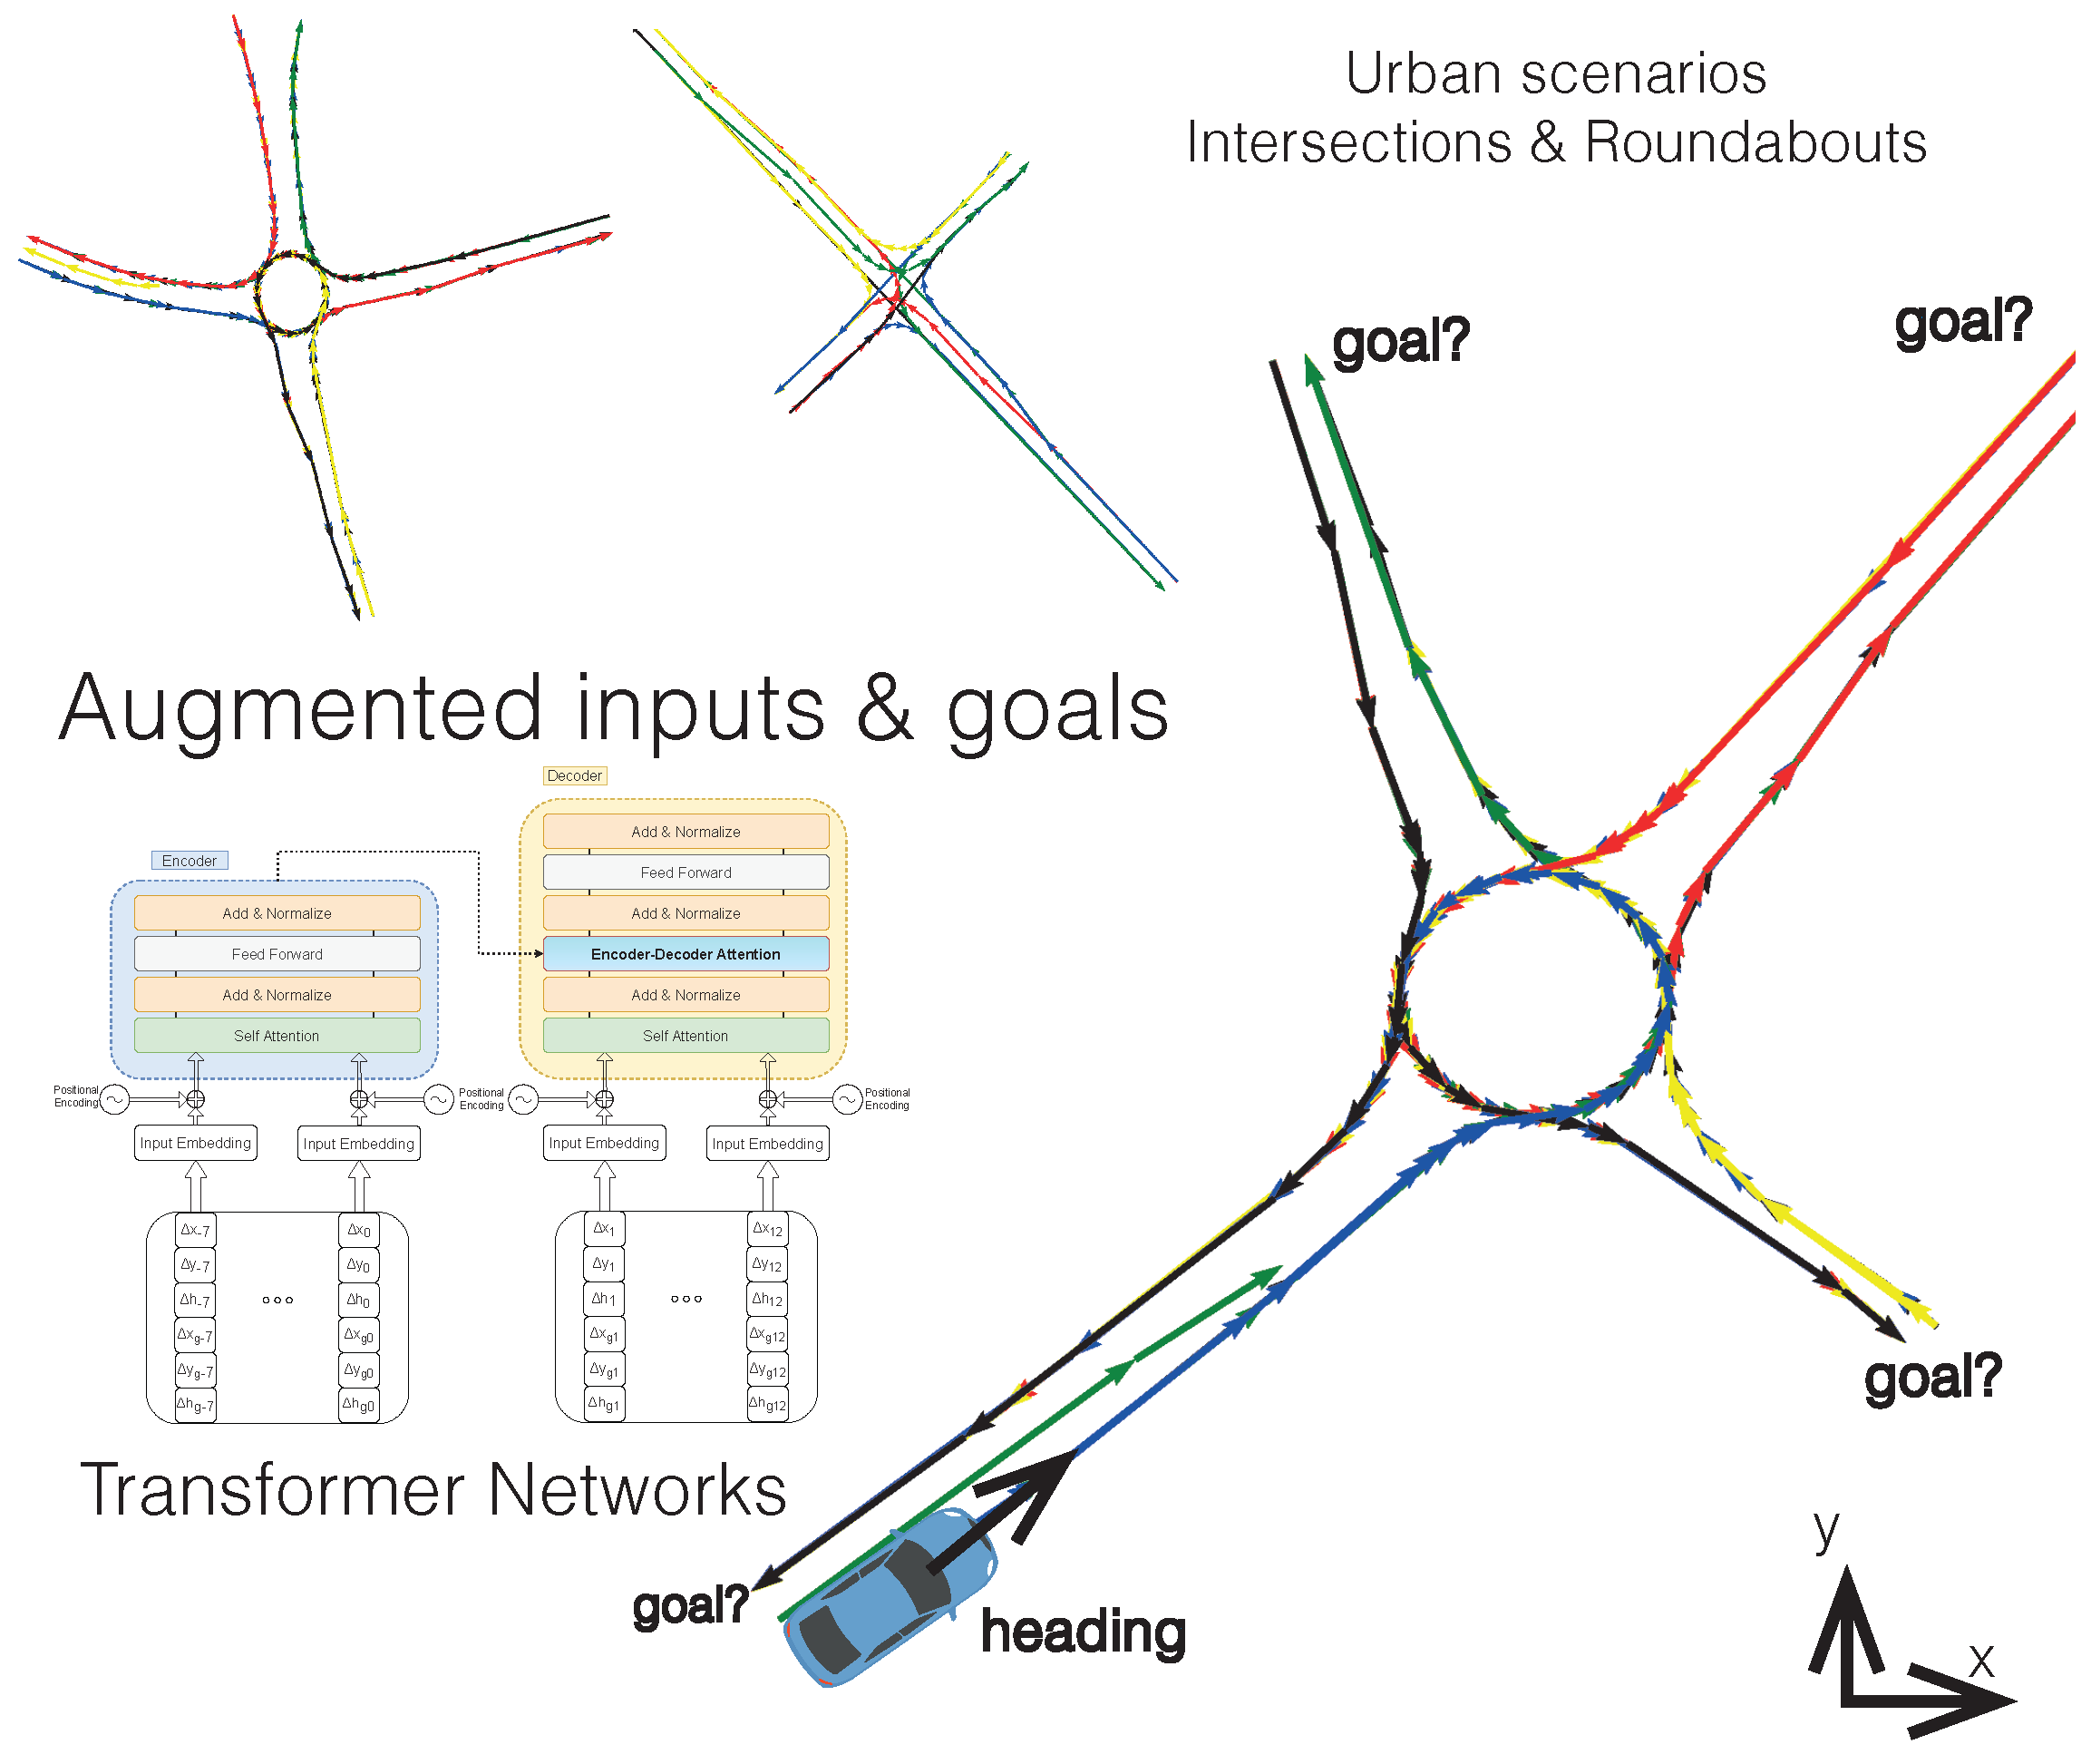
This section addresses the methodology used to deploy the model, starting with the selection of the input and output data, the preprocessing and analysis of the input data for the BEV datasets used in the study, and the creation of the enhanced model, analysing the different transformations made to adopt the new information. In addition, the use of context information through data provided by the digital maps present in each scenario will be covered, using the lanelet2 library to compute positions with respect to lanes, off-road zones and routes to goals, among others. The approach of the “post hoc” multimodality paradigm using the potential goals for each agent in the scenario is fully discussed at the end of this section.
3.1. Introducing the Problem
Let be the state of the vehicle at time t, where is the position, is the velocity, and is the acceleration. Let be the set of environmental conditions at time t. The goal of trajectory prediction is to estimate the future trajectory given the observations up to time t and a prediction horizon N.
3.2. Inputs and Outputs
In our work, these inputs are the velocity (position increments) and the heading increment of the agent under study itself, in combination with the same information with respect to the possible goal it may have in the testing scenario. Thus, , and . Currently, there are several benchmarks that consider different time horizons, both for visualization and prediction. TrajNet was followed in the previous work: a benchmark in which datasets are measured at 2.5 Hz, observing 8 frames (3.2 s) and predicting 12 frames (4.8).
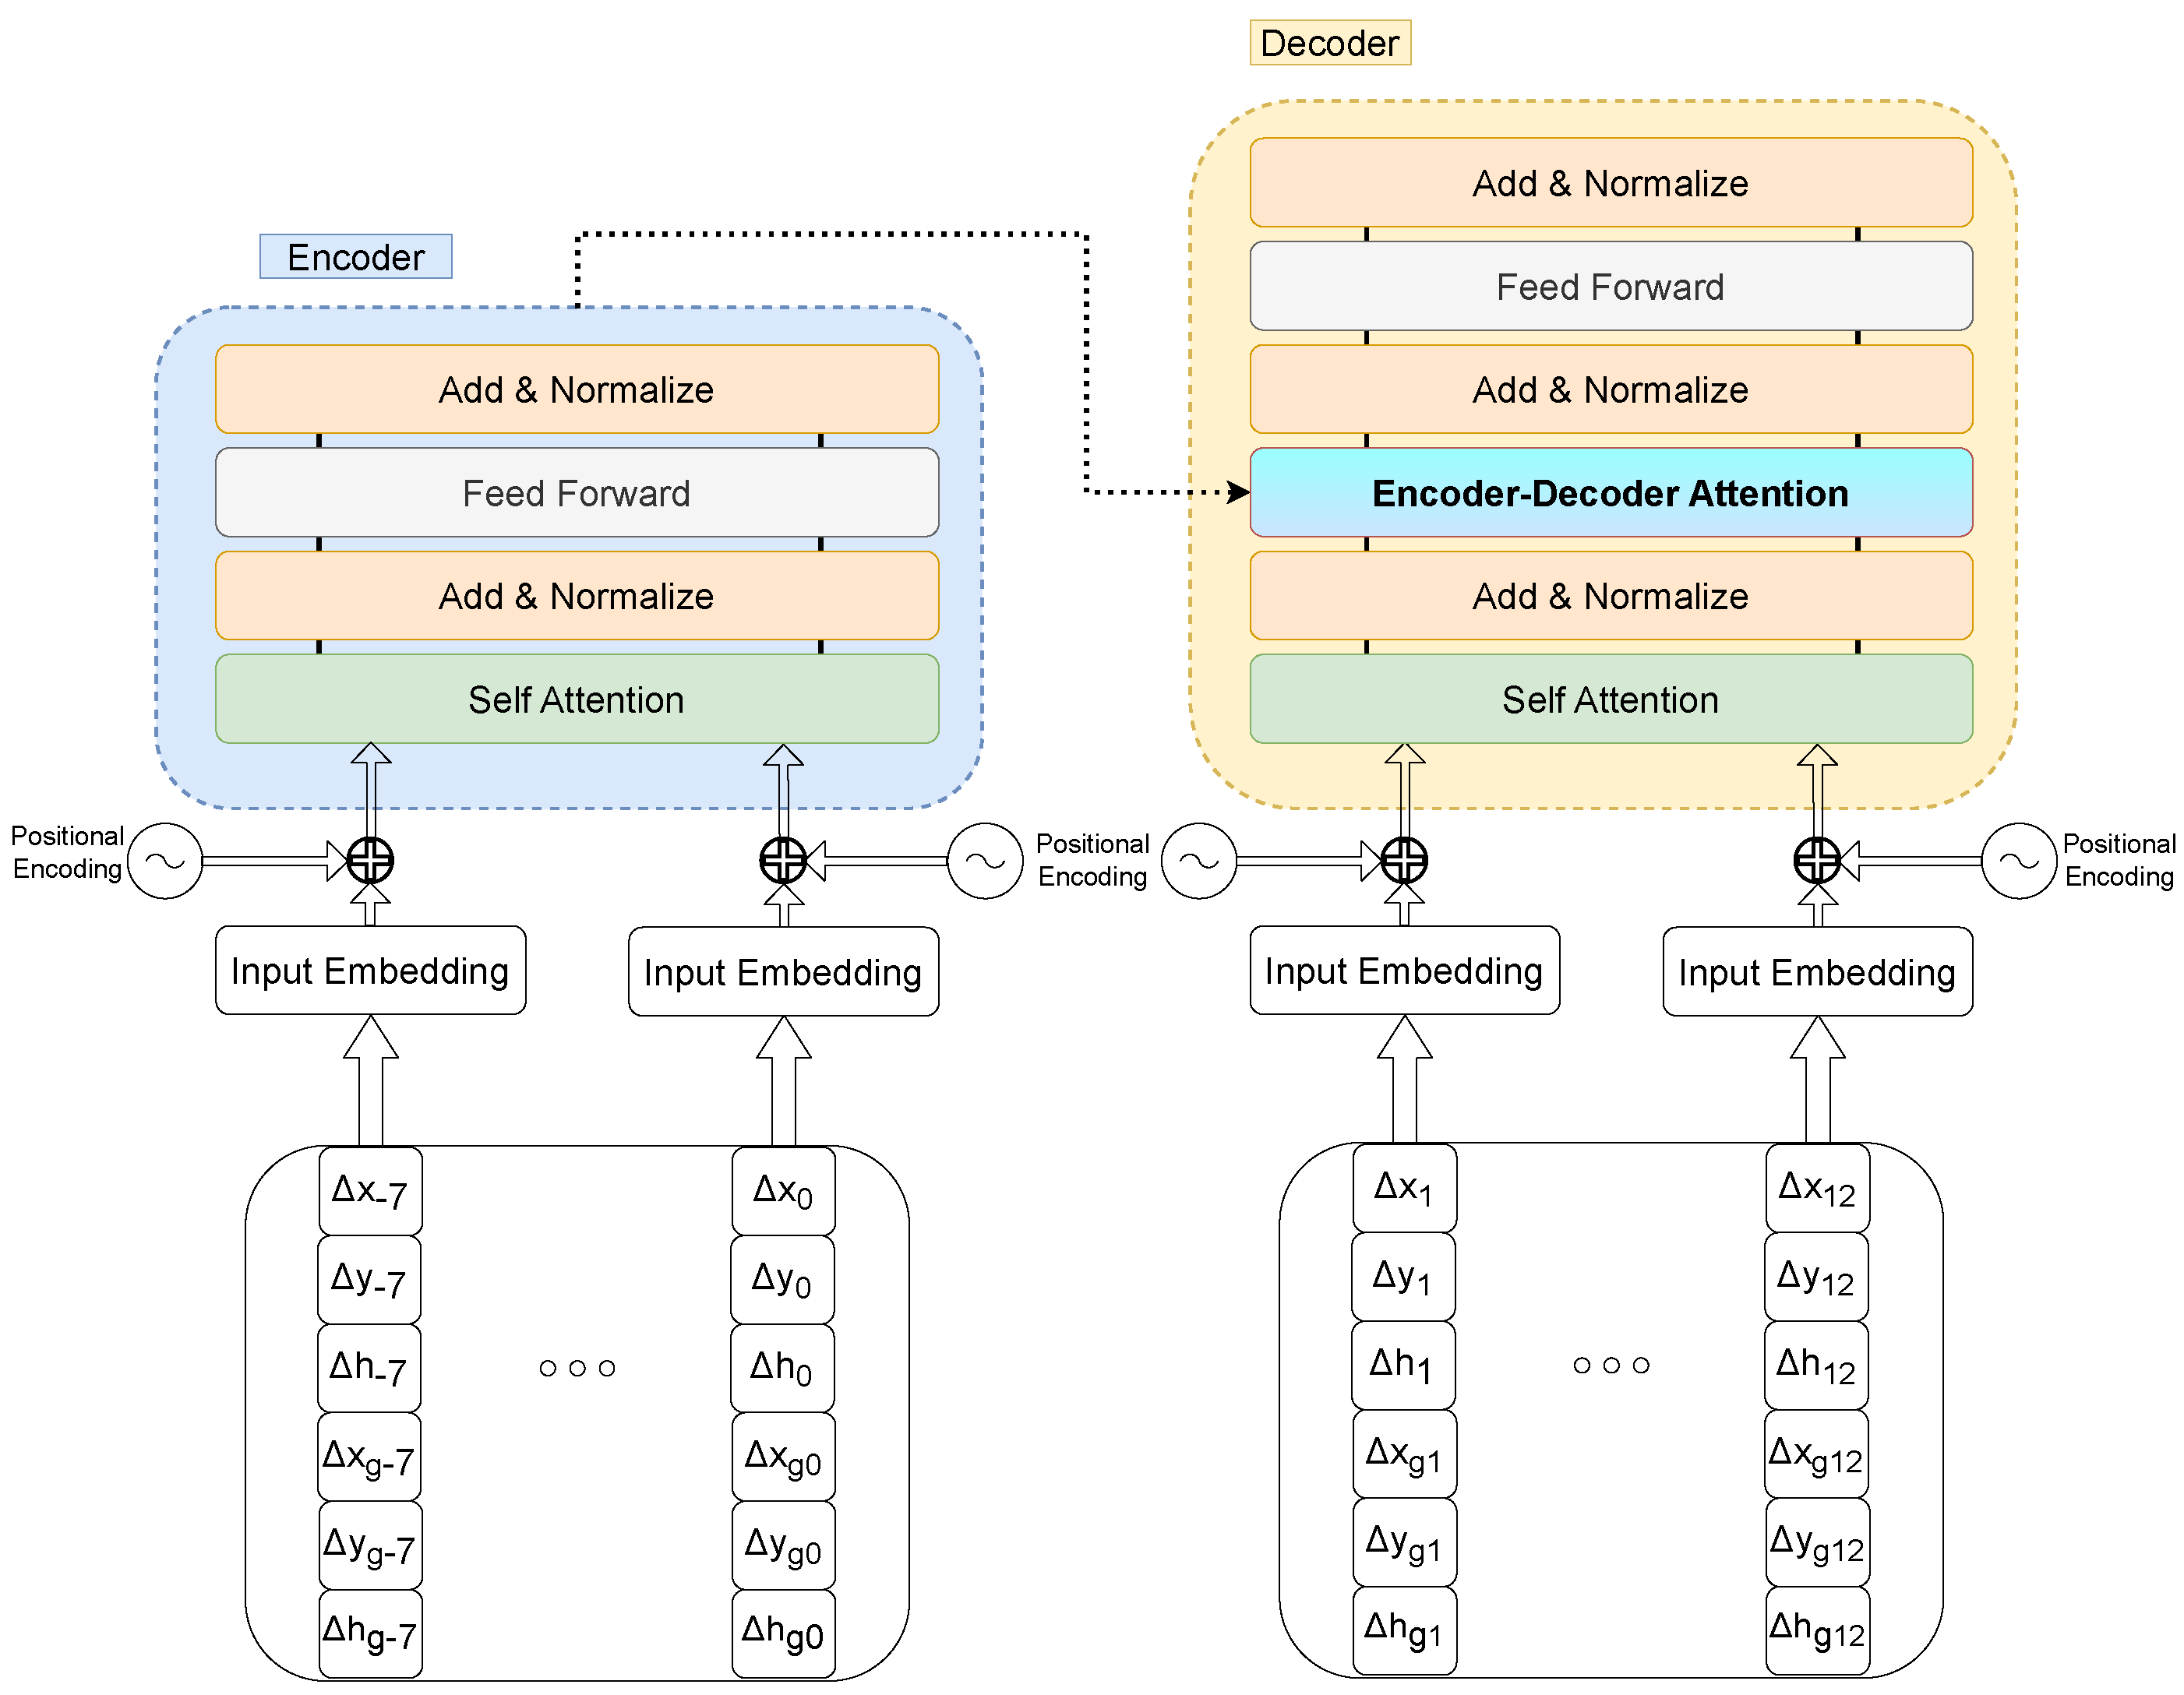
It is important to highlight the importance of working with increments of positions and headings, rather than directly with the absolute data. Previous tests showed that the model failed to learn with this approach, yielding a sub-par performance on the datasets under analysis. This can show the nature of the data being used, allowing minor variations in velocity that make it easier to predict a more constant output, aside from data filtering with Kalman-derived filters, which will tend to follow the preceding frame velocity. Thus, comparatively, we have also considered the input of the heading increment in degrees in absolute form, without any previous adaptation that could pre-normalize it, since it will be performed in the training and testing process. We think that this pre-normalization developed in 2021 could have affected and worsened the results, as explored in the ongoing experiments. The complete model overview is depicted in
Figure 2.
3.3. Exploring Context Information
After studying the scenarios’ topology for each dataset, and the available data, we considered the option of incorporating contextual data, taking into consideration that the datasets used have digital maps within the lanelet2 library framework, allowing access to context information for each lanelet, such as the distance to the centre of the lane, distance to the nearest curbs, no-go zones for driving in the case of vehicle agents, etc. However, powerful information included in these maps concerns the routing graph, such that knowing the position of an agent permits delimiting the possible routes it can follow in the scenario, according to the traffic rules. The exact knowledge of the map and traffic rules also allows to extend to the social factor, where metrics such as IDM (car-following model [
20]) or RSS [
21] can be computed to analyse possible dangerous situations involving near agents.
3.4. The Architecture
3.4.1. Data Preprocessing
For the datasets used it was necessary to carry out a prior stage of data analysis and extraction in order to properly format them for model input and planned experiments. During this stage, the parked vehicles present in some recordings were removed, and the frame rate was taken into account to adapt it to the desired frame rate for the study, with sequences at 2.5 Hz. Thus, the initial input consists of the structure, to then go through the feature addition module, where the corresponding increments are calculated and the goal information is introduced based on the map. After this process, the input to the model includes and . The heading data are introduced in absolute values between 0 and 360, adapting the entries of each dataset appropriately, whereas the distance to the centre of the lane in the corresponding tests are entered in modulus and SI units.
3.4.2. Details
The architecture from [
1] was maintained, with the addition of an L2 loss that includes position increments for improved independence of each position, as well as normalized heading. The
was set to 512, with 6 layers and 8 attention heads. A warm-up period of 10 epochs was implemented, employing a decaying learning rate in the subsequent epochs.
3.5. Post Hoc Multimodality
To assess the model’s ability to know the intrinsic structure of the scenario without receiving explicit information about it, a “post hoc multimodality” approach was adopted. This consisted of generating five trajectories for each of the goals existing in the test scenario. This was calculated through the routes present in the route graph for each scenario of the inD and rounD datasets.
Table 1 shows the number of routes and goals present in each scenario.
4. Experiments and Results
4.1. Datasets
In addition to pedestrian-centric approaches, the NGSIM datasets [
22,
23] were pioneers in covering highway areas, with information obtained from cameras mounted on a skyscraper. Several multi-agent datasets have been developed over the past few years, with a focus on highway scenarios, such as the highD dataset [
24] for highway vehicle trajectory prediction. This dataset provides aerial images obtained using a drone located over various locations of the German autobahn, with vehicle labelling ensuring an error below 10 cm. The dataset provides a total of 147 h of drive time on over 100,000 vehicles. The authors of this dataset went further and expanded the concept to urban scenarios, with the inD [
25] and rounD [
26] datasets recording different intersections and roundabouts, respectively, as well as the novel exiD [
27], that covers some stretches at mergings. The Interaction dataset [
28] combines all these scenarios, including ramp merging, signalized intersections, and roundabouts. This dataset also provides a diverse range of driving behaviours, including critical manoeuvrers, and even accidents. These situations add value to a trajectory prediction solution and should be evaluated in a qualitative manner.
Table 2 overviews the datasets used to develop the experiments.
Finally, while 2D datasets taken from drones or fixed locations from a bird’s eye view are relatively easy to create and label, the ultimate goal is to train models that can be ported to vehicles equipped with onboard sensors and tested in datasets such as NuScenes [
29], Argoverse [
30] or Prevention [
3].
4.2. Goal Analysis
Goal evaluation for each dataset was carried out automatically on the routes contained in the digital map graphs for each scenario. The training was carried out with the real target, and then tests were performed for each of the scenario targets, generating five trajectories for each one and choosing the ones with the lowest error. This approach brings variability to the results and a “post hoc multimodality” method similar to that conducted in other published research, differing in that in this case we are sampling directly in the tests with the possible targets present in each map rather than using a distribution for each mode.
4.3. Evaluation Metrics
The metrics employed are the state-of-the-art standards for the datasets considered here, average displacement error (ADE) and final displacement error (FDE). The ADE/MAD calculates the difference in the L2 norm between the 12 points of the predicted trajectory and compares them with the respective ground truth in metres, while the FDE/FAD only accounts for the last observation of this prediction. Thus, the ADE indicates a general fit of the predicted and actual trajectories. This can be questionable, as the predicted trajectories cannot deviate too far from the actual trajectory but enter prohibited zones for the corresponding agent, leading to situations where the predictions for vehicles end up entering pedestrian pavements. Due to this, other metrics are considered in this work, such as the off-road rate or miss-rate, that will be explored in future tests with the datasets that embody them. The experiments performed in this case (i.e., for quantitative analysis) have been deployed with the real goal corresponding to each agent, while the complete analysis of the “post hoc multimodality” is reserved for the qualitative analysis. Implementing typical metrics, such as min-ADE, are more commonly used in other datasets than the ones involved in our work.
4.4. inD: Comparative Results
Using the same data split used by the authors of the DCENet to make an objective comparison, we obtained comparative analysis results for the inD dataset, as shown in the
Table 3. These results include all agent types, not just vehicles, meaning the goal approach is less effective than splits that include vehicles only, as discussed later. This dataset includes parts of the test scenarios in the training split, so the model is already familiar regarding the trajectories that agents can perform, which, when combined with the fact that pedestrians are also being evaluated, reduces global errors. The Goal-TF model still outperforms the “typical” architectures, S-LSTM and S-GAN, and improves the results of their homonymous TFs which include less information; however, the model still underperforms against AMENet and DCENet. However, we can appreciate that the inclusion of the target has been positive, reducing the FAD by more than 20 cm with respect to the Oriented-TF. In the following experiments the set of tested agents will be reduced to vehicles (cars, trucks, vans, trails, buses, etc.).
4.5. Testing in Different Datasets
4.5.1. Single Dataset Tests
This section reports the results of the leave-one-out (LOO) technique for the inD, rounD and Interaction datasets for their intersection and roundabout variants, compared with the Vanilla and Oriented models, where the heading is introduced as additional information. As shown in
Table 4, the Goal-TF model is better in all cases than the other models, except in the Interaction-GL scenario, where the Oriented model stands out. The improvements are substantial, with a difference greater than 4 m in the FDE in some experiments. The inclusion of the target is considered beneficial in terms of the additional information that the network is able to learn and understand for trajectory prediction.
4.5.2. Mixing Datasets: Similar Scenarios of Different Datasets
In the case of cross-dataset generalization, it seems that the choice of method when introducing additional information may penalize the Goal model, with the Vanilla model remaining the best option if transfer learning between datasets becomes the preferred method, as shown in the
Table 5.
4.6. Qualitative Results
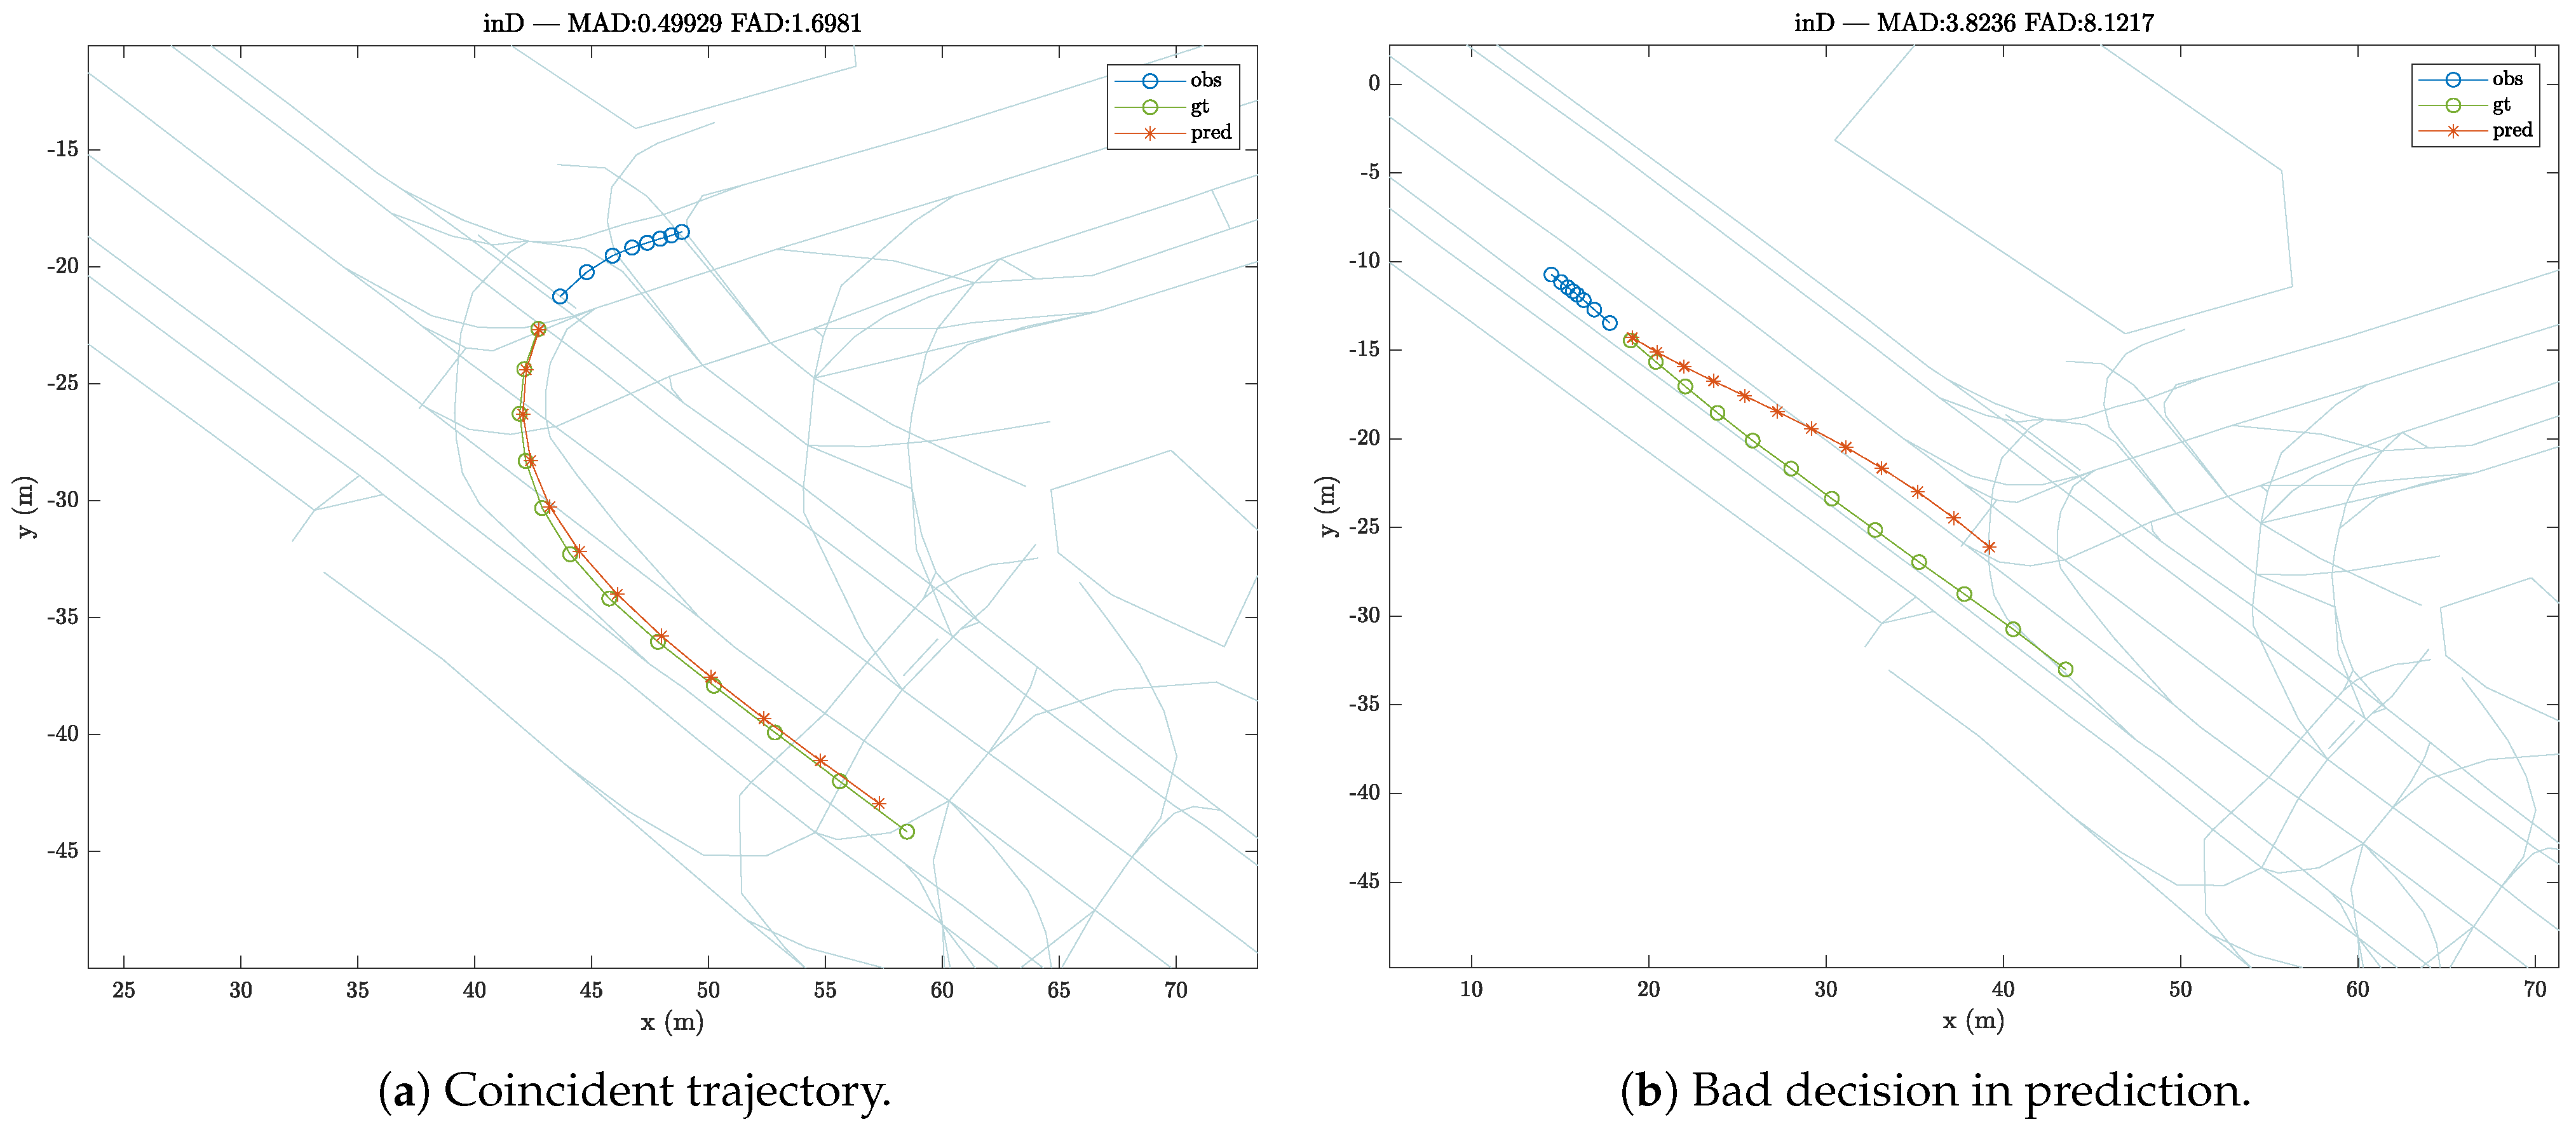
Apart from the quantitative results measured by the corresponding metrics, it is necessary to assess thoroughly how an agent actually behaves in practice when a specific situation occurs in a particular scenario; for example, at an intersection with different exits.
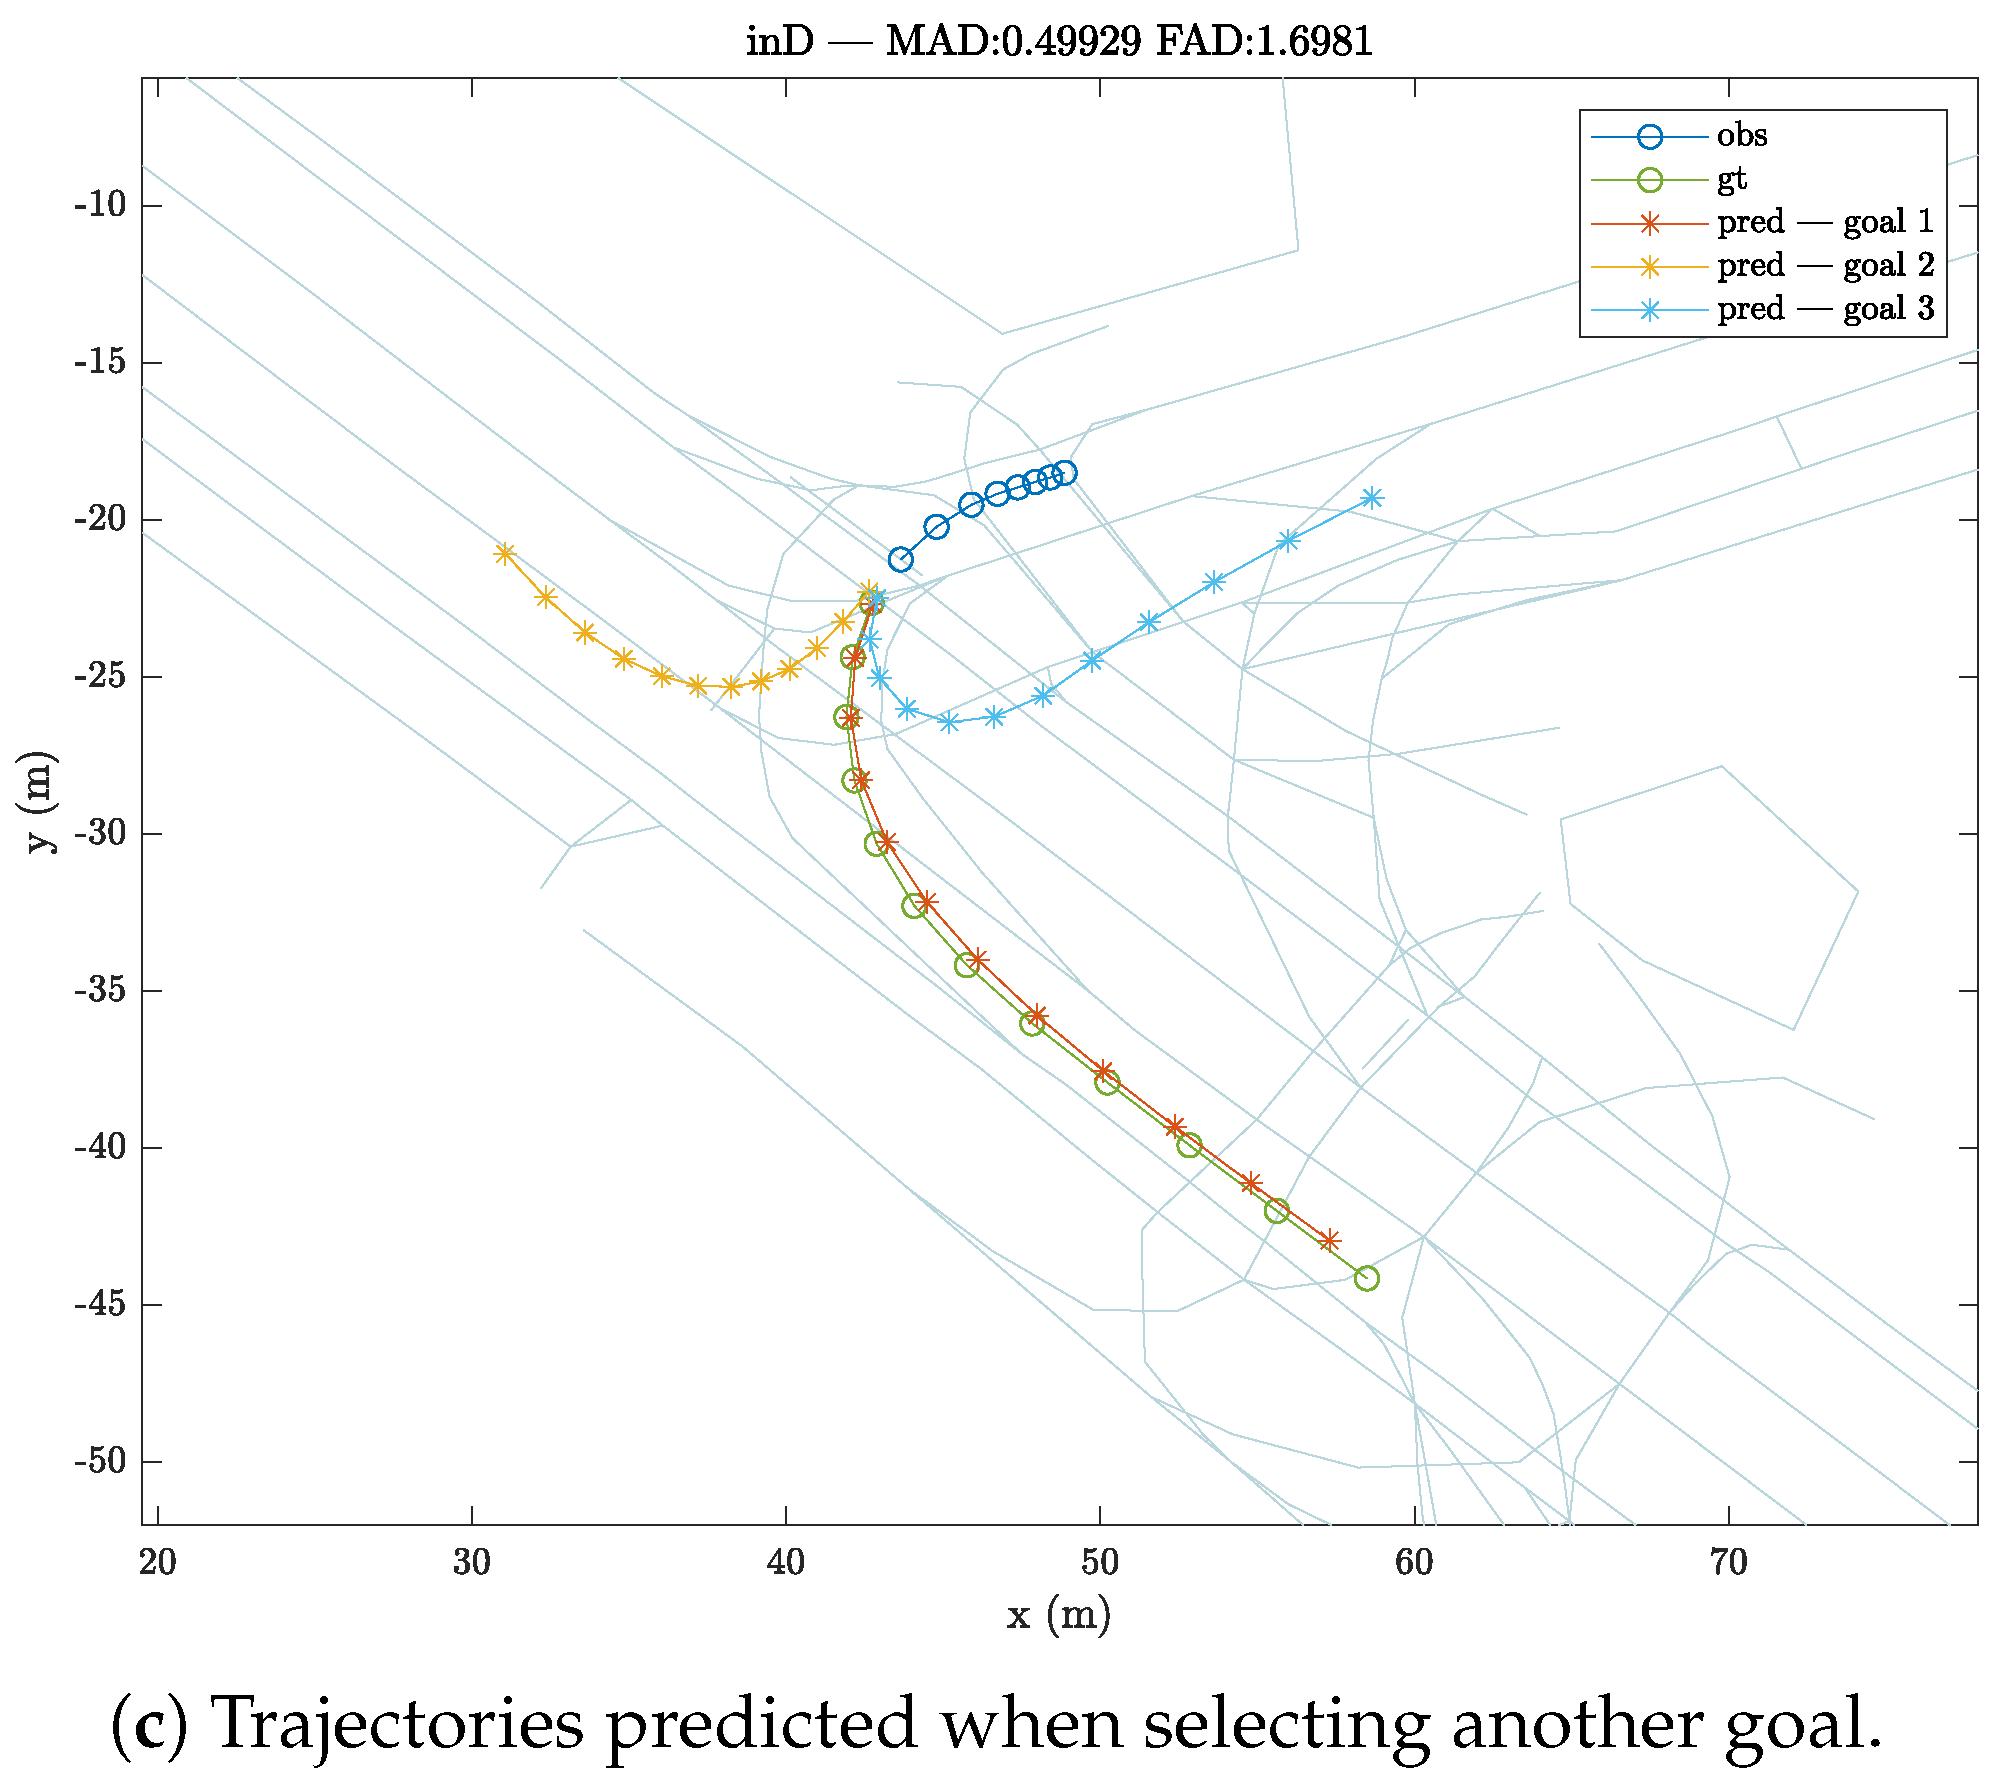
Figure 3 shows an instance prior to a turn where the vehicle has slowed down when approaching the intersection. Thus, it can be seen how the prediction can yield various results depending on the target in question. In one case, the vehicle will continue straight ahead, while in another the prediction outputs the vehicle turning in one way or the other. However, at other times the model will also be completely wrong, leading to completely erroneous predictions, such as when the vehicle is meant to continue straight ahead and the prediction is a turning prediction, or vice versa.
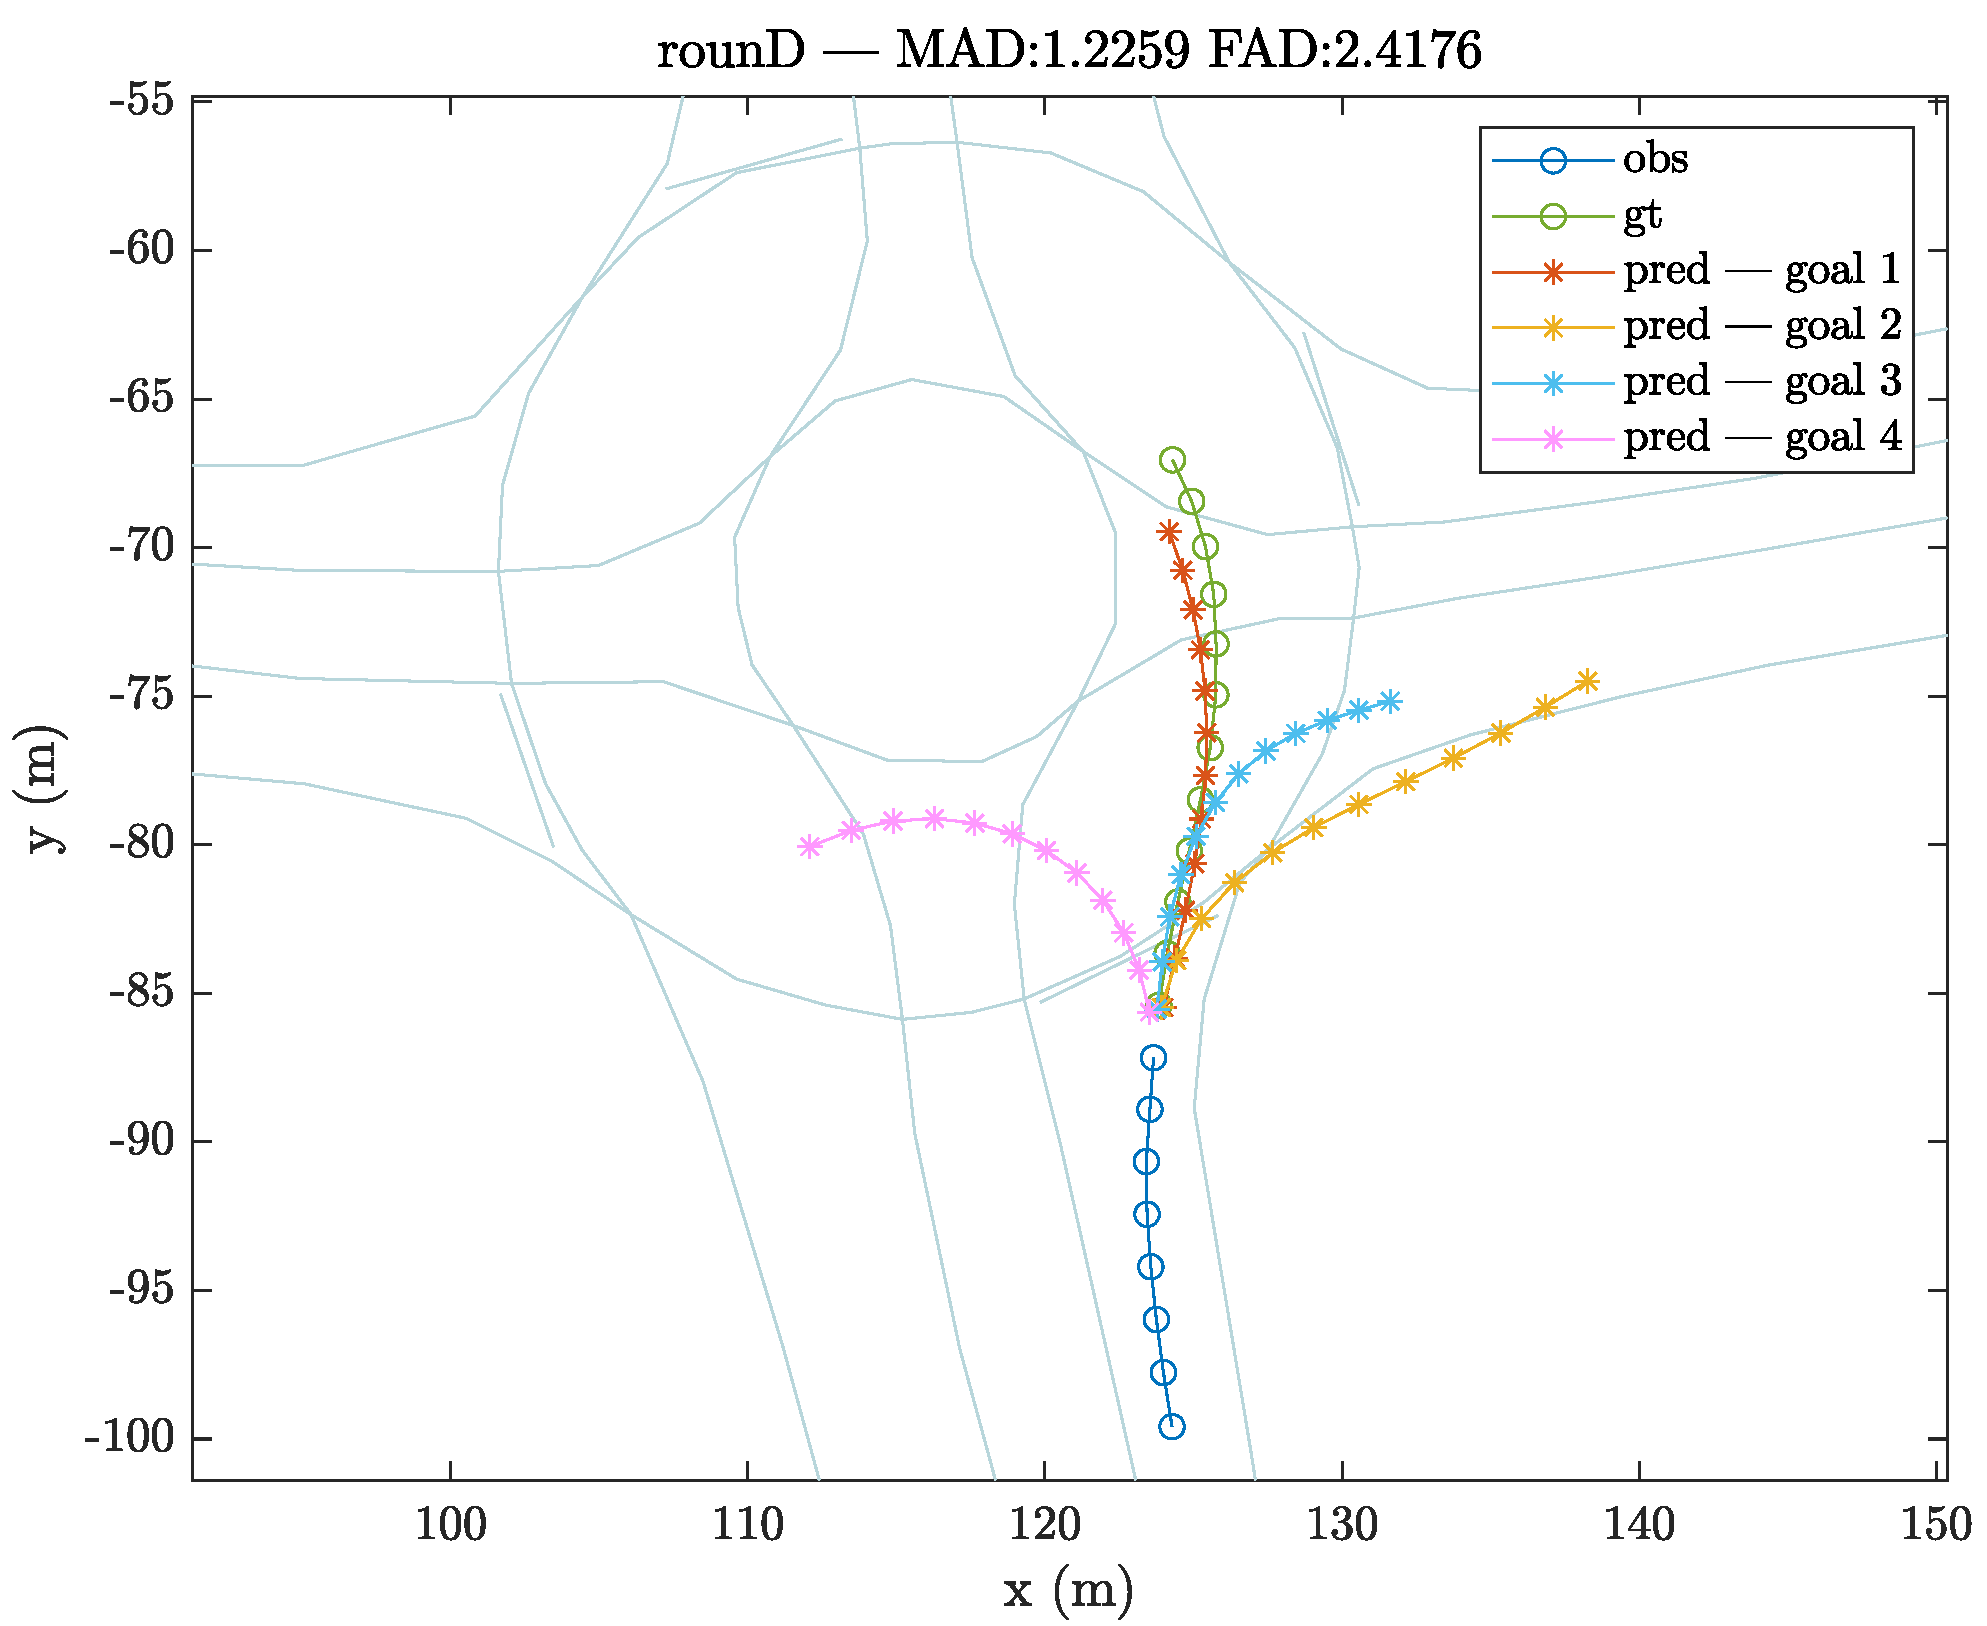
Figure 4 briefly shows multiple trajectories generated at the approach of a roundabout according to the selected goal, including the option of a complete turn to change direction.
5. Conclusions and Future Work
The experiments performed showed that the inclusion of context variables relative to the goal obtained from the digital map routes linked to each scenario improved the results compared to models that did not use them. This allowed for multimodal trajectory generation, an important point that should be developed in future work. The generalization of this model was also discussed, with tests on different datasets highlighting its high versatility. In future, the challenge to integrate social information needs to be addressed, exploring a way to introduce simultaneous data from several agents to allow for the generation of socially aware trajectories. Furthermore, tasks such as the extension of multimodality tests to all datasets, providing specific metrics, or extending the datasets to other existing datasets in the field, such as NuScenes or Argoverse, is still pending. Finally, a viability study would be beneficial for the implementation of such a system for real-time inference using real-time information collected by an vehicle to demonstrate whether these models are ready to be deployed in the real world.
Author Contributions
Conceptualization, Á.Q., I.P. and D.F.-L.; methodology, Á.Q., I.P. and D.F.-L.; software, Á.Q.; validation, Á.Q. and R.I.; investigation, Á.Q. and R.I.; resources, I.P. and D.F.-L.; writing Á.Q., R.I., I.P. and D.F.-L.; supervision, I.P. and D.F.-L. All authors have read and agreed to the published version of the manuscript.
Funding
This work was funded by Research Grants PRE2018-084256, PID2020-114924RB-I00 and PDC2021-121324-I00 (Spanish Ministry of Science and Innovation) and partially by S2018/EMT-4362 SEGVAUTO 4.0-CM and CM/JIN/2021-005 (Community of Madrid). D.F.-L. acknowledges the funding from the HUMAINT project by the Directorate-General Joint Research Centre of the European Commission.
Data Availability Statement
Datasets were obtained from [
25,
26] and are available at their corresponding websites (with ther permission of their authors).
Conflicts of Interest
The authors declare no conflict of interest. The views expressed in this article are purely those of the authors and may not, under any circumstances, be regarded as an official position of the European Commission.
References
- Quintanar, A.; Fernández-Llorca, D.; Parra, I.; Izquierdo, R.; Sotelo, M.A. Predicting Vehicles Trajectories in Urban Scenarios with Transformer Networks and Augmented Information. In Proceedings of the 2021 IEEE Intelligent Vehicles Symposium (IV), Nagoya, Japan, 11–17 July 2021; pp. 1051–1056. [Google Scholar]
- Giuliari, F.; Hasan, I.; Cristani, M.; Galasso, F. Transformer Networks for Trajectory Forecasting. In Proceedings of the 25th International Conference on Pattern Recognition (ICPR), Milan, Italy, 10–15 January 2021; pp. 10335–10342. [Google Scholar]
- Izquierdo, R.; Quintanar, A.; Parra, I.; Fernández-Llorca, D.; Sotelo, M.A. The PREVENTION dataset: A novel benchmark for PREdiction of VEhicles iNTentIONs. In Proceedings of the 2019 IEEE Intelligent Transportation Systems Conference (ITSC), Auckland, New Zealand, 27–30 October 2019; pp. 3114–3121. [Google Scholar]
- Biparva, M.; Fernández-Llorca, D.; Gonzalo, R.I.; Tsotsos, J.K. Video Action Recognition for Lane-Change Classification and Prediction of Surrounding Vehicles. IEEE Trans. Intell. Veh. 2022, 7, 569–578. [Google Scholar] [CrossRef]
- Izquierdo, R.; Quintanar, A.; Parra, I.; Fernández-Llorca, D.; Sotelo, M.A. Vehicle Trajectory Prediction in Crowded Highway Scenarios Using Bird Eye View Representations and CNNs. In Proceedings of the IEEE 23rd International Conference on Intelligent Transportation Systems (ITSC), Rhodes, Greece, 20–23 September 2020. [Google Scholar]
- Alahi, A.; Goel, K.; Ramanathan, V.; Robicquet, A.; Fei-Fei, L.; Savarese, S. Social LSTM: Human Trajectory Prediction in Crowded Spaces. In Proceedings of the IEEE Conference on Computer Vision and Pattern Recognition (CVPR), Las Vegas, NV, USA, 27–30 June 2016; pp. 961–971. [Google Scholar]
- Deo, N.; Trivedi, M.M. Convolutional Social Pooling for Vehicle Trajectory Prediction. In Proceedings of the IEEE/CVF Conference on Computer Vision and Pattern Recognition Workshops (CVPRW), Salt Lake City, UT, USA, 18–22 June 2018; pp. 1549–15498. [Google Scholar]
- Zhang, P.; Ouyang, W.; Zhang, P.; Xue, J.; Zheng, N. SR-LSTM: State Refinement for LSTM Towards Pedestrian Trajectory Prediction. In Proceedings of the IEEE/CVF Conference on Computer Vision and Pattern Recognition (CVPR), Long Beach, CA, USA, 15–20 June 2019; pp. 12077–12086. [Google Scholar]
- Pfeiffer, M.; Paolo, G.; Sommer, H.; Nieto, J.; Siegwart, R.; Cadena, C. A Data-driven Model for Interaction-Aware Pedestrian Motion Prediction in Object Cluttered Environments. In Proceedings of the IEEE International Conference on Robotics and Automation (ICRA), Brisbane, Australia, 21–25 May 2018; pp. 5921–5928. [Google Scholar]
- Manh, H.; Alaghband, G. Scene-LSTM: A Model for Human Trajectory Prediction. arXiv 2019, arXiv:1808.04018. [Google Scholar]
- Gupta, A.; Johnson, J.; Fei-Fei, L.; Savarese, S.; Alahi, A. Social GAN: Socially Acceptable Trajectories with Generative Adversarial Networks. In Proceedings of the IEEE/CVF Conference on Computer Vision and Pattern Recognition (CVPR), Salt Lake City, UT, USA, 18–23 June 2018; pp. 2255–2264. [Google Scholar]
- Sadeghian, A.; Kosaraju, V.; Sadeghian, A.; Hirose, N.; Rezatofighi, H.; Savarese, S. SoPhie: An Attentive GAN for Predicting Paths Compliant to Social and Physical Constraints. In Proceedings of the IEEE/CVF Conference on Computer Vision and Pattern Recognition (CVPR), Long Beach, CA, USA, 15–20 June 2019; pp. 1349–1358. [Google Scholar]
- Zhao, T.; Xu, Y.; Monfort, M.; Choi, W.; Baker, C.; Zhao, Y.; Wang, Y.; Wu, Y.N. Multi-Agent Tensor Fusion for Contextual Trajectory Prediction. In Proceedings of the IEEE/CVF Conference on Computer Vision and Pattern Recognition (CVPR), Long Beach, CA, USA, 15–20 June 2019; pp. 12118–12126. [Google Scholar]
- Saleh, K. Pedestrian Trajectory Prediction using Context-Augmented Transformer Networks. arXiv 2020, arXiv:2012.01757. [Google Scholar]
- Anderson, C.; Vasudevan, R.; Johnson-Roberson, M. Off The Beaten Sidewalk: Pedestrian Prediction In Shared Spaces For Autonomous Vehicles. IEEE Robot. Autom. Lett. 2020, 5, 6892–6899. [Google Scholar] [CrossRef]
- Vaswani, A.; Shazeer, N.; Parmar, N.; Uszkoreit, J.; Jones, L.; Gomez, A.N.; Łukasz, K.; Polosukhin, I. Attention is all you need. In Proceedings of the Advances in Neural Information Processing Systems, Long Beach, CA, USA, 4–9 December 2017; pp. 5999–6009. [Google Scholar]
- Sadeghian, A.; Kosaraju, V.; Gupta, A.; Savarese, S.; Alahi, A. Trajnet: Towards a benchmark for human trajectory prediction. arXiv 2018. submitted for publication. [Google Scholar]
- Nayakanti, N.; Al-Rfou, R.; Zhou, A.; Goel, K.; Refaat, K.S.; Sapp, B. Wayformer: Motion Forecasting via Simple & Efficient Attention Networks. arXiv 2022, arXiv:2207.05844. [Google Scholar]
- Zhang, Z.; Tian, R.; Sherony, R.; Domeyer, J.; Ding, Z. Attention-Based Interrelation Modeling for Explainable Automated Driving. IEEE Trans. Intell. Veh. 2023, 8, 1564–1573. [Google Scholar] [CrossRef]
- Treiber, M.; Hennecke, A.; Helbing, D. Microscopic Simulation of Congested Traffic. In Traffic and Granular Flow ’99; Springer: Berlin/Heidelberg, Germany, 2000; pp. 365–376. [Google Scholar]
- Shalev-Shwartz, S.; Shammah, S.; Shashua, A. On a Formal Model of Safe and Scalable Self-driving Cars. arXiv 2017, arXiv:1708.06374v6. [Google Scholar]
- Halkias, J.; Colyar, J. NGSIM—Interstate 80 Freeway Dataset. 2006. Available online: https://www.fhwa.dot.gov/publications/research/operations/06137/06137.pdf (accessed on 31 May 2023).
- Colyar, J.; Halkias, J. NGSIM—US Highway 101 Dataset. 2007. Available online: https://www.fhwa.dot.gov/publications/research/operations/07030/07030.pdf (accessed on 31 May 2023).
- Krajewski, R.; Bock, J.; Kloeker, L.; Eckstein, L. The highD Dataset: A Drone Dataset of Naturalistic Vehicle Trajectories on German Highways for Validation of Highly Automated Driving Systems. In Proceedings of the IEEE Conference on Intelligent Transportation Systems, ITSC, Maui, HI, USA, 4–7 November 2018; pp. 2118–2125. [Google Scholar]
- Bock, J.; Krajewski, R.; Moers, T.; Runde, S.; Vater, L.; Eckstein, L. The inD Dataset: A Drone Dataset of Naturalistic Road User Trajectories at German Intersections. In Proceedings of the IEEE Intelligent Vehicles Symposium, Las Vegas, NV, USA, 19 October–13 November 2020; pp. 1929–1934. [Google Scholar]
- Krajewski, R.; Moers, T.; Bock, J.; Vater, L.; Eckstein, L. The rounD Dataset: A Drone Dataset of Road User Trajectories at Roundabouts in Germany. In Proceedings of the IEEE 23rd International Conference on Intelligent Transportation Systems, ITSC, Rhodes, Greece, 20–23 September 2020. [Google Scholar]
- Moers, T.; Vater, L.; Krajewski, R.; Bock, J.; Zlocki, A.; Eckstein, L. The exiD Dataset: A Real-World Trajectory Dataset of Highly Interactive Highway Scenarios in Germany. In Proceedings of the IEEE Intelligent Vehicles Symposium (IV), Aachen, Germany, 4–9 June 2022; pp. 958–964. [Google Scholar]
- Zhan, W.; Sun, L.; Wang, D.; Shi, H.; Clausse, A.; Naumann, M.; Kummerle, J.; Konigshof, H.; Stiller, C.; de La Fortelle, A.; et al. INTERACTION Dataset: An INTERnational, Adversarial and Cooperative moTION Dataset in Interactive Driving Scenarios with Semantic Maps. arXiv 2019, arXiv:1910.03088. [Google Scholar]
- Caesar, H.; Bankiti, V.; Lang, A.H.; Vora, S.; Liong, V.E.; Xu, Q.; Krishnan, A.; Pan, Y.; Baldan, G.; Beijbom, O. nuScenes: A multimodal dataset for autonomous driving. In Proceedings of the Computer Vision and Pattern Recognition (CVPR), Seattle, WA, USA, 13–19 June 2020; pp. 11621–11631. [Google Scholar]
- Chang, M.F.; Lambert, J.; Sangkloy, P.; Singh, J.; Bak, S.; Hartnett, A.; Wang, D.; Carr, P.; Lucey, S.; Ramanan, D.; et al. Argoverse: 3D Tracking and Forecasting with Rich Maps. In Proceedings of the IEEE/CVF Conference on Computer Vision and Pattern Recognition (CVPR), Long Beach, CA, USA, 15–20 June 2019; pp. 8748–8749. [Google Scholar]
| Disclaimer/Publisher’s Note: The statements, opinions and data contained in all publications are solely those of the individual author(s) and contributor(s) and not of MDPI and/or the editor(s). MDPI and/or the editor(s) disclaim responsibility for any injury to people or property resulting from any ideas, methods, instructions or products referred to in the content. |
© 2023 by the authors. Licensee MDPI, Basel, Switzerland. This article is an open access article distributed under the terms and conditions of the Creative Commons Attribution (CC BY) license (https://creativecommons.org/licenses/by/4.0/).


