Proceeding Paper

Effect of Intense Hot-Spot-Specific Local Fields on Fluorescein Adsorbed at 3D Porous Gold Architecture: Evolution of SERS Amplification and Photobleaching under Resonant Illumination †

Department of Optoelectronics, V.E. Lashkarev Institute of Semiconductor Physics, National Academy of Sciences of Ukraine, 41 Pr. Nauki, 03028 Kyiv, Ukraine
*
Author to whom correspondence should be addressed.
Presented at the 3rd International Electronic Conference on Biosensors, 8–21 May 2023; Available online: https://iecb2023.sciforum.net/.
Eng. Proc. 2023, 35(1), 32; https://doi.org/10.3390/IECB2023-14606
Published: 16 May 2023
(This article belongs to the Proceedings of The 3rd International Electronic Conference on Biosensors)

Abstract

:
Plasmonic nanostructures with a high density of confined areas with high local electromagnetic fields (hot spots) are sine qua nonto increase the efficiency of surface-enhanced Raman spectroscopy (SERS). These nanostructures can be used both to identify biological molecules and to monitor photochemical reactions occurring on the metal surface. In this work, using the method of pulsed laser deposition, three-dimensional (3D) porous wedge-shaped arrays of gold nanoparticles (Au NPs) were obtained with structural parameters varying along the substrate, such as film thickness, porosity, nanoparticles size, and the distance between them. The resulting arrays were structures with a regularly changing density of hot spots along the substrate, in which the enhancement of the electromagnetic field strength is due to the geometric parameters of the nanostructure.By analyzing the evolution of fluorescence and Raman scattering of fluorescein molecules adsorbed on the surface of porous gold under illumination at 532 nm, the processes in the region of extreme values of the electromagnetic field of surface nanostructures was studied. A correlation has been established between the amplification of optical signals and the structural features of the surface. A correlation between SERS and fluorescence signals indicates the predominant contribution of hot spots to the electromagnetic amplification of optical signals. The observed time evolution of the fluorescence and SERS intensity of fluorescein can be explained by the combination of molecular photodegradation, the reconstruction of the hot spot architecture due to local heating, and potent relocation of analyte molecules outside the area of measurement owing to the effects of thermal gradients.

1. Introduction

Surface enhanced raman scattering (SERS) is a highly sensitive method for identifying marker molecules and monitoring their structural changes by providing information about the vibrational states of the electronic subsystem of the object of analysis. SERS is based on the enhancement of Raman scattering of molecules under conditions when local surface plasmon states are excited on the nanostructured surface of Drude materials such as gold or silver [1]. The efficiency of SERS significantly depends on the size and shape of nanostructure fragments, their mutual arrangement, as well as the distance of molecules from the metal surface and the orientation of their dipole moments relative to the nanostructure. Hot spots, i.e., regions with intense electric fields that appear near the edges of anisotropic NPs (the focusing effect of the surrounding nanostructures) and narrow gaps between NPs (less than 10 nm), are the main sources of Raman scattering enhancement, so their number is directly reflected in the quality of SERS spectra [2,3,4,5,6,7,8,9]. High intensities of Raman peaks observed in SERS spectra, high gain factors up to 1010–1014, typically correlate with the presence of hot spots in nanostructures and their efficiency [10,11,12].
Information about “how burning hot spots”used for an analyte in arrays of Au or Ag nanoparticles can be obtained by studying the dynamics of photodegradation of fluorophore molecules adsorbed on the surface of the nanostructure. SERS can be effectively used to control the photodegradation of a fluorophore in real time [13,14,15,16]: the change in the Raman spectra under laser illumination can be associated with a change in the chemical structure/conformation of the molecule, while a decrease in the intensity of the luminescence bands indicatesreversible photobleaching or irreversible molecular degradation. Shifts in the SERS peak positions can also be observed, which indicate changes in the molecule’s structure or its environment; moreover, new peaks associated with amorphous carbon may appear as a result of thermal destruction [16,17]. However, the relationship between the processes leading to the enhancement of fluorescence and Raman scattering, on the one hand, and the possible photodestruction or photobleaching of fluorophores on the surface of metal nanostructures under illumination, on the other hand, has not been considered in detail. This work is devoted to clarifying this issue inthe case of porous 3D plasmonic nanoarchitecture.

2. Materials and Methods

Three-dimensionalporous Au arrays were obtained by pulsed laser deposition (PLD) from the backward flow of low-energy plasma plume particles in an argon atmosphere onto a glass substrate (dimensions 25 × 25 × 1.5 mm3) located on the target plane. The YAG:Nd3+ laser beam (wavelength 1.06 µm, energy 0.2 J, pulse time 10 ns, and frequency 25 Hz) scanned the Au (99.9%) target in a vacuum chamber with argon pressure 13.5 Pa. The energy density was 5 J/cm2, and the laser pulse number was 30,000. Ablation was performed with a laser beam focused at an angle of 45° with respect to the target plane. Before depositing an array of Au NPs on the substrate, the glass was preliminarily cleaned with an oxidizer based on potassium bichromate in sulfuric acid, (10 g of K2Cr2O7 per 350 mL of H2SO4), isopropanol, followed by washing in a large amount of distilled water in an ultrasonic bath.
Determination of the film thickness and surface imaging were performed by atomic force microscopy (AFM) using a NanoscopeIIIa microscope (Digital Instruments, Santa Barbara California USA) in a periodic contact mode. Si probes with nominal tip radii of 10 nm were used. The images of the surface and the film thickness d were determined at different distances L from the axis of the plasma plume. The film’sthickness d was obtained from the direct measurement of the heights of the substrate-film steps, which were created by disruptive lithography. With the help of the original software package developed by us, layer-by-layer sections of AFM images were built and analyzed. Visual 2D slices of the image were made in grayscale (0–255) from 0 to 100% depth with a step of x%. As a result, a series of vertical slices of the surface profile wereobtained, the analysis of which makes it possible to obtain the following statistical parameters: the number of isolated grains N per unit area; the total area of isolated grains S; and the average value of the minimum distances between the isolated grains within the slice D.
To study the evolution of emission and Raman scattering, we used the dye fluorescein, which is widely used in biochemistry and biomedicine. The substrate was immersed in an aqueous solution of fluorescein with a concentration of 10−5 M and then washed with distilled water and dried in air. The Raman signal of molecules was measured along the substrate in four regions indicated in Figure 1b with different thickness d. SERS spectra were measured using a confocal system (NTEGRA Spectra, Apeldoorn, the Netherlands, NT-MDT) and a laser source (GL, 532 nm, LCM-S-111). A partially focused laser beam with a diameter of ~5 μm was used, the laser radiation intensity was ~50 μW/μm2 in the sample plane, and the integration time was 10 s.

3. Results and Discussion
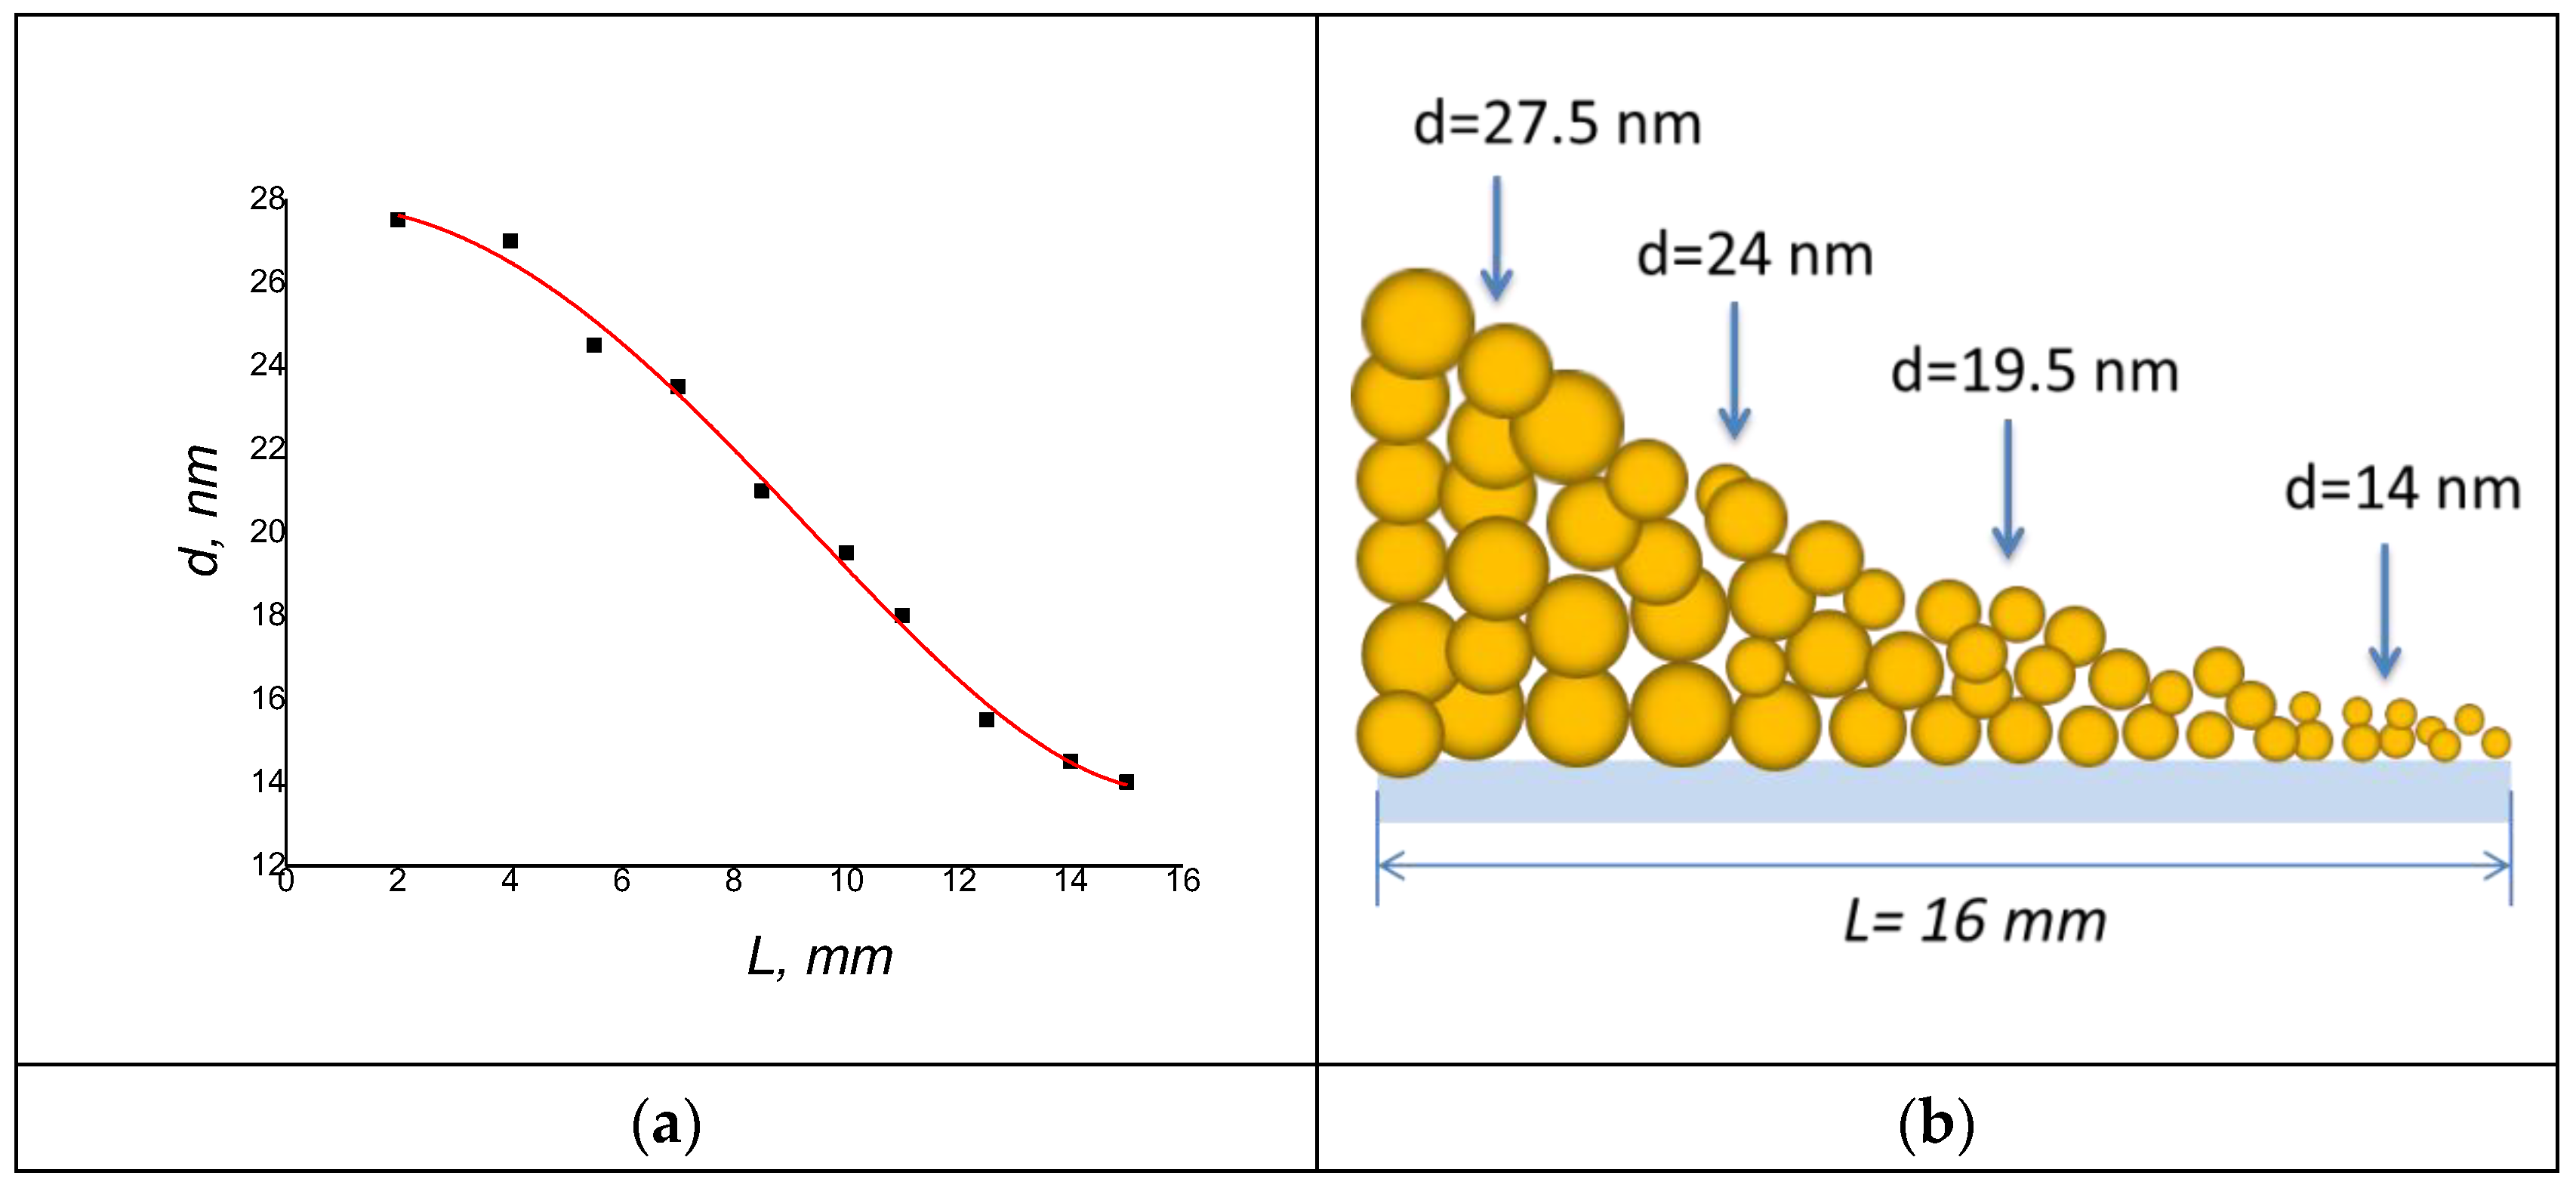
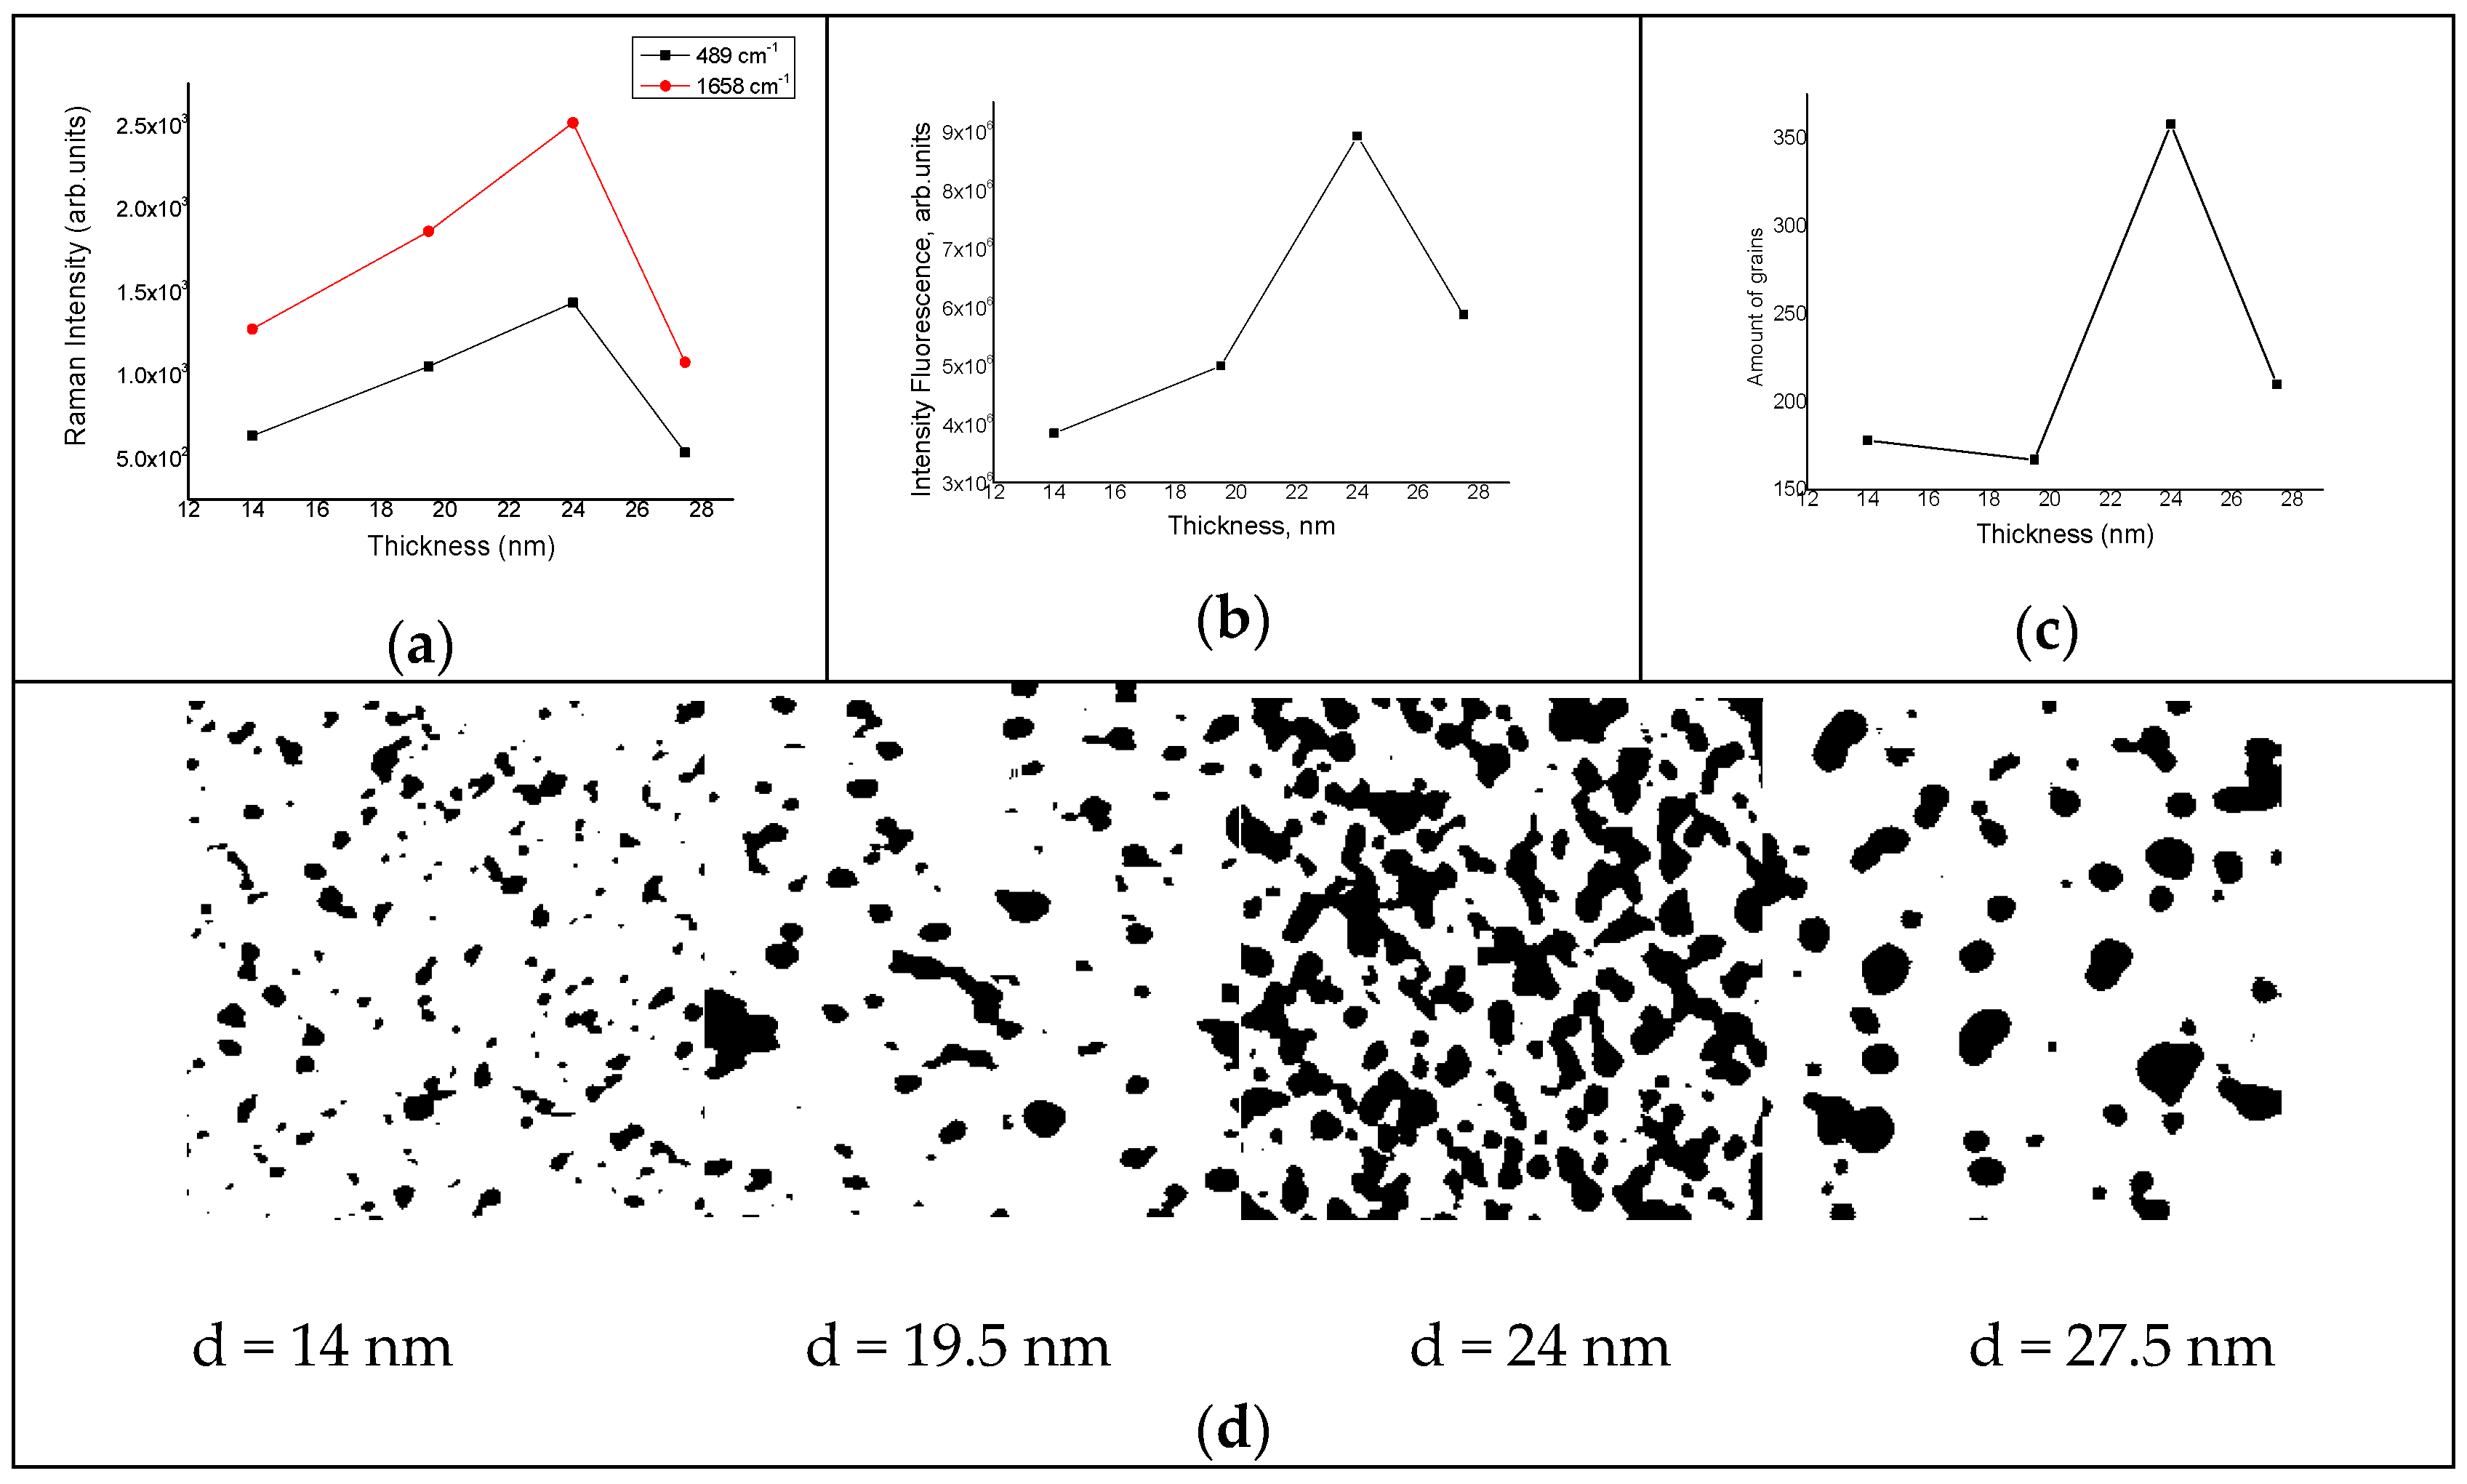
3.1. AFM Imaging

The results of AFM imaging of porous close-packed arrays of Au NPs, obtained by the PLD method with backward flow of low-energy plasma plume particles in an argon atmosphere, confirmthe formation of a wedge-shaped structure. Along the substrate, the effective thickness d decreases from c.a. 28 nm to c.a. 14 nm (see Figure 1a,b); the corresponding changes in the roughness and average diameter D of nanoparticles are 3.6–0.74 nm and 28–16.5 nm, respectively. According to X-ray reflectometry, the obtained arrays were characterized by porosity in the range of 40–45% [18]. The 3D architecture of such a nanostructure provides a high density of nanogaps not only on the surface but also inside the film. In addition, significant differences in surface area for different sites can also lead to significant differences in both their absorption efficiency and adsorption capacity in relation to the analyte.
In order to find correlations between structural features (minimum distances between nanoparticles, number of nanoparticles per unit area, filling factor, etc.) with the peculiarities of fluorescein optical spectra, AFM images were processed in four areas of samples with different film thicknesses −27.5 nm, 24 nm, 19.5 nm, and 14 nm. If the degree of amplification of the optical signals of luminescence and Raman scattering is due to the density of hot spots, then the number of isolated grains with minimum distances between them in different parts of the film should correlate with the amplification value in the same regions. Statistical analysis of layer-by-layer sections of AFM images with a size of 250 × 250 nm2 shows that the maxima of the number of grains N and the maximum enhancement of Raman signals coincide and are observed on the same surface area corresponding to a film thickness of 24 nm (Figure 2b).In this case, the largest number of grains with an average minimum distance between them of 4–5.5 nm is located at half the thickness of the surface profile. As the depth increased, almost 100% surface filling was observed with nanoparticles in all substrate areas.

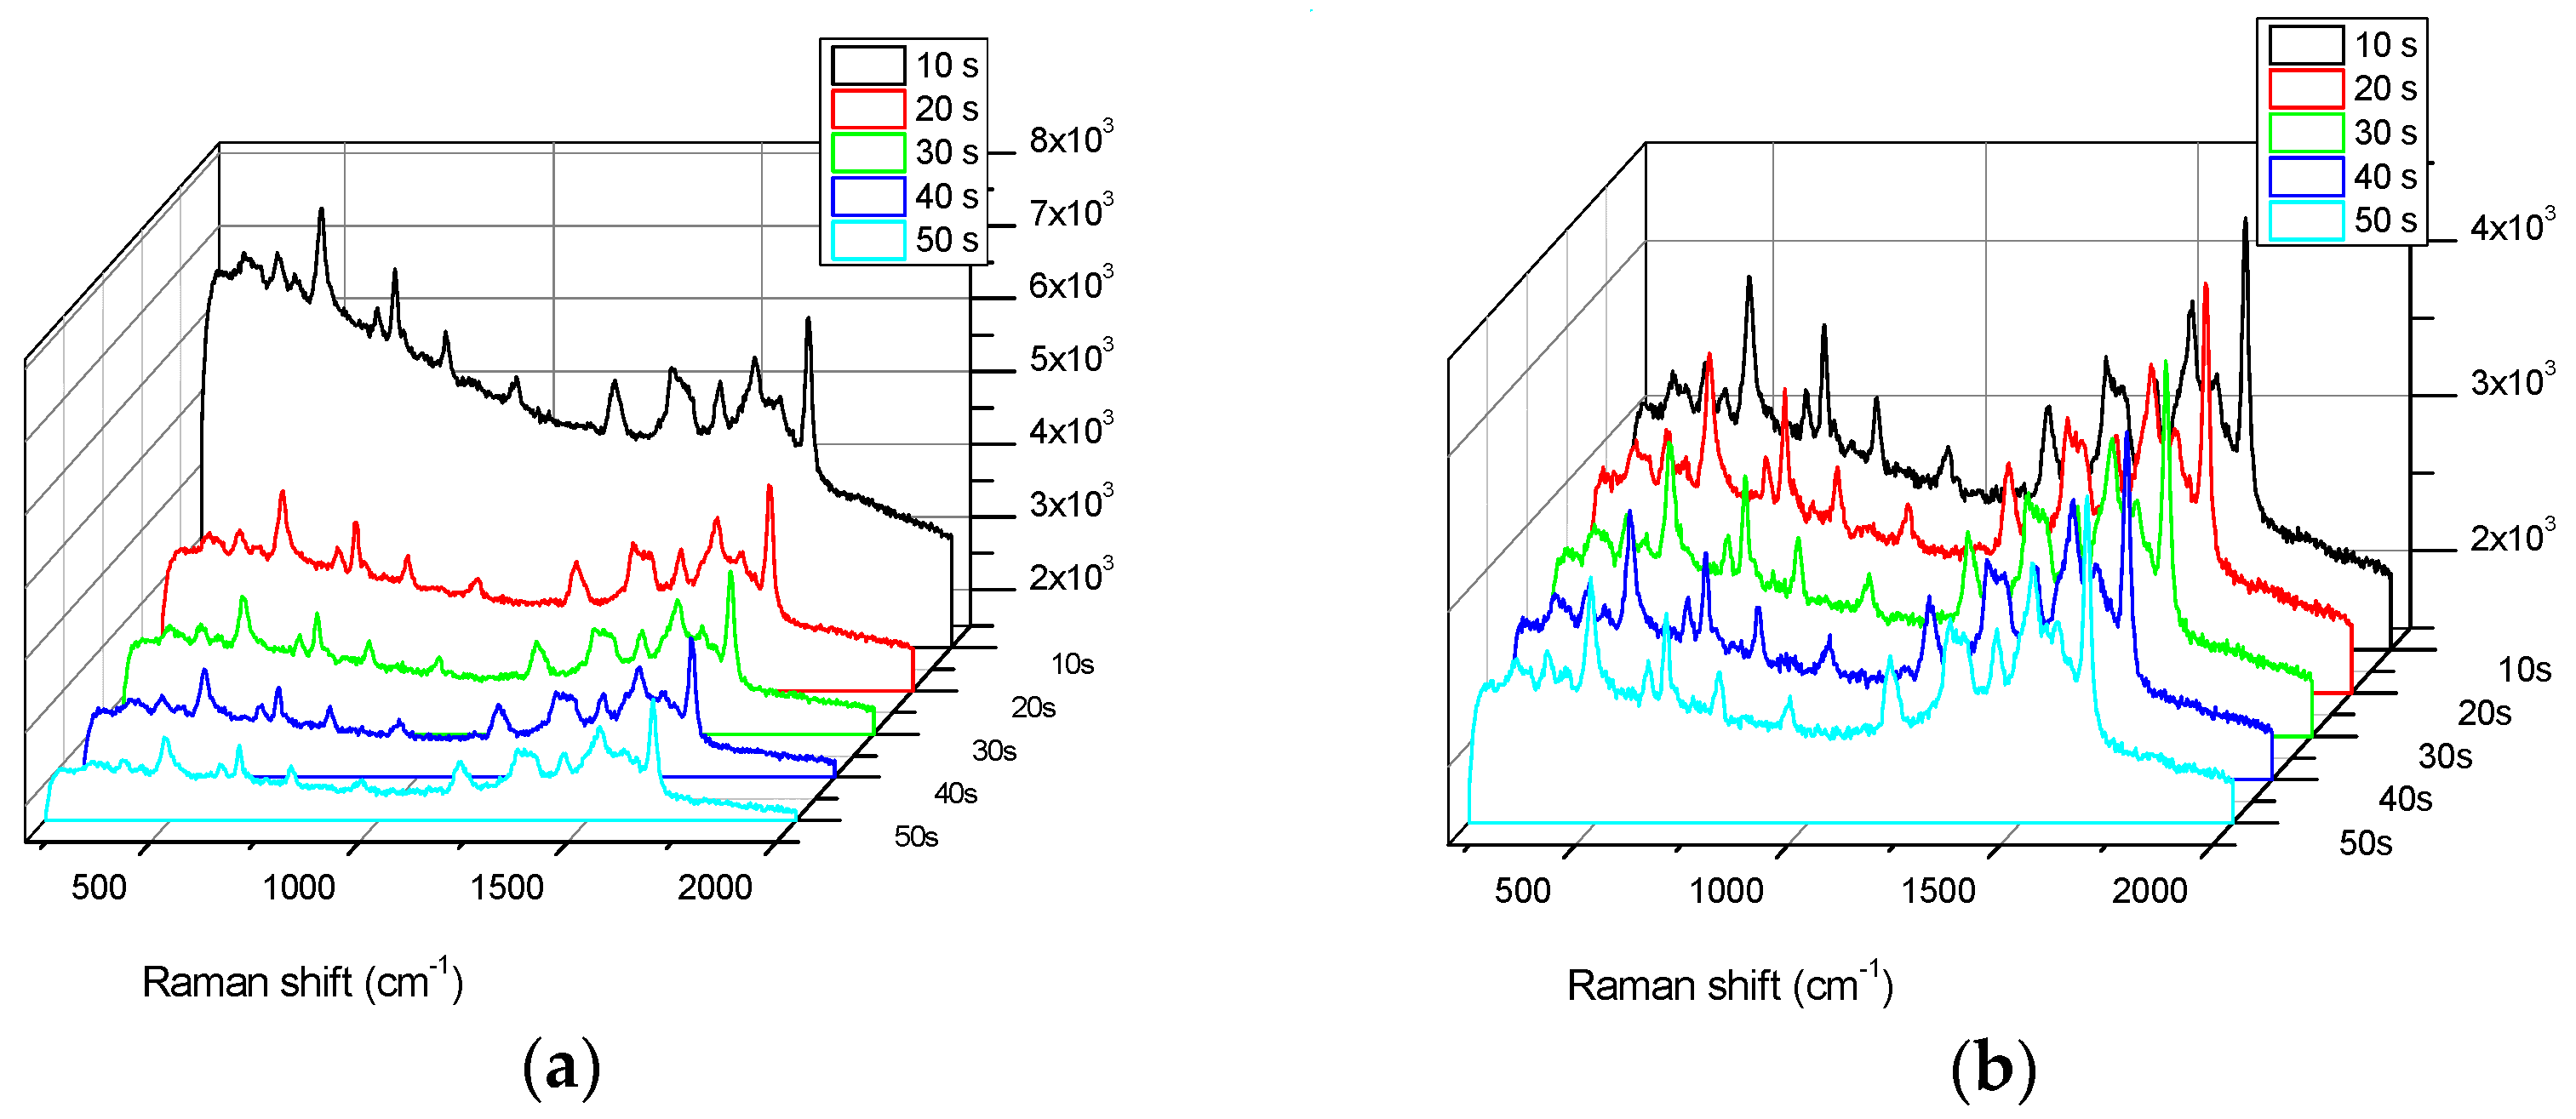
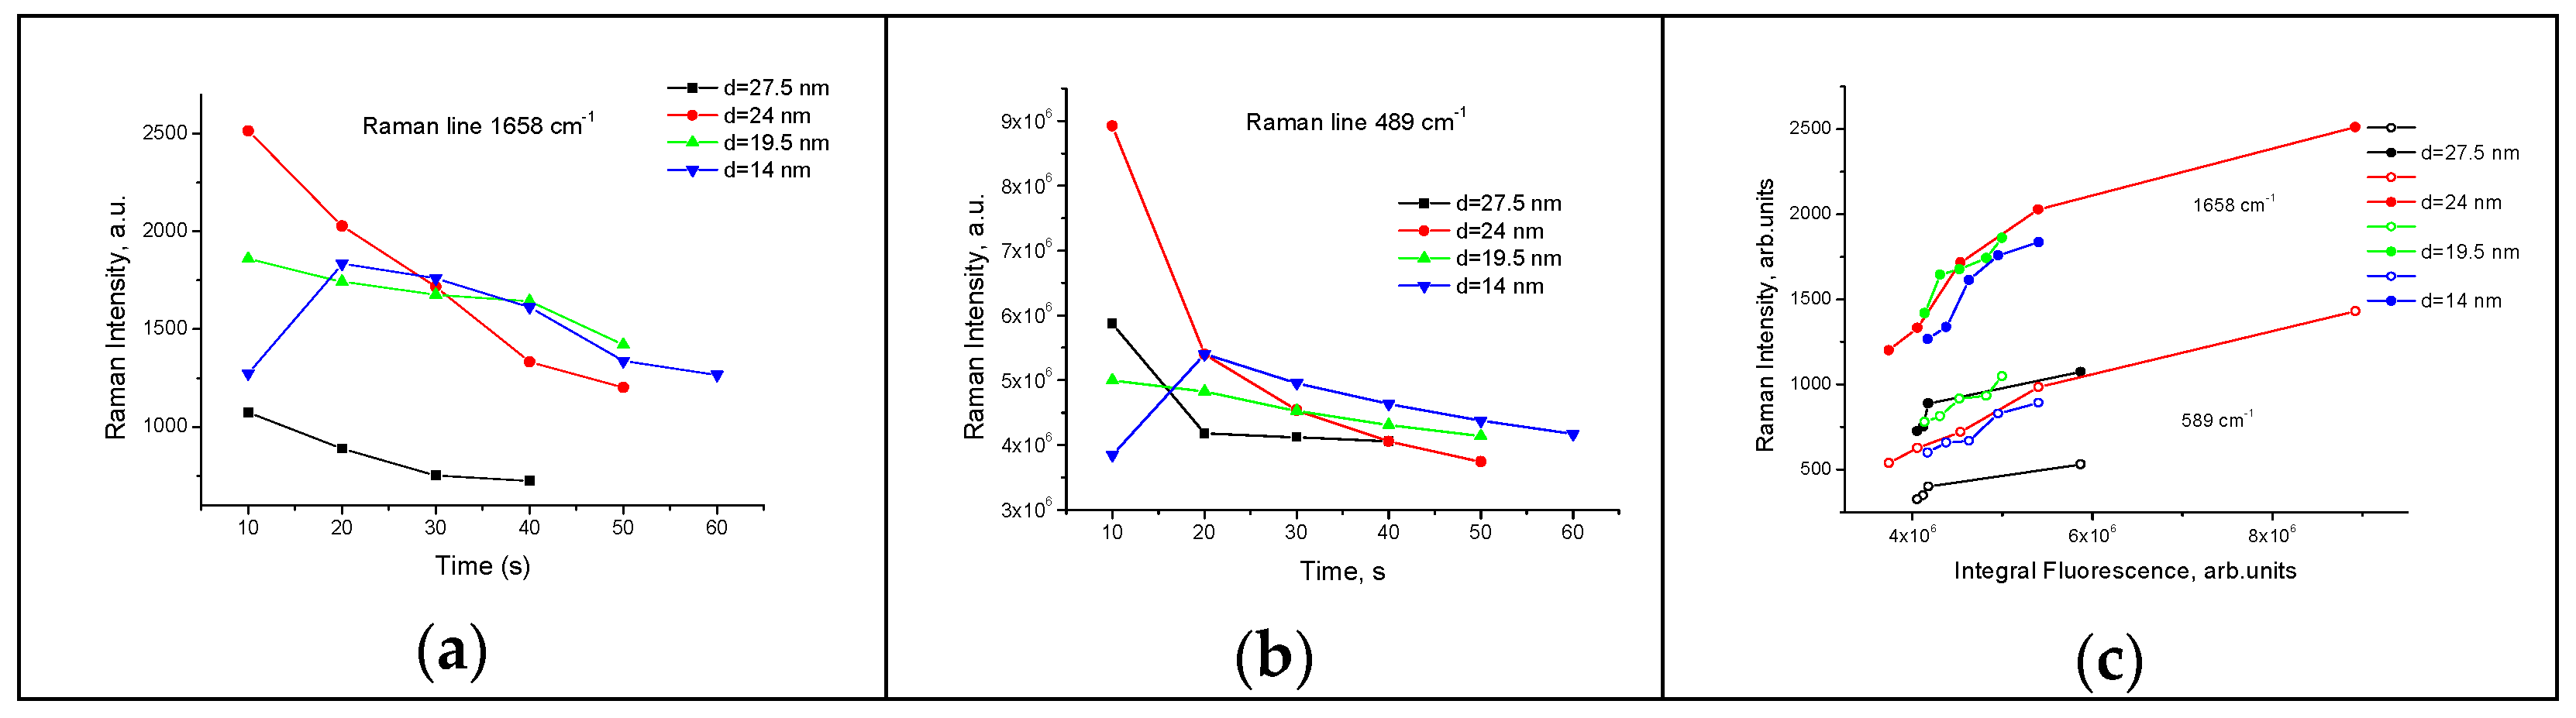
3.2. Raman Investigations of Radiation-Induced Transformation in Adsorbed Fluorescein

Attempts to register the Raman signal of fluorescein on glass and on a smooth film of thermally deposited 50 nm-thick gold showed that the spectra contain a strong background fluorescence signal, which does not make it possible to distinguish the Raman signal of the characteristic bands of the fluorophore. Monitoring the intensity of the fluorescence signal over time in the range of 10–60 s on these substrates did not reveal any changes in the spectra; under these conditions, neither bleaching nor photodegradation of the chromophore was observed in the specified range of laser exposure times.
Fluorescein molecules adsorbed on the surface of an array of nanoporous Au nanoparticles are characterized by specific vibrational modes against the background of a broad fluorescence band: the xanthene tension modes C-C at 1300 cm−1–1658 cm−1 and the xanthene skeleton bending modes at 380 cm−1–688 cm−1. As can be seen from Figure 2a, the intensity of the Raman peaks of molecules at 489 cm−1 and 1658 cm−1 depends on the area on the substrate, i.e., the structural features of the Au NP array. The region with the highest SERS enhancement at d = 24 nm is characterized by the largest number of grains with a minimum distance between them (less than 10 nm); in other words, it is this region that contains the maximum number of hot spots per unit area. (Figure 2c). This allows us to confirm the conclusion made earlier in [9] that the SERS-specific amplification is directly proportional to the number of hot spots on the substrate.
The intensity of the background fluorescence can also depend on the presence and number of hot spots (Figure 2b); the increase in the efficiency of both emission (electrons transition) and Raman scattering owing to atoms’ vibrations can be explained by the theory of two-fold electromagnetic amplification [19].
As can be seen from the data presented in Figure 3, an increase in the irradiation time of the same section of the film leads to a gradual decrease in the intensity of the SERS signal and background fluorescence. This behavior is typical for all considered surface areas; in this case, the Raman spectra structure (the number of bands and relative intensity as well as their positions) practically does not change. At the same time, as can be clearly seen from the comparison of the dependencies shown in Figure 3, the nature of luminescence quenching depends significantly on the position of the measurement region on the sample surface.
It should be noted that the typical workflow of the experiment focused on the evolution of the optical response assumes that both the initial value and the rate of change of the signal in the initial segment are unknown quantities. This imposes restrictions on the entire subsequent discussion since it does not allow us to assess with high reliability the nature of the fast relaxation stage or the very fact of its presence. Therefore, further discussion concerns the estimate of the slow phase of the evolutionary process, which occurs approximately 10–15 s after the start of irradiation: the total irradiation time, including the integration time during the measurement and the time required to correct the focus when the sample position changes.
When comparing the change in Raman intensity at 489 cm−1 and 1658 cm−1 over time for different regions, the largest change was observed for the region (thickness d = 24 nm) with the highest increase in SERS intensity (Figure 4a). This suggests that it is the processes near or inside the hot spots that are responsible for the decreasing SERS intensity and bleaching of the luminescence. For a region with a thickness of 14 nm, an unusual time-dependence behavior was observed. After 10s exposure to laser radiation, the measured spectra were characterized by an increase in the SERS signal and background fluorescence, followed by a usual decrease.
Data on background fluorescence level (calculated as an integral in the 538–595 nm region) versus exposure time also show much faster decay in thicker regions of the film and much less change when the film takes on a quasi-two-dimensional structure. A correlation wasobserved in the evolution of the SERS and fluorescence in the 3D Au NPs nanoporous array (Figure 4c).

3.3. On the Question of a Possible Mechanism of Photobleaching or Photodegradation

The results presented in Figure 4 contradict the generally accepted model of background impurity luminescence bleaching in order to obtain a clear picture of Raman scattering. A typical picture is described in [20], where it is shown that with increasing illumination time, the intensity of the background luminescence decreases, while the Raman signal remains unchanged. However, in this study, it was shown that both the luminescence intensity and the Raman signal of fluorescein decrease with exposure time in a similar way.
The similarity in the behavior of optical responses indicates that the electromagnetic amplification mechanism is most likely responsible for the amplification of both SERS and fluorescence since it is this mechanism that leads to the amplification of both the incident light and the light scattered and emitted by the molecule. The total value of the registered luminescence and Raman scattering directly depends on (1) the number of hot spots, (2) their efficiency, and (3) the number of analyte molecules in the nanogap region. Remaining within the framework of this general scenario, we can propose the following main mechanisms of the processes leading to the dependenciesobserved in the experiment.
(1) Photodegradation following photobleaching. One of the possible mechanisms to explain the observed time evolution of both the integrated fluorescence and SERS intensity of fluorescein molecules is photobleaching and subsequent photodegradation, whereby fluorochrome molecules undergo photoinduced chemical transformation (often reversible) or destruction (irreversible) under the light exposition, and lose their ability to luminesce [21,22]. Since the decrease in response values was not accompanied by any changes in the spectra, we cannot determine whether the observed effect is reversible or not. However, the loss of the ability to luminesce is believed to be due to the formation of non-radiative complexes resulting from bimolecular reactions in an excited triplet state, or, as a result of the reaction of molecules in an excited triplet state with oxygen, which transform into a stable, non-fluorescent photoproduct. The probability of a reaction between dye molecules depends on their intermolecular distance and is determined by their distribution on the surface. This assumption correlates well with the high efficiency of fading in the thick part of the film, where pore sizes are large, and several fluorescent molecules can be accommodated. The gradual decrease in both SERS and LM with time is due to a decrease in the number of fluorescein molecules as a result ofphotodestruction.
When molecules are located on the surface near or inside the regions of localization of strong electromagnetic fields of metal nanostructures, changes in the nature of intramolecular processes are possible: the changes relate to both absorption and radiation; in addition, a new attenuation channel appears, which is associated with the nonradiative energy transfer between the molecule and the metal and depends on the distance d from the metal surface [15,23,24]. It is these features that can explain the differences in the behavior of the SERS and luminescence. At the same time, the mechanisms of photodestruction are common for both and are closely related to the actual electromagnetic amplification on plasmonic nanostructures under SERS conditions [25]. For molecules located in the region of hot spots (higher gain), photodegradation proceeds more strongly [26]. Intense fields can enhance the process of photodegradation of fluorophores in several ways: (1) promote the formation of various types of oxygen-containing radicals, which lead to the destruction of the fluorophore, and (2) lead to thermal defragmentation of molecules under the action of strong fields on the surface of metal nanostructures. The influence of intense electric fields has been confirmed by the observed correlation between the structural parameters, such as the number of hot spots, the decay rate of SERS, and the fluorescence intensity. The nanostructure with the largest number of hot spots exhibits the fastest fluorescence decrease, where the highest SERS signal is measured. This suggests that photobleaching mainly occurs in the hot spots where the highest electromagnetic enhancement occurs.
(2) Decreased efficiency of hot spots due to the temperature effects of the internal restructuring of nanostructures. Another possible mechanism for the time evolution of SERS and fluorescence is the reconstruction of the surface within hot spots due to local heating of the structure, leading to changes in the geometric parameters of hot spots and their number. Excitation of plasmon resonance in metal nanoclusters, under the influence of laser radiation, generates efficient heat in nanostructures [27,28]. The heating effect is particularly enhanced in an array of close-packed NPs, due to two mechanisms: the accumulative effect, i.e., the addition of heat fluxes generated by individual NPs, and the effect of the Coulomb interaction, which depends on the distance of the NPs, as well as their location. Significant optimization of the nanostructure with enhanced heating can be achieved by increasing the number of interfaces, i.e., the number of nanopores, as demonstrated in [29]. This type of nanostructuring makes it possible to achieve the required temperature at a lower laser radiation power. Thus, on 3D nanoporous arrays of Au NPs obtained by PLD, local heating with subsequent annealing of the nanostructure is possible even at low laser irradiation powers. In this case, the heating temperature may not reach the values at which fluorescein molecules are destroyed (T = 315 °C). Heating and restructuring of the structure will lead to a decrease in the number of pores, coalescence of nanoparticles, and smoothing of the surface; these effects already effectively occur in gold nanostructures at temperatures of 80–150 °C [30,31,32], which can be achieved in hot spots under the action of laser irradiation in the region of local plasmon resonance (for gold nanostructures, this range is 520–550 nm, which falls on the wavelength of the laser being used). As a result, the number and/or efficiency of hot spots is reduced, which leads to a decrease in the enhancement of SERS intensity and fluorescence. Since the structure with the highest density of hot spots (pores) undergoes the most modification, this region will experience the fastest decrease in SERS signal and fluorescence.
(3) Light-induced displacement of analyte molecules by the temperature gradients of hot spots. The possible effects of thermal gradients in SERS spectroscopy are discussed in [33]. The results of this study suggest that temperature gradients can stimulate various kinetic effects in the area of hot spots. This may be related both to the exit of analyte molecules outside the measurement area (which, accordingly, will reduce the magnitude of the optical response of both SERS and luminescence) and lead to reorientation or a change of position within the measurement area. It is probably the last effect that determines the non-monotonous behavior of the responses in the thinnest region of the film, where the presence of uncoated glass fragments of the substrate is possible.

4. Conclusions

The pulsed laser deposition method was used in creating three-dimensional nanoporous wedge-shaped 3D gold nanoparticlearrays with varying structural features and hot spot density. The obtained nanostructures were used to study the evolution of fluorescein luminescence and SERS adsorbed at the porous film with different structural features. The obtained results showthat there is a relationship between the AuNP 3D array structural features such as the average grain size, the number of grains, and the distance between them, which determine the density of hot spots and the SERS and luminescence intensity enhancement. The fastest fluorescence and Raman intensity decrease wereobserved for the nanostructure with the largest number of hot spots where the highest SERS signal was observed. The time evolution of the integrated fluorescence and SERS intensity of fluorescein molecules can be explained by the combination of photodegradation, the reconstruction of the nanostructure due to local heating, and the potent relocation of analyte molecules. These processes arise due to the presence of a strongly enhanced electromagnetic field within or near hot spots, as indicated by the correlation with the structural parameters of different sections of the 3D nanoparticles array. The results obtained can be used as a scientific basis for the development of express tests in SERS plasmonic arrays to assess the efficiency of their amplification and practical applicability.

Author Contributions

Conceptualization, B.S.; methodology, B.S., I.K. and S.K.; software, E.M.; validation and sample preparation I.K., S.K., A.K. and E.M.; investigation, B.S., A.K. and S.K.; writing—original draft preparation, I.K., S.K. and B.S.; writing—review and editing, I.K., S.K., A.K., E.M. and B.S. All authors have read and agreed to the published version of the manuscript.

Funding

This research received no external funding.

Institutional Review Board Statement

Not applicable.

Informed Consent Statement

Not applicable.

Data Availability Statement

Data are available upon request.

Conflicts of Interest

The authors declare no conflict of interest.

References

  1. Le Ru, E.C.; Etchegoin, P.G. Principles of Surface Enhanced Raman Spectroscopy; Elsevier: Amsterdam, The Netherlands, 2009. [Google Scholar]
  2. Hao, E.; Schatz, G.C. Electromagnetic fields around silver nanoparticles and dimers. J. Chem. Phys. 2004, 120, 357–366. [Google Scholar] [CrossRef]
  3. Atta, S.; Tsoulos, T.V.; Fabris, L. Shaping gold nanostar electric fields for surface-enhanced Raman spectroscopy enhancement via silica coating and selective etching. J. Phys. Chem. C 2016, 120, 20749–20758. [Google Scholar] [CrossRef]
  4. Wustholz, K.L.; Henry, A.-I.; McMahon, J.M.; Freeman, R.G.; Valley, N.; Piotti, M.E.; Natan, M.J.; Schatz, G.C.; Van Duyne, R.P. Structure-Activity Relationships in Gold Nanoparticle Dimers and Trimers for Surface-Enhanced Raman Spectroscopy. J. Am. Chem. Soc. 2010, 132, 10903–10910. [Google Scholar] [CrossRef] [PubMed]
  5. Zhao, Y.; Xu, L.; Liz-Marzan, L.M.; Kuang, H.; Ma, W.; Asenjo-Garcia, A.; García de Abajo, F.J.; Kotov, N.A.; Wang, L.; Xu, C. Alternating Plasmonic Nanoparticle Heterochains Made by Polymerase Chain Reaction and Their Optical Properties. J. Phys. Chem. Let. 2013, 4, 641–647. [Google Scholar] [CrossRef] [PubMed]
  6. Urban, A.S.; Shen, X.; Wang, Y.; Large, N.; Hong, W.; Knight, M.W.; Nordlander, P.; Chen, H.; Halas, N.J. 3-D Plasmonic Nanoclusters. Nano Lett. 2013, 13, 4399–4403. [Google Scholar] [CrossRef] [PubMed]
  7. Kaganovich, E.B.; Krishchenko, I.M.; Kravchenko, S.A.; Manoilov, E.G.; Golichenko, B.O.; Kolomys, A.F.; Strelchuk, V.V. SERS spectroscopy of nanocomposite porous films containing silver nanoparticles. Opt. Spectrosc. 2015, 118, 294–299. [Google Scholar] [CrossRef]
  8. Rastogi, R.; Foli, E.A.D.; Vincent, R.; Adam, P.-M.; Krishnamoorthy, S. Engineering Electromagnetic Hot-Spots in Nanoparticle Cluster Arrays on Reflective Substrates for Highly Sensitive Detection of (Bio)molecular Analytes. ACS Appl. Mater. Interfaces 2021, 13, 32653–32661. [Google Scholar] [CrossRef]
  9. Krishchenko, I.; Kravchenko, S.; Kruglenko, I.; Manoilov, E.; Snopok, B. 3D Porous Plasmonic Nanoarchitectures for SERS-Based Chemical Sensing. Eng. Proc. 2022, 27, 41. [Google Scholar] [CrossRef]
  10. Xu, H.; Aizpurua, J.; Kall, M.; Apell, P. Electromagnetic Contributions to Single-Molecule Sensitivityin Surface-Enhanced Raman Scattering. Phys. Rev. E Stat. Phys. Plasmas Fluids Relat. Interdiscip. Top. 2000, 62, 4318–4324. [Google Scholar]
  11. Le Ru, E.C.; Galloway, C.; Etchegoin, P.G. On the connection between optical absorption/extinction and SERS enhancements. Phys. Chem. Chem. Phys. 2006, 8, 3083–3087. [Google Scholar] [CrossRef]
  12. Tang, L.; Liu, Y.; Liu, G.; Chen, Q.; Li, Y.; Shi, L.; Liuand, Z.; Liu, X. A Novel SERS Substrate Platform: Spatially Stacking Plasmonic Hotspots Films. Nanoscale Res. Lett. 2019, 14, 94. [Google Scholar] [CrossRef] [PubMed]
  13. Merlen, A.; Lagugne’-Labarthet, F.; Harte, E. Surface-Enhanced Raman and Fluorescence Spectroscopy of Dye Molecules Deposited on Nanostructured Gold Surfaces. J. Phys. Chem. C 2010, 114, 12878–12884. [Google Scholar] [CrossRef]
  14. Snopok, B.; Naumenko, D.; Serviene, E.; Bruzaite, I.; Stogrin, A.; Kulys, J.; Snitka, V. Evanescent-field-induced Raman scattering for bio-friendly fingerprinting at sub-cellular dimension. Talanta 2014, 128, 414–421. [Google Scholar] [CrossRef]
  15. Galloway, C.M.; Artur, C.G.; Grand, J.; Le Ru, E.C. Photobleaching of Fluorophores on the Surface of Nanoantennas. J. Phys. Chem. C 2014, 118, 28820–28830. [Google Scholar] [CrossRef]
  16. Li, C.-Y.; Duan, S.; Yi, J.; Wang, C.; Radjenovic, P.M.; Tian, Z.-Q.; Li, J.-F. Real-time detection of single-molecule reaction by plasmon-enhanced spectroscopy. Sci. Adv. 2020, 6, eaba6012. [Google Scholar] [CrossRef] [PubMed]
  17. Naumenko, D.; Snopok, B.A.; Serviene, E.; Bruzaite, I.; Snitka, V. Confocal Raman Spectroscopy of Biological Objects in the Face of Photoinduced Luminescence Self-Quenching. Theor. Exp. Chem. 2013, 49, 228–234. [Google Scholar] [CrossRef]
  18. Kladko, V.P.; Gudymenko, O.Y.; Kriviy, S.B.; Litvin, P.M.; Kaganovich, E.B.; Krishchenko, I.M.; Manoilov, E.G. Reflectometry study of nanoporous films with arrays of gold nanoparticles. Ukr. J. Phys. 2014, 59, 915–921. [Google Scholar] [CrossRef]
  19. Yoshida, K.I.; Itoh, T.; Biju, V.; Ishikawa, M.; Ozaki, Y. Experimental evaluation of the twofold electromagnetic enhancement theory of surface-enhanced resonance Raman scattering. Phys. Rev. B 2009, 79, 085419. [Google Scholar] [CrossRef]
  20. Cebeci, D.; Alam, A.; Wang, P.; Pinal, R.; Ben-Amotz, D. Photobleaching profile of Raman peaks and Fluorescence background. Eur. Pharm. Rev. 2017, 22, 18–21. [Google Scholar]
  21. Song, L.; Hennink, E.J.; Young, T.; Tanke, H.J. Photobleaching Kinetics of Fluorescein in Quantitative Fluorescence Microscopy. Biophys. J. 1995, 68, 2588–2600. [Google Scholar] [CrossRef] [PubMed]
  22. Widengren, J.; Rigler, R. Mechanisms of photobleaching investigated by fluorescence correlation spectroscopy. Bioimaging 1996, 4, 149–157. [Google Scholar] [CrossRef]
  23. Sen, T.; Patra, A. Resonance Energy Transfer from Rhodamine 6G to Gold Nanoparticles by Steady-State and Time-Resolved Spectroscopy. J. Phys. Chem. C 2008, 112, 3216–3222. [Google Scholar] [CrossRef]
  24. Ling, J.; Huang, C.Z. Energy transfer with gold nanoparticles for analytical applications in the fields of biochemical and pharmaceutical sciences. Anal. Methods 2010, 2, 1439–1447. [Google Scholar] [CrossRef]
  25. Fang, Y.; Seong, N.-H.; Dlott, D.D. Measurement of the Distribution of Site Enhancements in Surface-Enhanced Raman Scattering. Science 2008, 321, 388–392. [Google Scholar] [CrossRef] [PubMed]
  26. Etchegoin, P.G.; Lacharmoise, P.D.; Le Ru, E.C. Influence of Photostability on Single-Molecule Surface Enhanced Raman Scattering Enhancement Factors. Anal. Chem. 2009, 81, 682–688. [Google Scholar] [CrossRef]
  27. Govorov, A.O.; Richardson, H.H. Generating heat with metal nanoparticles. Nanotoday 2007, 2, 30–38. [Google Scholar] [CrossRef]
  28. Baffou, G.; Berto, P.; Ureña, E.B.; Quidant, R.; Monneret, S.; Polleux, J.; Rigneault, H. Photo-Induced Heating of Nanoparticle Arrays. ASC Nano 2013, 7, 6478–6488. [Google Scholar] [CrossRef]
  29. Baffou, G.; Girard, C.; Quidant, R. Mapping Heat Origin in Plasmonic Structures. Phys. Rev. Lett. 2010, 104, 136805. [Google Scholar] [CrossRef]
  30. Snopok, B.; Strizhak, P.; Kostyukevich, E.; Serebriy, V.; Lysenko, S.; Shepeliavii, P.; Priatkin, S.L.; Kostuykevich, S.; Shirshov, Y.; Venger, E. Interfacial architecture on the fractal support: Polycrystalline gold films as support for self-assembling monolayers. Semicond. Phys. Quantum Electron. Optoelectron. 1999, 2, 86–97. [Google Scholar] [CrossRef]
  31. Snopok, B.A.; Kostyukevich, K.V.; Lysenko, S.I.; Lytvyn, P.M.; Lytvyn, O.S.; Mamykin, S.V.; Zynyo, S.A.; Shepelyavyj, P.E.; Kostyukevich, S.A.; Shirshov, Y.M.; et al. Optical biosensors based on the surface plasmon resonance phenomenon: Optimization of the metal layer parameters. Semicond. Phys. Quantum Electron. Optoelectron. 2001, 4, 56–69. [Google Scholar] [CrossRef]
  32. Lysenko, S.I.; Snopok, B.; Sterligov, V. Scattering of surface plasmon-polaritons and volume waves by thin gold films. Opt. Spectrosc. 2010, 108, 581–590. [Google Scholar] [CrossRef]
  33. Kang, T.; Hong, S.; Choi, Y.; Leex, L.P. The Effect of Thermal Gradients in SERS Spectroscopy. Small 2010, 6, 2649–2652. [Google Scholar] [CrossRef] [PubMed]
Figure 1. (a) Dependence of the 3D array thickness of the Au NPs on the distance to the erosion torch axis and (b) schematic representation of a wedge-shaped close-packed Au NP nanostructure; arrows indicate the four regions discussed in this work.
Engproc 35 00032 g001
Figure 2. (a) Dependence of the SERS signal intensity at 489 cm−1 and (b) 1658 cm−1 and (b) the fluorescence intensity for fourareas in the substrate plane for porous gold film thickness d. (c) Dependence of grains amount N per area of 250 × 250 nm2 on the nanostructure thickness. (d) The sections of the profiles of AFM images at a depth of about half the surface profile of the Au NP array (image scale 0.5 μm).
Engproc 35 00032 g002
Figure 3. Dependence of the intensity of Raman scattering and background fluorescence of fluorescein on the time under irradiation of 3D Au NP nanostructures with different film thickness d, the average diameter D of Au nanoparticles, and the number N of Au grains per 0.0625 μm2: (a) d = 24 nm, D = 19 nm, N = 358; (b) d = 19.5 nm, D = 16.5, N = 167.
Engproc 35 00032 g003
Figure 4. Time dependence of the intensity of the SERS band at 1658 cm−1 (a) and the integral luminescence (b) of fluorescein adsorbed on an array of 3D Au NPs for four regions of the surface structure with thickness d: 27.5 nm, 24 nm, 19.5 nm, and 14 nm. (c) The dependences illustrate the presence of a qualitative correlation between the intensity of the SERS bands at 489 cm−1 (circumference) and 1658 cm−1 (circle)and the level of integrated luminescence for different irradiation times and different parts of the structure under study.
Engproc 35 00032 g004
Disclaimer/Publisher’s Note: The statements, opinions and data contained in all publications are solely those of the individual author(s) and contributor(s) and not of MDPI and/or the editor(s). MDPI and/or the editor(s) disclaim responsibility for any injury to people or property resulting from any ideas, methods, instructions or products referred to in the content.

