Abstract
Fresh fish and poultry meat are in high demand on the market: poultry, mainly chicken, is the second most consumed and the most affordable meat product in the world. Fish consumption varies greatly across regions but, in some countries, seafood is the main source of abundant and affordable macro- and micronutrients. Meat and, especially, fish are highly perishable products; methods and equipment for rapid, objective, and reliable assessing the freshness of fish and meat are crucial for the food industry. Generally recognized reference techniques such as total volatile basic nitrogen (TVB-N), volatile fatty acids (VFA), high pressure liquid chromatography (HPLC), mass spectrometry, or nuclear magnetic resonance (NMR) spectroscopy are time-consuming and require expensive and complex equipment. We developed a novel chromatographic optical sensor with a deep UV LED photometric detection (255–265 nm) for rapid assessment of meat and fish freshness based on determination of the relative content of adenosine triphosphate (ATP) metabolites. The sensor has a simple and compact design, and relatively low cost; sample preparation and processing of a chromatogram takes less than 30 min. The sensor was tested on Amur (farmed freshwater fish) and rooster meat, obtained from a local farmer. The samples were kept refrigerated at +4 °C, measurements were taken daily during a 14 day period. All chromatograms show two peaks: proteins are responsible for the first one; the second broad post-protein band is formed due to the overlapping of individual peaks of ATP and its metabolites. As fish and poultry meat are stored, ATP is converted into metabolites with lower molecular weight, which is reflected in the chromatograms—the elution time for the second peak increases. It was shown that this time can be directly associated with the freshness status of a product. As expected, poultry meat showed better storage stability and freshness retention compared to Amur fish.
1. Introduction
The consumption of poultry and fish is one of the key items in the diet of most people worldwide, so the quality of the consumed products directly affects the life and health of customers. Accordingly, the relevance of freshness control of such commonly used food products is undoubtedly high. Poultry meat, mainly chicken, is the first and most affordable meat product in the world, yet there are only a few published studies specifically aimed at the development and evaluation of testing methods for assessment of the freshness of poultry [1,2,3,4]. Fish consumption varies greatly by region, but in some countries, seafood is the main source of abundant and affordable macro and micronutrients. Meat and especially fish are perishable products: methods and equipment for rapid, objective, and reliable assessment of the freshness of fish and meat are of decisive importance for the food industry.
One of the simple analytical methods, which could be used for objective (non-organoleptic) testing of the freshness of meat and fish as a viable alternate to more sophisticated techniques such as nuclear magnetic resonance (NMR) or mass-spectrometry (MS) is fast protein liquid chromatography (FPLC). FPLC (1982, Pharmacia LKB) is a form of high-performance chromatography that uses the high resolution made possible by small-diameter stationary phase particles [5,6]. It has been widely demonstrated that the method can be successfully used in analytical applications as a more accessible and economical method than HPLC [7], moreover, FPLC columns can withstand much higher protein loads than conventional HPLC and use a wide range of aqueous biocompatible buffer systems [8]. The properties of FPLC, such as the efficiency and availability of analytical methods and tools, are of decisive importance for routine tests in the health care or food industry; accordingly, the use of such a characterization and analysis method can be especially relevant [7,9,10,11]. In many situations FPLC could be supplemented with the ability to detect mid- and low molecular weight substances, and the term fast protein and metabolite liquid chromatography (FPMLC) is more appropriate.
Because relative changes in ATP metabolite concentrations have proven to be reliable indicators of the freshness of meat and fish, the ability of FPMLC to isolate and detect ATP metabolites may be of particular importance in food science and technology. After slaughtering animals or harvesting fish, the chain of ATP transformations is accompanied by a gradual decrease in the molecular masses of ATP metabolites (molecular masses in Daltons are indicated in brackets) [12,13]:
ATP (507) → ADP (427) → AMP (347) → IMP (348) → Ino (268) → Hx (136).
Within 24 h, biochemical processes of the conversion of ATP, adenosine diphosphate (ADP) and adenosine monophosphate (AMP) into inosine monophosphate (IMP) take place (the first stage of the transformation chain). As a result, there is a rapid accumulation of IMP in muscle tissue, which partly determines the pleasant taste (umami) and high nutritional value of meat and fish products [14]. Then, more slowly, IMP breaks down into Ino and Hx, which is associated with a loss of freshness. The conversion of Hx into xanthine, uric acid, and other end products of ring cleavage is the final step in bacterial spoilage [12,13].
The ability to detect changes in food freshness during storage at an early stage of spoilage, before any signs of microbial spoilage, determines the main convenience of the techniques based on ATP metabolites detection [15,16,17,18] in comparison with generally accepted standard methods, such as the determination of total volatile basic nitrogen (TVB-N), trimethylamine nitrogen (TMA-N) or volatile fatty acids (VFA) [19,20]. However, despite the advantages, this approach is still rarely used in routine food quality control due to the fact that traditional laboratory methods for the determination of ATP metabolites, including HPLC, NMR and MS, are cumbersome, and require a lot of time and extremely expensive analytical instruments maintained by highly qualified personnel [21,22].
Enzyme sensors, along with immunosensors for pathogenic bacteria and pesticides [23], are the main biosensors currently used in food analysis and show great potential in medical testing and rapid food quality testing [24]. The short time to check the freshness of meat and, especially perishable fish, as well as the possibility of on-site analysis in conjunction with portability and ease of sampling, causes special activity in the development of biosensors for rapid testing of the freshness of meat and fish. However, the shortcomings of such sensors make it difficult to become an alternative to traditional methods of analysis and organoleptic evaluation: the difficulty in achieving high reproducibility and stability of characteristics during the manufacture and storage of biosensors, the high cost of disposable biosensors, comparable to the cost of some fish species [25], as well as dependence on modern production technologies microchips [26].
The use of simplified and compact instruments based on classical methods of analysis, which can be used on site, outside the laboratory, and do not require complex sample preparation and are suitable for rapid testing, will help eliminate the disadvantages between complex and expensive laboratory analytical instruments and miniature biosensor microfluidic devices. Accordingly, the aim of this work is to develop an affordable, compact, reusable optical chemical sensor and validate measurement techniques for rapid assessing the freshness of poultry meat and fish in situ using FPMLC with UV photometric detection.
2. Materials and Methods
2.1. FPLMC Optical Chemical Sensor
The optical sensor developed by Ldiamon AS (Tartu, Estonia) was used to process chromatograms and test the freshness of fish and poultry meat. The scheme of the optical sensor is shown in Figure 1. The sensor consists of a 25 mL buffer reservoir connected to the protein desalting column PD-10 from GE Healthcare® Bio-Sciences AB (Uppsala, Sweden). The detection module is equipped with a UV LED emitting in the wavelength range of 255–265 nm, and a solar-blind photodetector registers the optical density of the eluate in a quartz flow cell connected to a drain vessel. The flow rate of eluate is adjusted by a mechanical regulator. A more detailed description of the design and working principles of the sensor can be found in [5,10].
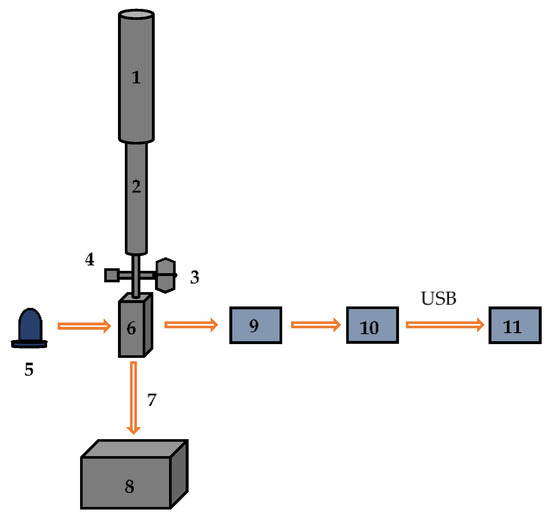
Figure 1.
The scheme of the optical sensor: 1—LabMate buffer reservoir; 2—PD-10 column; 3—three-way valve; 4—service port; 5—UV LED (255–265 nm); 6—flow cell; 7—flow rate regulator; 8—drain vessel; 9—photodetector; 10—electronic unit, 11—laptop PC.
2.2. Chemicals
The TRIS working buffer was prepared by adding 10 mM of TRIS (tris(hydroxymethyl)aminomethane), 150 mM of NaCl, 2 mM of EDTA-Na2 (ethylenediaminetetraacetic acid disodium salt) to distilled water. The washing buffer consisted of 250 mL of TRIS buffer mixed with 200 mM of NaOH. Aqueous solutions of bovine serum albumin (BSA) and Hx were used for the sensor calibration as standards. All chemicals were obtained from Sigma-Aldrich (Darmstadt, Germany).
2.3. Sample Preparation
The Amur fish (Ctenopharyngodon idella) was purchased in a local supermarket from an aquarium and first measurements were carried out within one hour after capture. Rooster meat (a male of Gallus gallus domesticus) was obtained from a local farmer within 7 h after slaughter. Two Amur fish and one rooster were used in this research.
Two grams of muscle tissue sampled from the back of the fish or from the rooster breast were cut into small pieces and 6 mL of TRIS buffer was added to prepare liquid extract. The mixture was shaken with the Vortex V-1 plus Biosan for 1 min in a plastic tube, pulled out with a Luer-lock 20 mL syringe and filtered with the Whatman® GF/B glass fiber syringe filter.
A conventional steam cooker bought from a kitchen appliance store was used to heat the samples at 100 °C; fish samples were treated for 40–45 min, rooster samples for 50–60 min. Liquid extracts of steam-cooked samples were prepared identically to raw samples.
2.4. Chromatogram Processing
The PD-10 column of the FPMLC sensor was washed with 25 mL of TRIS buffer before processing of each chromatogram. A small sample of liquid extract (500 µL for fish and 200 µL for rooster meat) prepared according to the procedure described above was placed directly on the gel surface with a pipette and left in the column for 15–30 s until completely absorbed by the gel. An additional 25 mL of TRIS buffer was added to the reservoir and a chromogram was processed. This procedure was repeated twice for meat samples taken from different areas of a fish or a bird carcass. When heat treatment was applied chromatograms were processed the same way as for raw samples. After each measurement session the PD-10 column was rinsed with washing buffer.
Measurements for raw fish and rooster meat were taken every day during storage; fish and rooster were kept refrigerated at 2–4 °C. For heat treated fish chromatograms were processed on days 1, 3, 5, 8, and 10; for heat treated rooster meat—on days 3, 8 and 13. For heat treated fish kept in a refrigerator we also made measurement every day starting day 3; similar experiments with rooster meat were not performed.
The sensor calibration was carried out with a mixture of BSA and Hx aqueous solutions. The buffer flow rate was adjusted to achieve 270 s difference in elution times between BSA and Hx chromatographic peaks.
3. Results and Discussion
Fish and rooster meat FPMLC chromatograms show two peaks as can be seen in Figure 2 and Figure 3. The first one is sharp and associated with proteins. The second one has a broad shape and is formed by a group of individual peaks of nucleotides and nucleosides. The maximum of the protein peak was taken as a zero point on the time scale of the chromatograms.
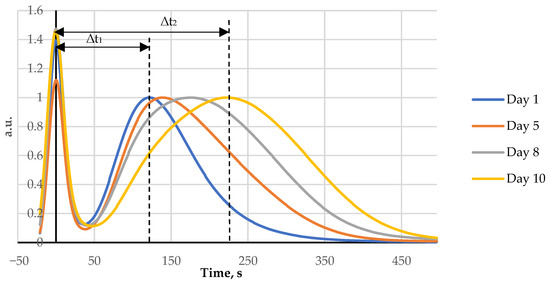
Figure 2.
Four FPMLC chromatograms of fish (Amur) liquid extracts showing the increasing of the time distance between two peaks for days 1, 5, 8, and 10.
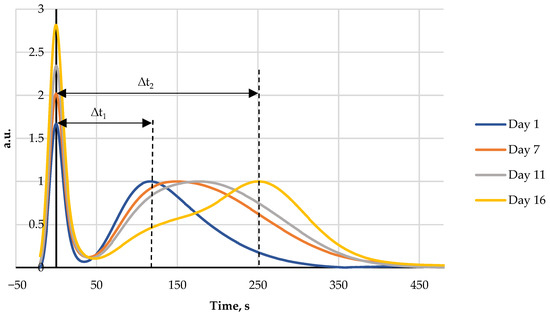
Figure 3.
Four FPMLC chromatograms of rooster meat liquid extracts showing the increasing of the time distance between two peaks for days 1, 7, 11, and 16.
During storage of both fish and rooster meat the time lag between the maxima of the two peaks gradually increases. This effect is due to the breakdown of ATP by specific enzymes into lower molecular weight metabolites. The difference between the retention time of the protein peak and the broad post-protein band is a key parameter for the new FPLMC technique and henceforth it will be referred to as the index Time.
The index Time was determined for each chromatogram of a raw piece of fish or rooster. The data for Amur fish were averaged for two fish. The data for rooster were obtained from one carcass. The evolution of the average values of the index Time for raw and steam cooked Amur fillets and rooster meat during storage in a refrigerator at 2–4 °C are presented in Table 1 and Figure 4. The variations of the index Time value between measurements carried out on the same day for the same object (fish or rooster) did not exceed 10–15 s.

Table 1.
Average value of the index Time during storage.
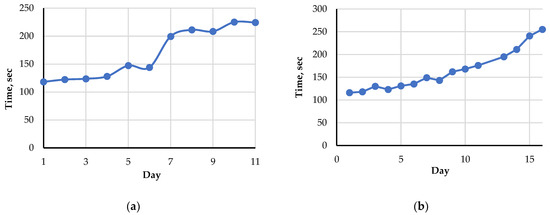
Figure 4.
The average value of the index Time during storage at 2–4 °C: (a) for raw fish (Amur); (b) for raw rooster meat.
Figure 4 demonstrates the existence of a correlation between the index Time and the storage time. The index increases markedly with increasing storage time following the seasoning and spoilage processes. This is due to the shifting and broadening of the second peak corresponding to nutritional nucleotides and nucleosides because of the ATP breakdown. For rooster meat, the index Time changes smoother and slower than for Amur fish.
The index Time measurements for heat treated (steamed) fish and rooster showed the index values for cooked samples were higher than those for raw meat on the first measurement day. After day 5 for fish and day 8 for rooster the initial index Time before heat treatment became higher than after steam cooking. The decrease of the index after heat treatment is presented in Figure 5. This effect can be explained by nucleotide salvage initiated by high temperatures, but this hypothesis should be supported by additional research data.
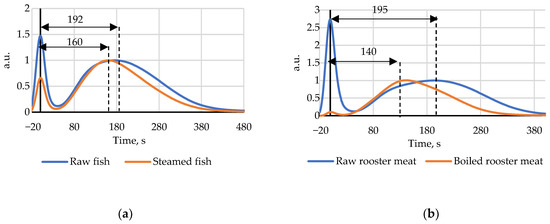
Figure 5.
(a) Chromatograms of steamed and raw fish on the 8th day of storage; (b) Chromatograms of steamed and raw rooster meat on the 13th day of storage.
Steam cooked fish that had been kept in the refrigerator for 7 days showed no significant change in the index Time, it fluctuated around an average value of 137 s, which could be explained by thermal destruction of specific enzymes and subsequent blockage of the ATP breakage chain.
4. Conclusions
The FPMLC sensor, developed for assessing the freshness of fish and animal meat, was tested on Amur fish and rooster meat. Freshness estimation was based on the index Time, which is defined as the difference between the retention time for the protein peak and the nucleotide and nucleoside group peak. Experiments with Amur and rooster meat confirm the possibility of using the sensor to evaluate the freshness status. The measurements demonstrate a similar trend of the index Time for fish and poultry meat: in both cases it showed an increasing trend with increasing storage period. For fish the index Time change and spoilage were faster than for rooster meat which spoiled, and index changed slower and more smoothly. Steam treatment experiments showed declining of the index Time in comparison to raw samples after for the products, which were still safe to use but lost freshness. It can be concluded that the FPMLC sensor is an affordable alternative to expensive laboratory equipment and applicable for a wide range of meat and fish products. It allows fairly accurate and fast on-site testing.
Author Contributions
Conceptualization, A.K. and G.K.; methodology, A.S.; software, V.K.; investigation, O.V.S. and D.L.; writing—original draft preparation, O.V.S. and D.L.; writing—review and editing, O.S.S. and G.K.; project administration, A.F. All authors have read and agreed to the published version of the manuscript.
Funding
This research received no external funding.
Institutional Review Board Statement
Not applicable.
Informed Consent Statement
Not applicable.
Data Availability Statement
Data available on request due to Ldiamon AS commercial secret.
Acknowledgments
The authors express their gratitude to Roman Korsakov for assistance in software development.
Conflicts of Interest
The authors declare no conflict of interest.
References
- Ye, X.; Iino, K.; Zhang, S. Monitoring of bacterial contamination on chicken meat surface using a novel narrowband spectral index derived from hyperspectral imagery data. Meat Sci. 2016, 122, 25–31. [Google Scholar] [CrossRef] [PubMed]
- Fujita, T.; Hori, Y.; Otani, T.; Kunita, Y.; Sawa, S.; Sakai, S.; Tanaka, Y.; Takagahara, I.; Nakatani, Y. Applicability of the K0 Value as an Index of Freshness for Porcine and Chicken Muscles. Agric. Biol. Chem. 1988, 52, 107–112. [Google Scholar] [CrossRef]
- Aliani, M.; Farmer, L.J.; Kennedy, J.T.; Moss, B.W.; Gordon, A. Post-slaughter changes in ATP metabolites, reducing and phosphorylated sugars in chicken meat. Meat Sci. 2012, 94, 55–62. [Google Scholar] [CrossRef]
- Patton, L.; Ng, J. How Chicken Became the Only Meat Everyone Agrees On. Available online: https://www.bloomberg.com/news/articles/2022-06-08/chicken-on-track-to-overtake-beef-pork-as-top-protein (accessed on 8 June 2022).
- Kuznetsov, A.; Frorip, A.; Sünter, A.; Kasvand, N.; Korsakov, V.; Konoplev, G.; Stepanova, O.; Rusalepp, L.; Anton, D.; Püssa, T.; et al. Fast Protein and Metabolites (Nucleotides and Nucleosides) Liquid Chromatography Technique and Chemical Sensor for the Assessment of Fish and Meat Freshness. Chemosensors 2023, 11, 69. [Google Scholar] [CrossRef]
- Richey, J. FPLC: A comprehensive separation technique for biopolymers. Am. Lab. 1982, 14, 104–129. [Google Scholar]
- Tangvarasittichai, S.; Tangvarasittichai, O.; Jermnim, N. Comparison of fast protein liquid chromatography (FPLC) with HPLC, electrophoresis & microcolumn chromatography techniques for the diagnosis of beta-thalassaemia. Indian J. Med. Res. 2009, 129, 242–248. [Google Scholar] [PubMed]
- Madadlou, A.; O’Sullivan, S.; Sheehan, D. Fast Protein Liquid Chromatography. Methods Mol. Biol. 2017, 1485, 365–373. [Google Scholar]
- Deori, S.; Hurri, E.; Karkehabadi, S.; Morrell, J.M. Fast protein liquid chromatography profiles of seminal plasma proteins in young bulls: A biomarker of sperm maturity? Livest. Sci. 2021, 250, 104600. [Google Scholar] [CrossRef]
- Kuznetsov, A.; Frorip, A.; Sünter, A.; Korsakov, V.; Konoplev, G.; Stepanova, O.; Roschina, N.; Ovsyannikov, N.; Lialin, D.; Gerasimchuk, R.; et al. Optical Chemical Sensor Based on Fast-Protein Liquid Chromatography for Regular Peritoneal Protein Loss Assessment in End-Stage Renal Disease Patients on Continuous Ambulatory Peritoneal Dialysis. Chemosensors 2022, 10, 232. [Google Scholar] [CrossRef]
- Tsay, F.-R.; Haidar Ahmad, I.A.; Henderson, D.; Schiavone, N.; Liu, Z.; Makarov, A.A.; Mangion, I.; Regalado, E.L. Generic anion-exchange chromatography method for analytical and preparative separation of nucleotides in the development and manufacture of drug substances. J. Chromatogr. A 2019, 1587, 129–135. [Google Scholar] [CrossRef]
- Hong, H.; Regenstein, J.M.; Luo, Y. The Importance of ATP-related Compounds for the Freshness and Flavor of Post-mortem Fish and Shellfish Muscle: A Review. Crit. Rev. Food Sci. Nutr. 2017, 57, 1787–1798. [Google Scholar] [CrossRef]
- Howgate, P. A review of the kinetics of degradation of inosine monophosphate in some species of fish during chilled storage. Int. J. Food Sci. Technol. 2006, 41, 341–353. [Google Scholar] [CrossRef]
- Mouritsen, O.G. Umamification of food facilitates the green transition. Soil Ecol. Lett. 2022, 5, 9. [Google Scholar] [CrossRef]
- Zhang, Z.; Sun, Y.; Sang, S.; Jia, L.; Ou, C. Emerging Approach for Fish Freshness Evaluation: Principle, Application and Challenges. Foods 2022, 11, 1897. [Google Scholar] [CrossRef]
- Saito, T.; Arai, K.-I.; Matsuyoshi, M. A New Method for Estimating the Freshness of Fish. Nippon Suisan Gakkaishi 1959, 24, 749–750. [Google Scholar] [CrossRef]
- García, M.R.; Ferez-Rubio, J.A.; Vilas, C. Assessment and Prediction of Fish Freshness Using Mathematical Modelling: A Review. Foods 2022, 11, 2312. [Google Scholar] [CrossRef]
- Karube, I.; Matsuoka, H.; Suzuki, S.; Watanabe, E.; Toyama, K. Determination of fish freshness with an enzyme sensor system. J. Agric. Food Chem. 1984, 32, 314–319. [Google Scholar] [CrossRef]
- Bekhit, A.E.-D.A.; Holman, B.W.B.; Giteru, S.G.; Hopkins, D.L. Total volatile basic nitrogen (TVB-N) and its role in meat spoilage: A review. Trends Food Sci. Technol. 2021, 109, 280–302. [Google Scholar] [CrossRef]
- Bleicher, J.; Ebner, E.E.; Bak, K.H. Formation and Analysis of Volatile and Odor Compounds in Meat-A Review. Molecules 2022, 27, 6703. [Google Scholar] [CrossRef]
- Prabhakar, P.K.; Vatsa, S.; Srivastav, P.P.; Pathak, S.S. A comprehensive review on freshness of fish and assessment: Analytical methods and recent innovations. Food Res. Int. 2020, 133, 109157. [Google Scholar] [CrossRef] [PubMed]
- Franceschelli, L.; Berardinelli, A.; Dabbou, S.; Ragni, L.; Tartagni, M. Sensing Technology for Fish Freshness and Safety: A Review. Sensors 2021, 21, 1373. [Google Scholar] [CrossRef] [PubMed]
- Nanda, P.K.; Bhattacharya, D.; Das, J.K.; Bandyopadhyay, S.; Ekhlas, D.; Lorenzo, J.M.; Dandapat, P.; Alessandroni, L.; Das, A.K.; Gagaoua, M. Emerging Role of Biosensors and Chemical Indicators to Monitor the Quality and Safety of Meat and Meat Products. Chemosensors 2022, 10, 322. [Google Scholar] [CrossRef]
- Masette, M. A Comparative Study of Storage Time of Warm and Cold Water Fish In View of the Current Market Demands. Available online: http://innri.unuftp.is/proj99/Massete99-1FF.pdf (accessed on 7 July 2020).
- Xiong, X.; Tan, Y.; Mubango, E.; Shi, C.; Regenstein, J.M.; Yang, Q.; Hong, H.; Luo, Y. Rapid freshness and survival monitoring biosensors of fish: Progress, challenge, and future perspective. Trends Food Sci. Technol. 2022, 129, 61–73. [Google Scholar] [CrossRef]
- Konoplev, G.; Agafonova, D.; Bakhchova, L.; Mukhin, N.; Kurachkina, M.; Schmidt, M.-P.; Verlov, N.; Sidorov, A.; Oseev, A.; Stepanova, O.; et al. Label-Free Physical Techniques and Methodologies for Proteins Detection in Microfluidic Biosensor Structures. Biomedicines 2022, 10, 207. [Google Scholar] [CrossRef]


Disclaimer/Publisher’s Note: The statements, opinions and data contained in all publications are solely those of the individual author(s) and contributor(s) and not of MDPI and/or the editor(s). MDPI and/or the editor(s) disclaim responsibility for any injury to people or property resulting from any ideas, methods, instructions or products referred to in the content. |
© 2023 by the authors. Licensee MDPI, Basel, Switzerland. This article is an open access article distributed under the terms and conditions of the Creative Commons Attribution (CC BY) license (https://creativecommons.org/licenses/by/4.0/).