1. Introduction
Diabetes mellitus is an intractable chronic disease in which abnormal glucose metabolism occurs due to a partial or complete deficiency of insulin secreted by the pancreas [
1]. Uncontrolled blood sugar levels or glycemia can lead to health complications for patients. In fact, blood sugar levels in healthy people change before and after a meal. Generally, pre-meal glucose blood sugar concentration is 70–100 mg/dl. Diabetes is diagnosed when blood glucose levels are approximately 126 mg/dL (7 mmol/L) during fasting and 200 mg/dL 2 h after eating [
2]. Chronic hypoglycemia, a drop in blood sugar, can induce diabetic coma if it drops too quickly. This can lead to brain damage and even death [
3].
In order to prevent and avoid the complications associated with the change in the amount of glucose in the blood and the proper monitoring of the development of the dis-ease by health care personnel in order to control the disease effectively, patients need to monitor their blood sugar regularly. In reality, the majority of patients cannot feel the change in their glucose level unless, it is very high or very low, without taking a sample. According to the American Diabetes Association, patients with type 1 undergoing intense therapy should test their blood sugar 4–5 times a day, but those with type 2 require only two measurements per day [
4]. Unfortunately, the blood glucose monitoring devices that are available in the market only offer a limited number of measurements per day, while a diabetic needs continuous real-time glucose monitoring (CGM) to be informed in case of severe hyperglycaemia or hypoglycaemia. This is especially true for insulin-dependent patients [
5]. In addition to that, conventional glucometers require patients to prick their finger each time a measurement is taken to obtain the amount of blood needed for the sensor to work. These pricks are so painful and affect the fingers in the long term to such a degree that some people reduce the number of measures just to avoid pain. Therefore, it is clear that an ideal CGM device should be non-invasive, portable, accurate, inexpensive, easy to use, and not require extensive calibration. Mid-infrared (IR) radiation, with a wavelength range from 2500 nm to 25 µm, offers the highest selectivity for low-concentration compounds in complex organic media. In principle, most approaches using mid-infrared rely on the strong absorption of water in living tissue. Diffuse reflectance spectroscopy can access glucose molecules from the epidermal layer, whereas photothermal detectors can provide information from depths of 20–100 μm [
6].
A number of portable non-invasive blood glucose monitors have been developed that have demonstrated excellent blood glucose measurement and monitoring capabilities [
7,
8]. Most non-invasive devices require frequent calibration, but current research that works on developing non-invasive devices is finding that the calibration process, its duration, complexity, and effectiveness are detrimental and not periodically possible. In recent years, great efforts have been made to reduce or even eliminate the frequency of calibration [
9,
10]. This paper presents a fuzzy logic-based calibration system to map the output voltage of IR sensor and Arduino controller into reliable glucose concentration using Clarke error grid. In this study, the fuzzy logic is responsible about estimating the error tolerance using the output voltage from Arduino controller and the estimated glucose concentration.
2. Theoretical Background
As light rays traverse the tissues of the human body, they are subject to several phenomena such as scattering, absorption, reflection, and refraction. These phenomena provide evidence of irreconcilable refraction and reflection between the inside and outside of the cell and through the fluid. Theoretically, the detection should remain nearly constant, but it can change as the concentration of glucose molecules changes, and Pierre-Lambert’s law states that the amount of light absorbed by a substance depends on the concentration and length of the way the light passes through a medium. Increased absorption in tissues containing many sugar molecules reduces optical density through those tissues compared to less dense tissues. A wavelength of 940 nm has been found to be clinically acceptable as it has low absorption and as the intensity of light passing through blood vessels is not lost to the absorption of sugar molecules [
6]. The resulting optical density relationship after absorption is given by Equation (1):
where:
I: is the corresponding optical density.
I0: is the transmitted optical density.
L: length of path crossed by light.
: is the coefficient of loss within tissue, defined by Equation (2):
A change in light density after absorption eventually appears as a change in voltage, which leads to a change in the output shown as blood glucose percentage after being processed and calibrated.
3. Materials and Methods
3.1. Hardware Design
3.1.1. IR Transmitter and Receiver
We used infrared sensors to measure the sugar in blood vessels. These sensors have the advantage of generating an analog voltage signal that corresponds to the intensity of the received light. An infrared sensor generally consists of a sensor and a photoreceptor and converts the receiving train of pulsed IR into an analogue output voltage that is later used as input for the Arduino platform. The sender and receiver were obtained from the TP808 photocoupler element. This is highly sensitive, consisting of infrared diodes and NPN phototransistors with a high sensitivity indicated by 980 nm wavelength and 30 mW.
3.1.2. Amplifiers and Filters
The Lm358 amplifier was used for this purpose. A non-inverting amplifier formula was used to calculate the gain from the following Equation (3):
A passive low-pass filter RC (C = 10 uF, R = 330) was connected after the amplifier to remove unwanted signals such as power supply noise.
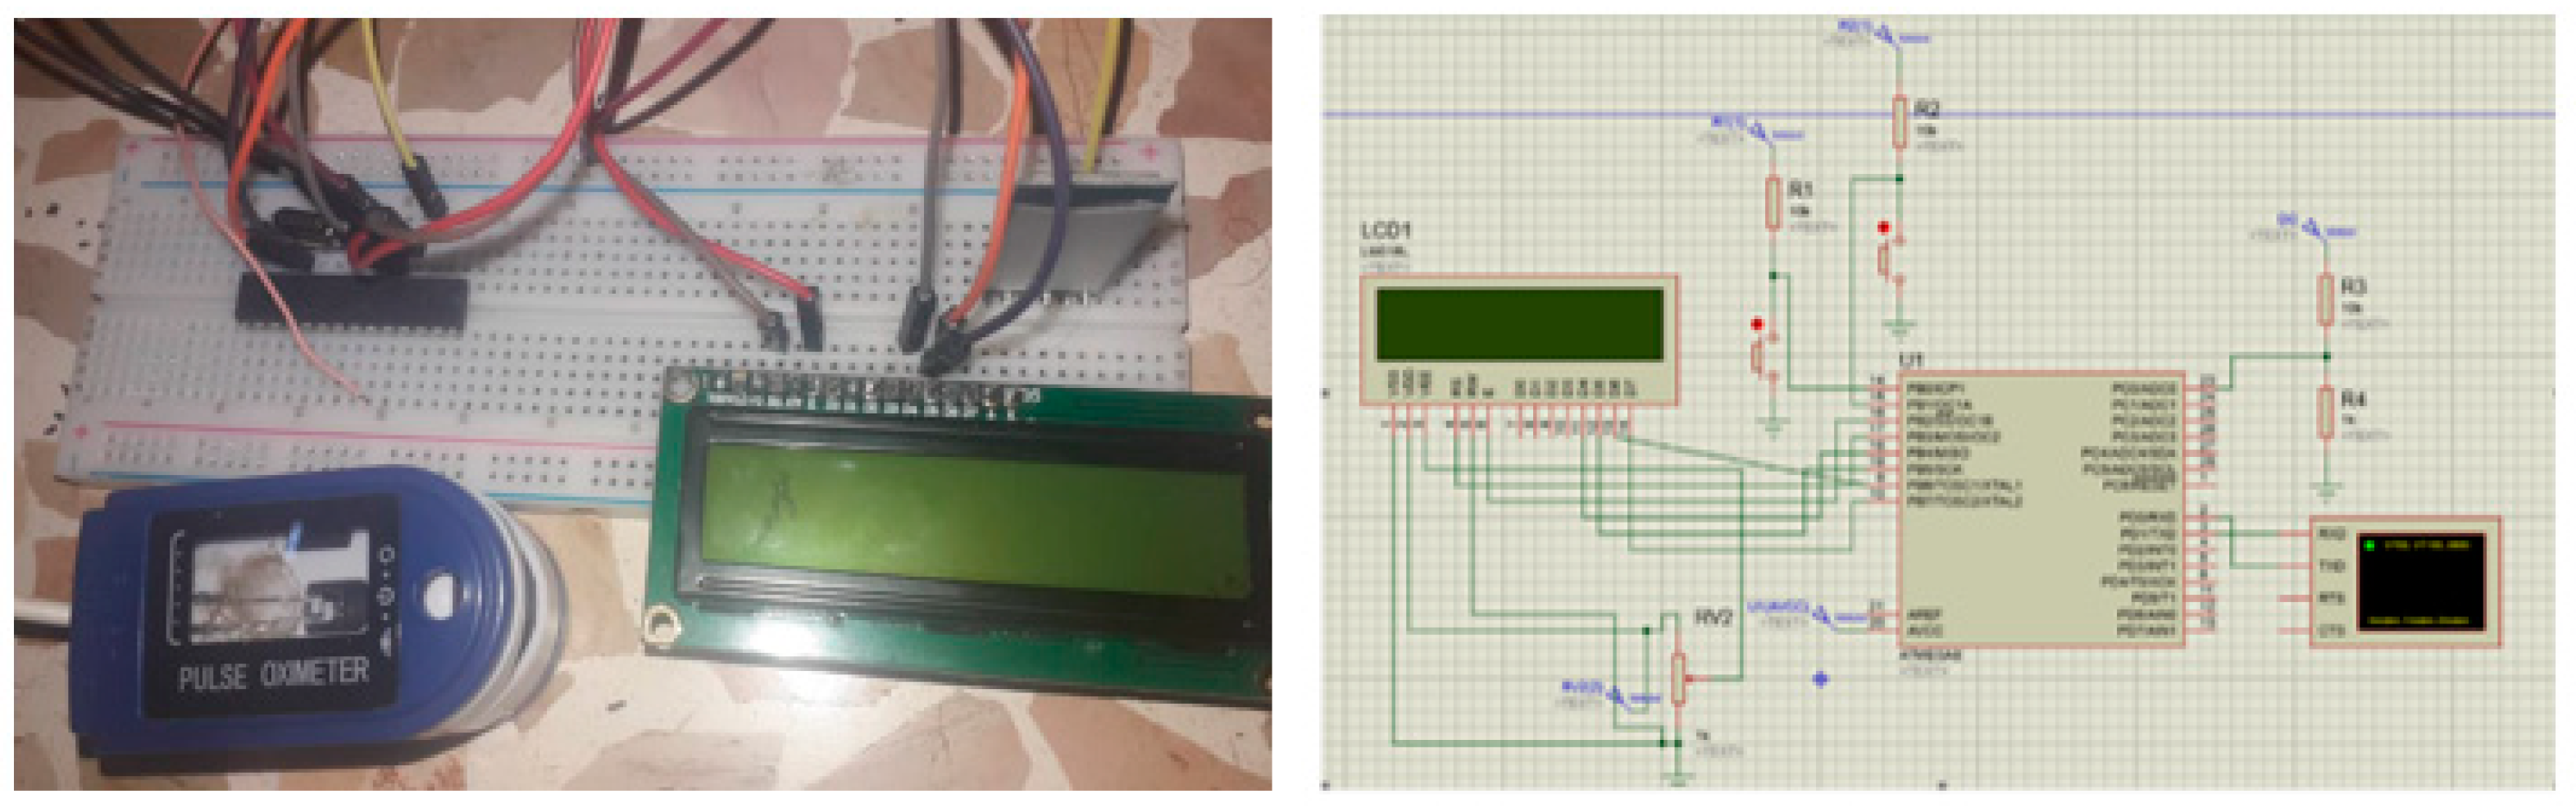
3.1.3. Final Monitoring Circuit
The final monitoring circuit (
Figure 1) was implemented using the previous IR circuit and Arduino Uno controller to convert the analog input from the IR sensor into digital values.
3.2. Fuzzy Logic with CEG
The Clarke error grid, which is approved for clinical evaluation, was used as a marker of differences between test glucose measurement techniques and intravenous blood glucose baseline measurements [
11]. This method uses a Cartesian scheme in which values are predicted by displaying the method under examination on the
y axis, and the values received from the reference method on the
x axis. The country region represents an ideal match between the two, while the points below and above the line indicate the exaggerated estimates and reduced actual values, respectively. Region-A (acceptable) represents glucose values that deviate from the 20% reference value or lie within the blood glucose range (<70 mg/dL). Values within this range are clinically correct, and thus correct clinical diagnosis can be made on their basis. Region-B (benign defects) is above and below region-A. This range represents values that deviate from the baseline after increasing by 20%. Values within zones A and B are clinically acceptable, but values within regions are included. Regions-C and -E are potentially bad and their use can lead to clinically significant errors.
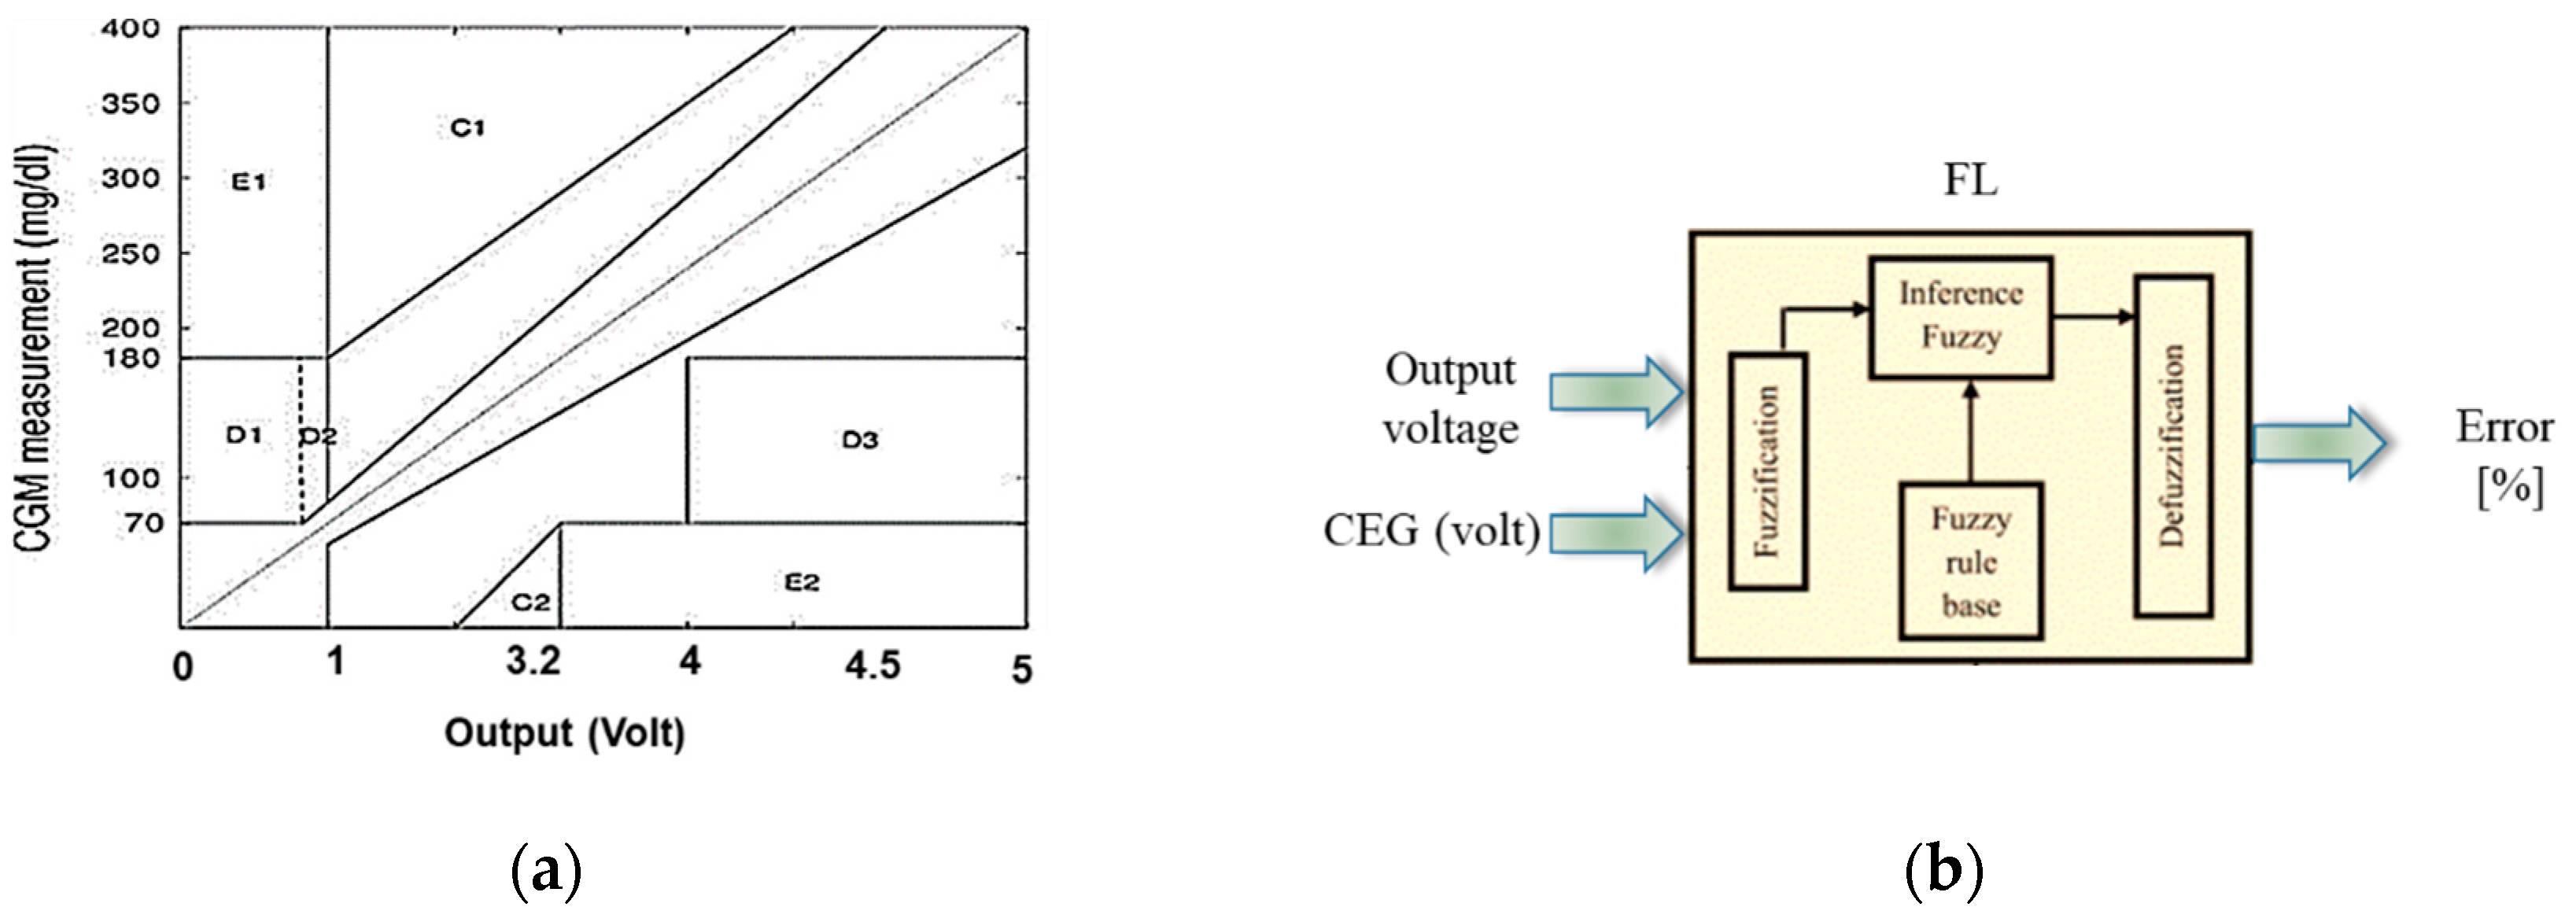
In this study, the horizontal axes of CEG (
Figure 2a) represent the output voltage of Arduino based on preliminary calibration process. The main objective of this methodology is to find the expected error tolerance of glucose concentration, which represents the confidence interval of the estimated glucose value. To estimate the error in the observed glucose, FL (
Figure 2b) was used to evaluate the output voltage from Arduino and the average accuracy of measured voltage based on CEG’s areas (in scale of [0 to 1]).
Fuzzy logic goes through several stages to reach a complete solution as follows:
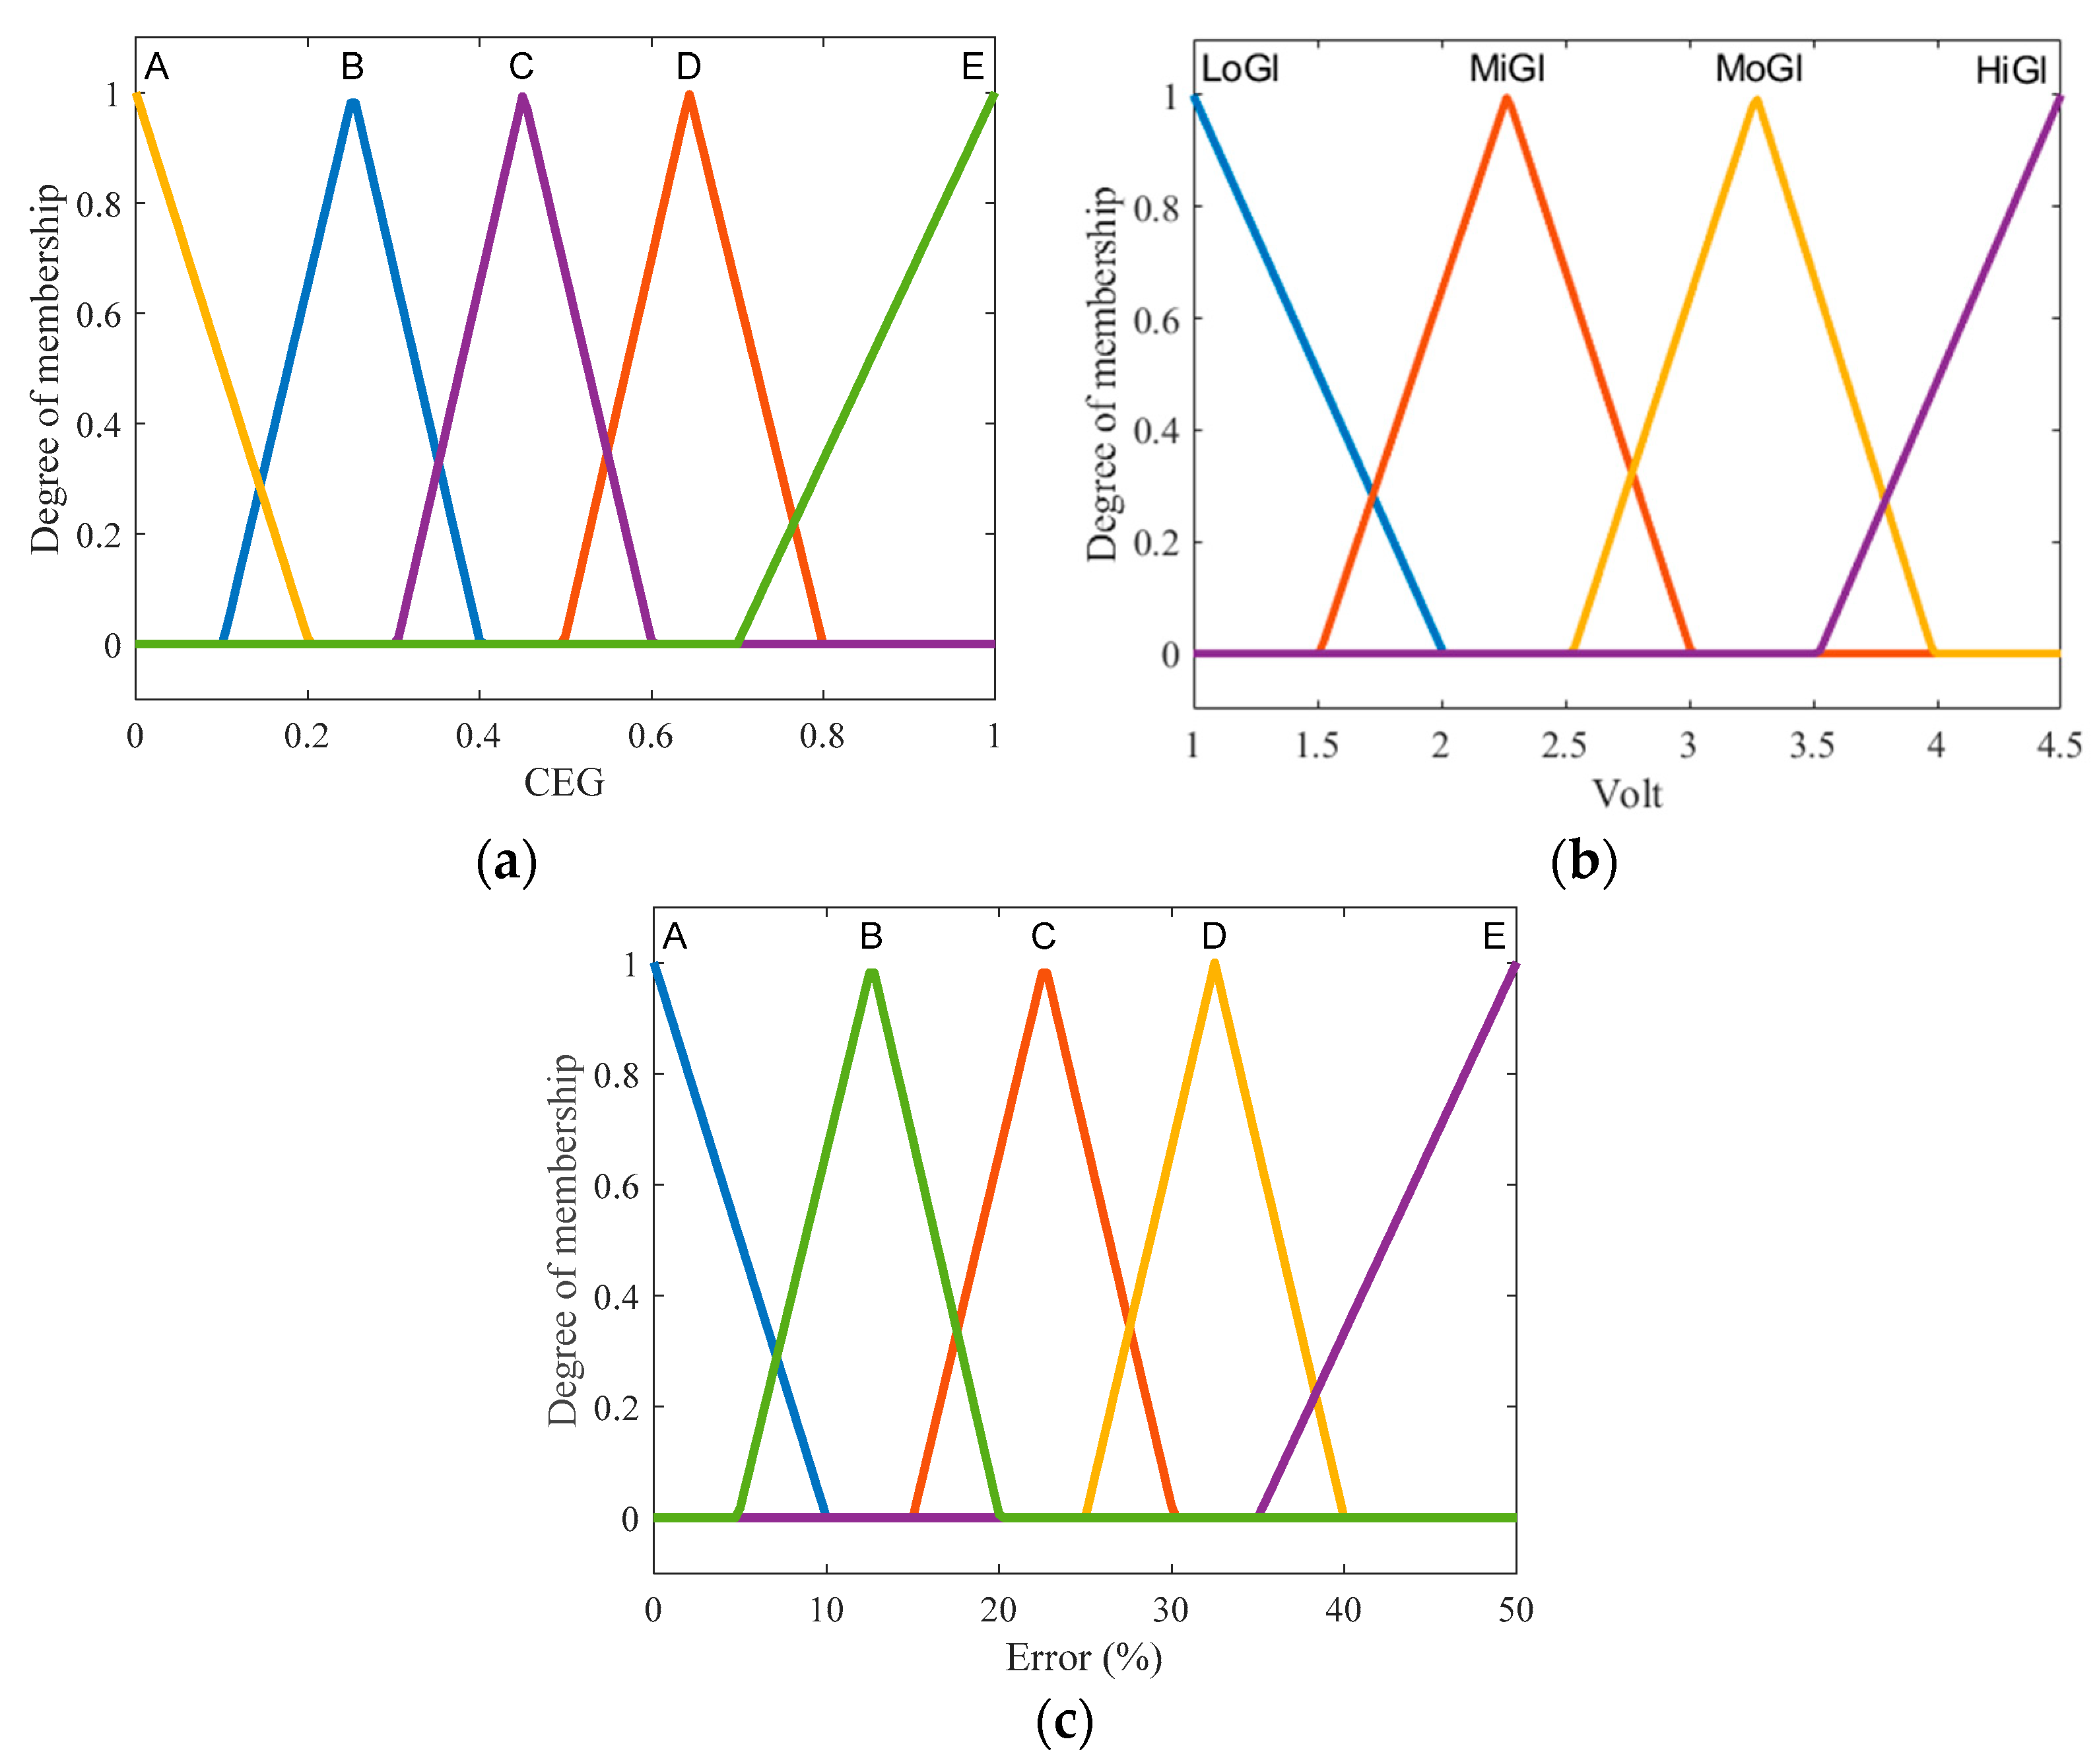
Fuzzification: includes defining the membership functions (MF) for the input variables to determine the degree of truth in each rule. The input contains two variables: Arduino output and voltage accuracy based on the areas of CEG. The MFs of voltage output are shown in (
Figure 3a), where the MFs of output voltage are represented with two triangle functions labelled as low glucose (LoGl) and high glucose (HiGl), and two triangle functions named mild (MiGl) and moderate (MoGl) glucose. The second input contains MFs with (A–E) labels that represent the areas of CEG. The MFs of the output are identical to the second input but the real values, range between 0 and 100 as a percentage of error.
Inference: contains the fuzzy if–then rules. In this study, the fuzzy rules were built based on the experimental observations of glucose and its coordinates on the areas of Clarke grid. The used fuzzy rules include:
If Voltage is LoGl and CEG is A then Error is A.
If Voltage is LoGl and CEG is B then Error is B.
Defuzzification: the “centroid” that depends on the center of gravity is used to obtain the final output, which is the error percentage of glucose concentration.
4. Results and Discussion
4.1. Hardware Design
Non-invasive blood glucose monitoring using IR light is considered to represent a useful and reliable tool for measuring blood sugar levels during daily activities. The IR-based glucose monitoring principle depends on the variant absorption levels of IR light waves by blood, with high or low levels of glucose solution.
To test our device, we conducted a preliminary study on 30 subjects, including 15 subjects with diabetes and 15 healthy controls. We measured their blood glucose levels using our device and a reference device that uses the standard finger-prick method.
Our suggested system based on 940 nm IR light source seemed to be able to produce detectable signals. As shown in
Table 1, we can notice that the recorded signals seem to vary between the subjects, and especially between normal (1.22–2.25 volts) and diabetic (2.9–3.5 volts) subjects. These results concord with the study of Yunos et al. which preferred the use of the IR principle to increase the sensitivity of the measurement and highlighted the accuracy of this method in differentiating between different groups of possible patients [
12].
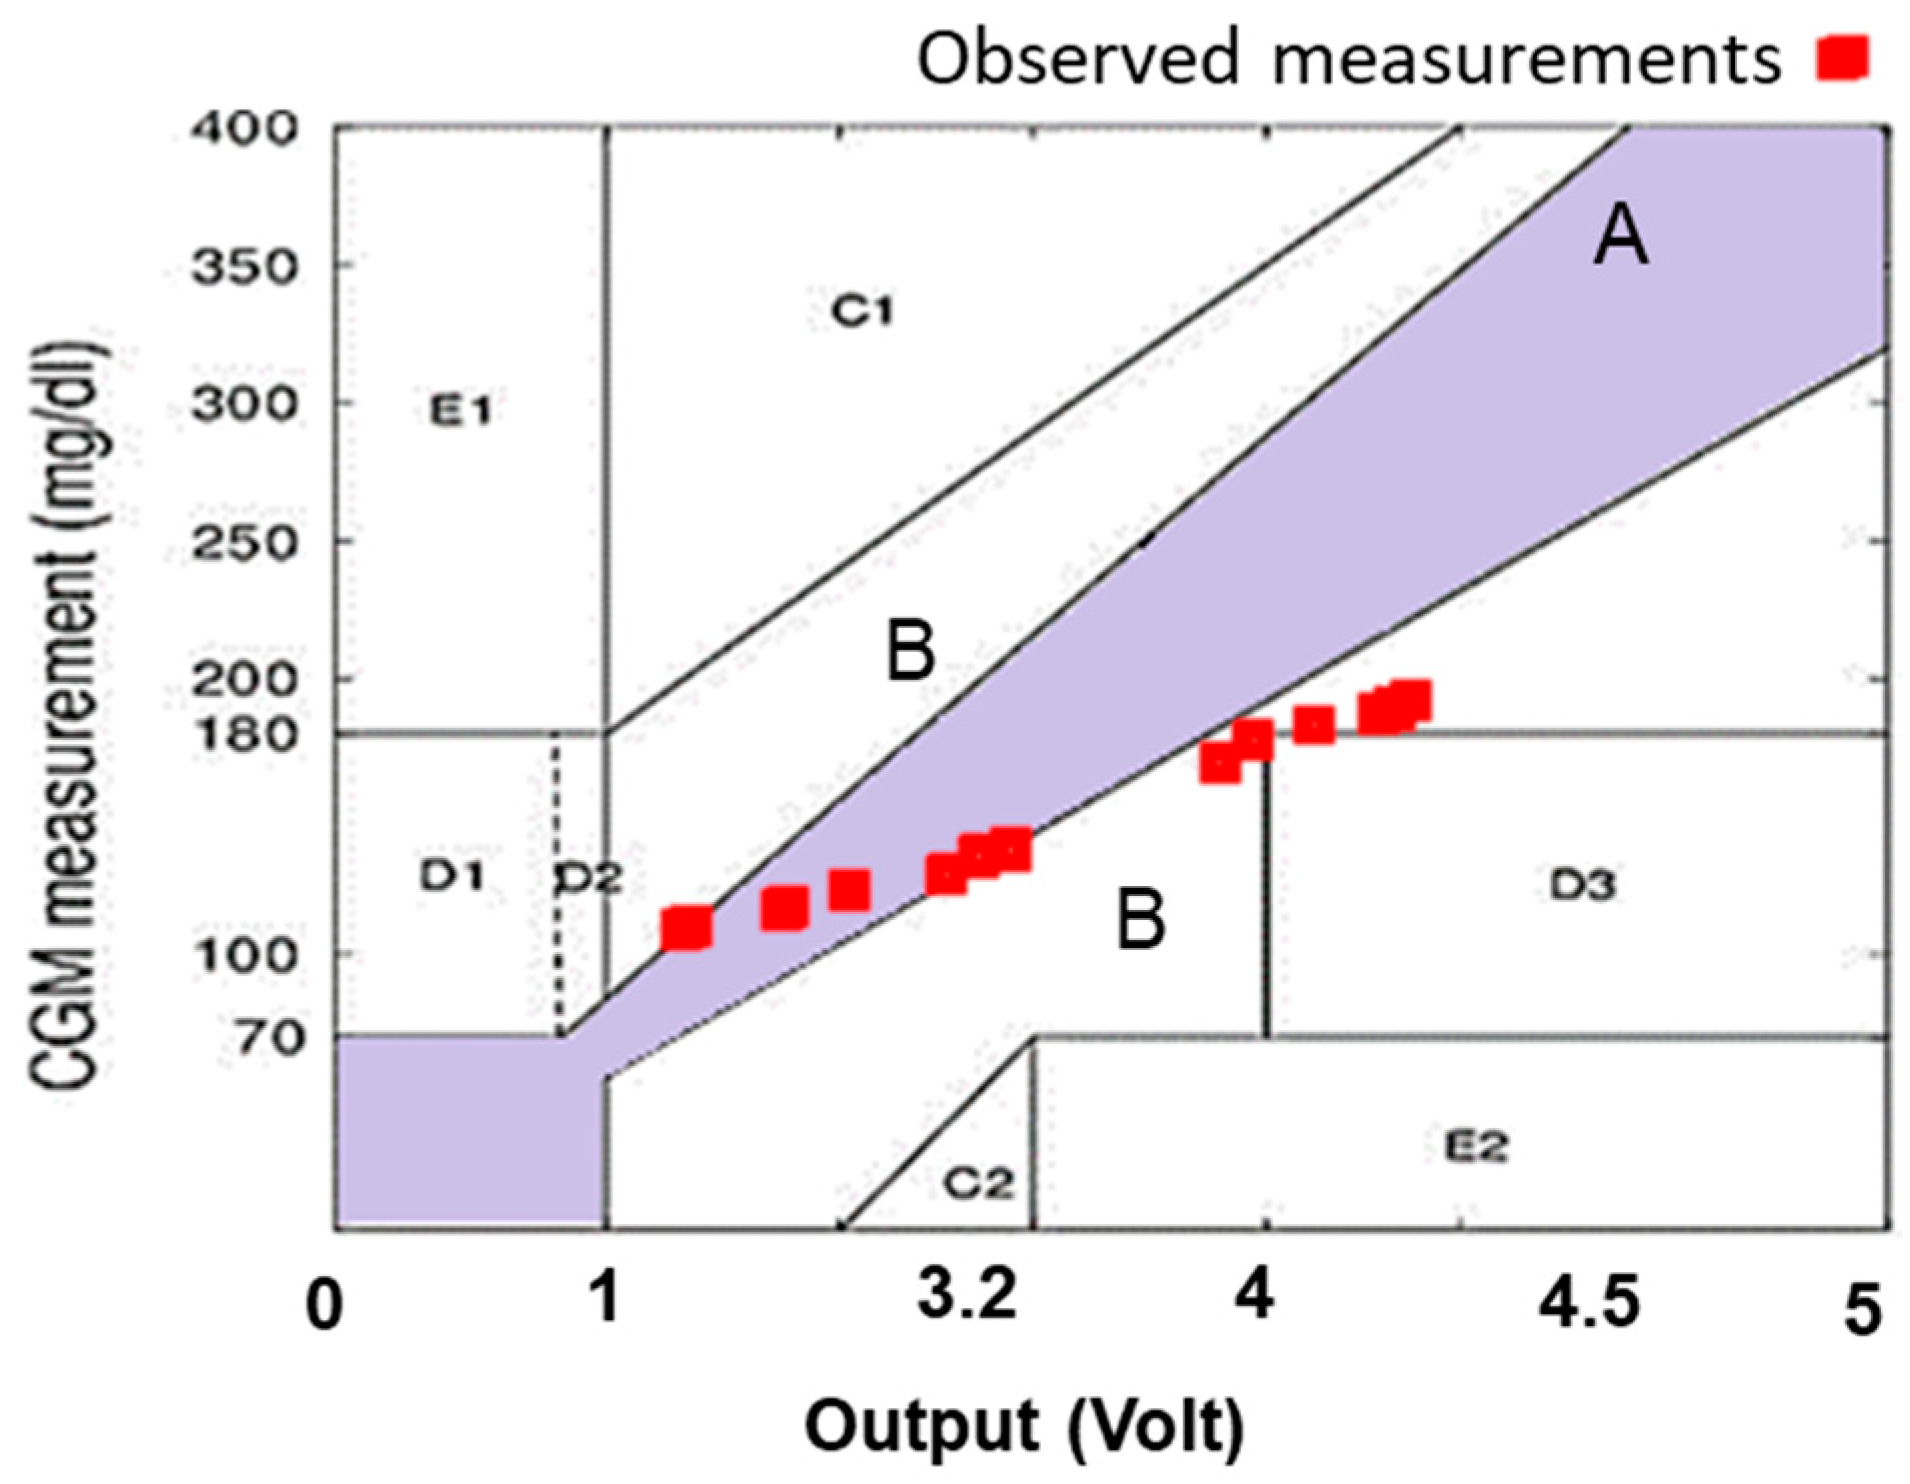
The final measurements of
Table 1 are depicted on CEG as shown in
Figure 4. The values show a not fully satisfactory convergence in the “A” and “B” areas which illustrates the error in estimated glucose level, thus making the utilization of FL necessary to compute the expected tolerance.
4.2. Glucose Measurement Using FL
As shown in
Table 2, we notice that FL could be suggested for errors mapping and validation. The calculated tolerance of glucose using FL output gives a more reliable measurement of the monitor system by determining the expected error. The healthy samples show a glucose level between 104 and 115 (mg/dcl) with an error of less than ±10%. The diabetic samples mostly show an error in glucose between ±5% and ±10%.
The results showed that the finger probe can measure glucose in a non-invasive and painless manner with an acceptable accuracy and reliability. This result concords with the finding of Mehmood et al. study which reported promising results with the use of fuzzy logic in artificial pancreas control strategies [
13].
In this study, we tried to introduce the principle of FL-based Clarke error grids. The finger probe consisted of an infrared emitter and detector that were attached to the fingertip and connected to an Arduino microcontroller. Many studies preferred the use of fuzzy logic to perform glucose levels measurement [
13,
14]. The FL algorithm seemed to evaluate with an accepted rate of accuracy and reliability of the glucose measurement using the Clarke error grid. It provided a graphical method with which to compare different methods of glucose measurements. By dividing the measurement space into five zones, A, B, C, D, and E, we were able to classify the measurements from the most accurate measurements to the most erroneous measurements, leading to dangerous outcomes. Fuzzy logic represented a flexible and realistic representation of the measurement errors. Based on the assignment of membership to each zone of Clarke error grid, the FL algorithm was able to produce more accurate glucose measurements [
15].
5. Conclusions
The achievement of on-invasive blood glucose monitoring is a desirable goal for many diabetic patients who need to measure their glucose levels frequently and accurately. However, most of the existing methods are either invasive or require expensive and complex equipment. Fuzzy logic is a mathematical technique that can handle uncertainty and imprecision in data, and has been applied to various biomedical problems, such as artificial pancreas control and glucose measurement using heart rate variability. FL can also be used to design simple and robust measurement devices that can adapt to different physiological conditions and environmental factors.
In this paper, we presented a contribution related to the use of FL measurements to estimate the blood glucose level from the fingertip. To test our device, we conducted a preliminary study on 30 subjects, including 15 subjects with diabetes and 15 healthy controls. We measured their blood glucose levels using our device and a reference device that uses the standard finger-prick method. We performed the measurements before and after a meal, at intervals of 15 min, for a total of 12 measurements per subject. We then compared the FL readings with the reference readings using the Clarke error grid analysis, which is a widely used method to evaluate the accuracy of glucose meters.
The results show that our device has a high accuracy and reliability, with an error rate of less than 3% according to the EGA. Out of 360 readings, 97.5% fell into zone A, 2.2% into zone B, and 0.3% into zone C. No readings fell into zones D or E. This indicates that our device can provide clinically accurate and acceptable estimates of blood glucose level without causing any harm or discomfort to the user.
We conclude that our device is a promising alternative to invasive methods of blood glucose monitoring, especially for diabetic patients who need frequent measurements. Our device uses FL measurements to estimate the blood glucose level from the skin impedance, which is a simple and non-invasive technique that can be implemented in a portable device. Our device has high accuracy and reliability, with an error rate of less than 3% according to the Clarke error grid analysis. This method of using FL with Clarke error grid seems to provide a more confident and precise output for this type of portable device.
Author Contributions
Conceptualization, methodology, data curation, software: M.A.D., A.D. and A.S.; investigation, visualization, formal analysis, validation, writing—original draft M.A.D., A.S. and A.L.; supervision, project administration, resources, writing—review and editing: M.A.D., E.I. and J.D. All authors have read and agreed to the published version of the manuscript.
Funding
This research received no external funding.
Institutional Review Board Statement
The project was approved by the local ethical committee in Al Andalus University Hospital (protocol code: 142A; date of approval: 10 November 2022), Tartous P.O. Box 101, Syria.
Informed Consent Statement
Informed consent was obtained from all subjects involved in the study.
Data Availability Statement
The datasets generated and/or analyzed during the current study are available from the corresponding author upon reasonable request.
Conflicts of Interest
The authors declare no conflict of interest.
References
- Carrizzo, A.; Izzo, C.; Oliveti, M.; Alfano, A.; Virtuoso, N.; Capunzo, M.; Di Pietro, P.; Calabrese, M.; De Simone, E.; Sciarretta, S.; et al. The Main Determinants of Diabetes Mellitus Vascular Complications: Endothelial Dysfunction and Platelet Hyperaggregation. Int. J. Mol. Sci. 2018, 19, 2968. [Google Scholar] [CrossRef] [PubMed]
- Poznyak, A.V.; Litvinova, L.; Poggio, P.; Sukhorukov, V.N.; Orekhov, A.N. Effect of Glucose Levels on Cardiovascular Risk. Cells 2022, 11, 3034. [Google Scholar] [CrossRef] [PubMed]
- Tang, L.; Chang, S.J.; Chen, C.-J.; Liu, J.-T. Non-Invasive Blood Glucose Monitoring Technology: A Review. Sensors 2020, 20, 6925. [Google Scholar] [CrossRef] [PubMed]
- Valsalan, P.; Hasan, N.U.; Farooq, U.; Zghaibeh, M.; Baig, I. IoT Based Expert System for Diabetes Diagnosis and Insulin Dosage Calculation. Healthcare 2023, 11, 12. [Google Scholar] [CrossRef] [PubMed]
- Schubert-Olesen, O.; Kröger, J.; Siegmund, T.; Thurm, U.; Halle, M. Continuous Glucose Monitoring and Physical Activity. Int. J. Environ. Res. Public Health 2022, 19, 12296. [Google Scholar] [CrossRef] [PubMed]
- Delbeck, S. and Heise, H.M. Evaluation of opportunities and limitations of mid-infrared skin spectroscopy for noninvasive blood glucose monitoring. J. Diabetes Sci. Technol. 2021, 15, 19–27. [Google Scholar] [CrossRef] [PubMed]
- Paul, B.; Manuel, M.P.; Alex, Z.C. Design and development of non invasive glucose measurement system. In Proceedings of the 2012 1st International Symposium on Physics and Technology of Sensors (ISPTS-1), Pune, India, 7–10 March 2012; pp. 43–46. [Google Scholar] [CrossRef]
- Abd Salam, N.A.B.; bin Mohd Saad, W.H.; Manap, Z.B.; Salehuddin, F. The evolution of non-invasive blood glucose monitoring system for personal application. J. Telecommun. Electron. Comput. Eng. 2016, 8, 59–65. [Google Scholar]
- Lin, T.; Gal, A.; Mayzel, Y.; Horman, K.; Bahartan, K. Non-invasive glucose monitoring: A review of challenges and recent advances. Curr. Trends Biomed. Eng. Biosci 2017, 6, 555696. [Google Scholar] [CrossRef]
- Susana, E.; Ramli, K.; Purnamasari, P.D.; Apriantoro, N.H. Non-Invasive Classification of Blood Glucose Level Based on Photoplethysmography Using Time–Frequency Analysis. Information 2023, 14, 145. [Google Scholar] [CrossRef]
- Anand, P.K.; Shin, D.R.; Memon, M.L. Adaptive Boosting Based Personalized Glucose Monitoring System (PGMS) for Non-Invasive Blood Glucose Prediction with Improved Accuracy. Diagnostics 2020, 10, 285. [Google Scholar] [CrossRef] [PubMed]
- Mohamad Yunos, M.F.A.; Nordin, A.N. Non-Invasive Glucose Monitoring Devices: A Review. Bull. Electr. Eng. Inform. 2020, 9, 2609–2618. [Google Scholar] [CrossRef]
- Sasi, A.Y.B.; Elmalki, M.A. A Fuzzy Controller for Blood Glucose-Insulin System. J. Sign. Inf. Process. 2013, 04, 111–117. [Google Scholar] [CrossRef]
- Mehmood, S.; Ahmad, I.; Arif, H.; Ammara, U.; Majeed, A. Artificial Pancreas Control Strategies Used for Type 1 Diabetes Control and Treatment: A Comprehensive Analysis. Appl. Syst. Innov. 2020, 3, 31. [Google Scholar] [CrossRef]
- Escalante-Sánchez, A.; Barrera-Cortés, J.; Poggi-Varaldo, H.M.; Ponce-Noyola, T.; Baruch, I.S. A Soft Sensor Based on Online Biomass Measurements for the Glucose Estimation and Control of Fed-Batch Cultures of Bacillus Thuringiensis. Bioprocess Biosyst. Eng. 2018, 41, 1471–1484. [Google Scholar] [CrossRef] [PubMed]
| Disclaimer/Publisher’s Note: The statements, opinions and data contained in all publications are solely those of the individual author(s) and contributor(s) and not of MDPI and/or the editor(s). MDPI and/or the editor(s) disclaim responsibility for any injury to people or property resulting from any ideas, methods, instructions or products referred to in the content. |
© 2023 by the authors. Licensee MDPI, Basel, Switzerland. This article is an open access article distributed under the terms and conditions of the Creative Commons Attribution (CC BY) license (https://creativecommons.org/licenses/by/4.0/).


 ,
, 


