Proceeding Paper

Simple Chromatographic Sensor with UV LED Optical Detection for Monitoring Patients Treated with Continuous Ambulatory Peritoneal Dialysis †

1
Department of Photonics, Saint Petersburg Electrotechnical University “LETI”, 197022 Saint Petersburg, Russia
2
AS Ldiamon, 50411 Tartu, Estonia
3
Chair of Veterinary Biomedicine and Food Hygiene, Estonian University of Life Sciences, 51006 Tartu, Estonia
4
Jeko Disain OÜ, 51014 Tartu, Estonia
5
Dialysis Unit, Saint Petersburg City Mariinsky Hospital, 191014 Saint Petersburg, Russia
6
Chair of Internal Diseases, Clinical Pharmacology and Nephrology, North-Western State Medical University named after I.I. Mechnikov, 191015 Saint Petersburg, Russia
7
Laboratory of Neuroecology, Federal State Budgetary Scientific Institution “Institute of Experimental Medicine” (FSBSI “IEM”), 197376 Saint Petersburg, Russia
*
Author to whom correspondence should be addressed.
Presented at the 3rd International Electronic Conference on Biosensors, 8–21 May 2023; Available online: https://iecb2023.sciforum.net.
Eng. Proc. 2023, 35(1), 25; https://doi.org/10.3390/IECB2023-14595
Published: 9 June 2023
(This article belongs to the Proceedings of The 3rd International Electronic Conference on Biosensors)

Abstract

:
A novel simple optical sensor based on fast protein liquid chromatography was developed and tested for monitoring end stage renal disease (ESRD) patients treated with continuous ambulatory peritoneal dialysis (CAPD). The device provides direct determination of proteins and lower molecular weight metabolites in effluent peritoneal dialysate using ultraviolet (UV) photometric detection at the wavelengths 285 nm or 260 nm with deep ultraviolet light-emitting diodes. The sensor was calibrated with bovine serum albumin and nucleotides standard solutions. Chromatograms of peritoneal dialysate samples taken from a group of 28 ESRD patients were processed and approximated by a set of split-Gaussian functions. All chromatograms show three overlapping peaks: the first one represents proteins; the other two peaks probably correspond to mid- and low molecular weight metabolites. Strong correlation was reveled between the area of the first peak and total protein concentration determined by a standard biochemical assay, this makes possible estimation of peritoneal protein loss with a reasonable precision less than 15%. The area of the second peak correlated with dialysate optical density at a wavelength 355–365 nm, associated with the UV absorption of advanced glycation end (AGE) products. The third peak correlated with the optical density of the eluate at a wavelength 255–265 nm, associated with the UV absorption of purines and pyrimidines. Thus, we demonstrated the possibility of estimation of proteins and lower molecular weight metabolites in effluent peritoneal dialysate with the compact and affordable chromatographic optical sensor.

1. Introduction

Chronic kidney disease (CKD) is a long-term and often slow-developing illness accompanied by a gradual deterioration of kidney function, which in some patients can progress to end-stage renal failure. CKD is one of the main causes of mortality among all non-communicable diseases in developed countries with relatively high life expectancy [1]. In the absence of renal replacement therapy (RRT), uremic intoxication occurs, which eventually leads to a fatal outcome. The methods of treatment include kidney transplantation, hemodialysis (HD), and peritoneal dialysis (PD). Currently about 10% of all patients, which require RRT, receive treatment with continuous ambulatory peritoneal dialysis (CAPD) at home for the following reasons: intolerance to HD, limited mobility, remoteness of the place of residence from the nearest dialysis center, hospital policy, or personal preferences [2,3].
CAPD is a method of RRT that does not require highly qualified medical staff and expensive equipment, so it can be performed at home by patients themselves or their caregivers. As with any RRT modality PD has serious complications and side-effects, e.g., high peritoneal protein loss [4,5,6,7] and high risk of infection (dialysis peritonitis) [8,9]. Necessary measures to prevent or at least provide early treatment of these complications imply constant monitoring of CAPD outpatients, including assessment of peritoneal protein loss and other parameters of effluent dialysate. Conventional clinical laboratory methods are generally intended for analysis of blood and urine, not optimized for peroneal dialysate, and not suitable for at home testing [10]. As a possible alternative a novel simple optical sensor based on fast protein liquid chromatography with ultraviolet (UV) photometric detection was developed and tested for monitoring end stage renal disease patients treated with CAPD.

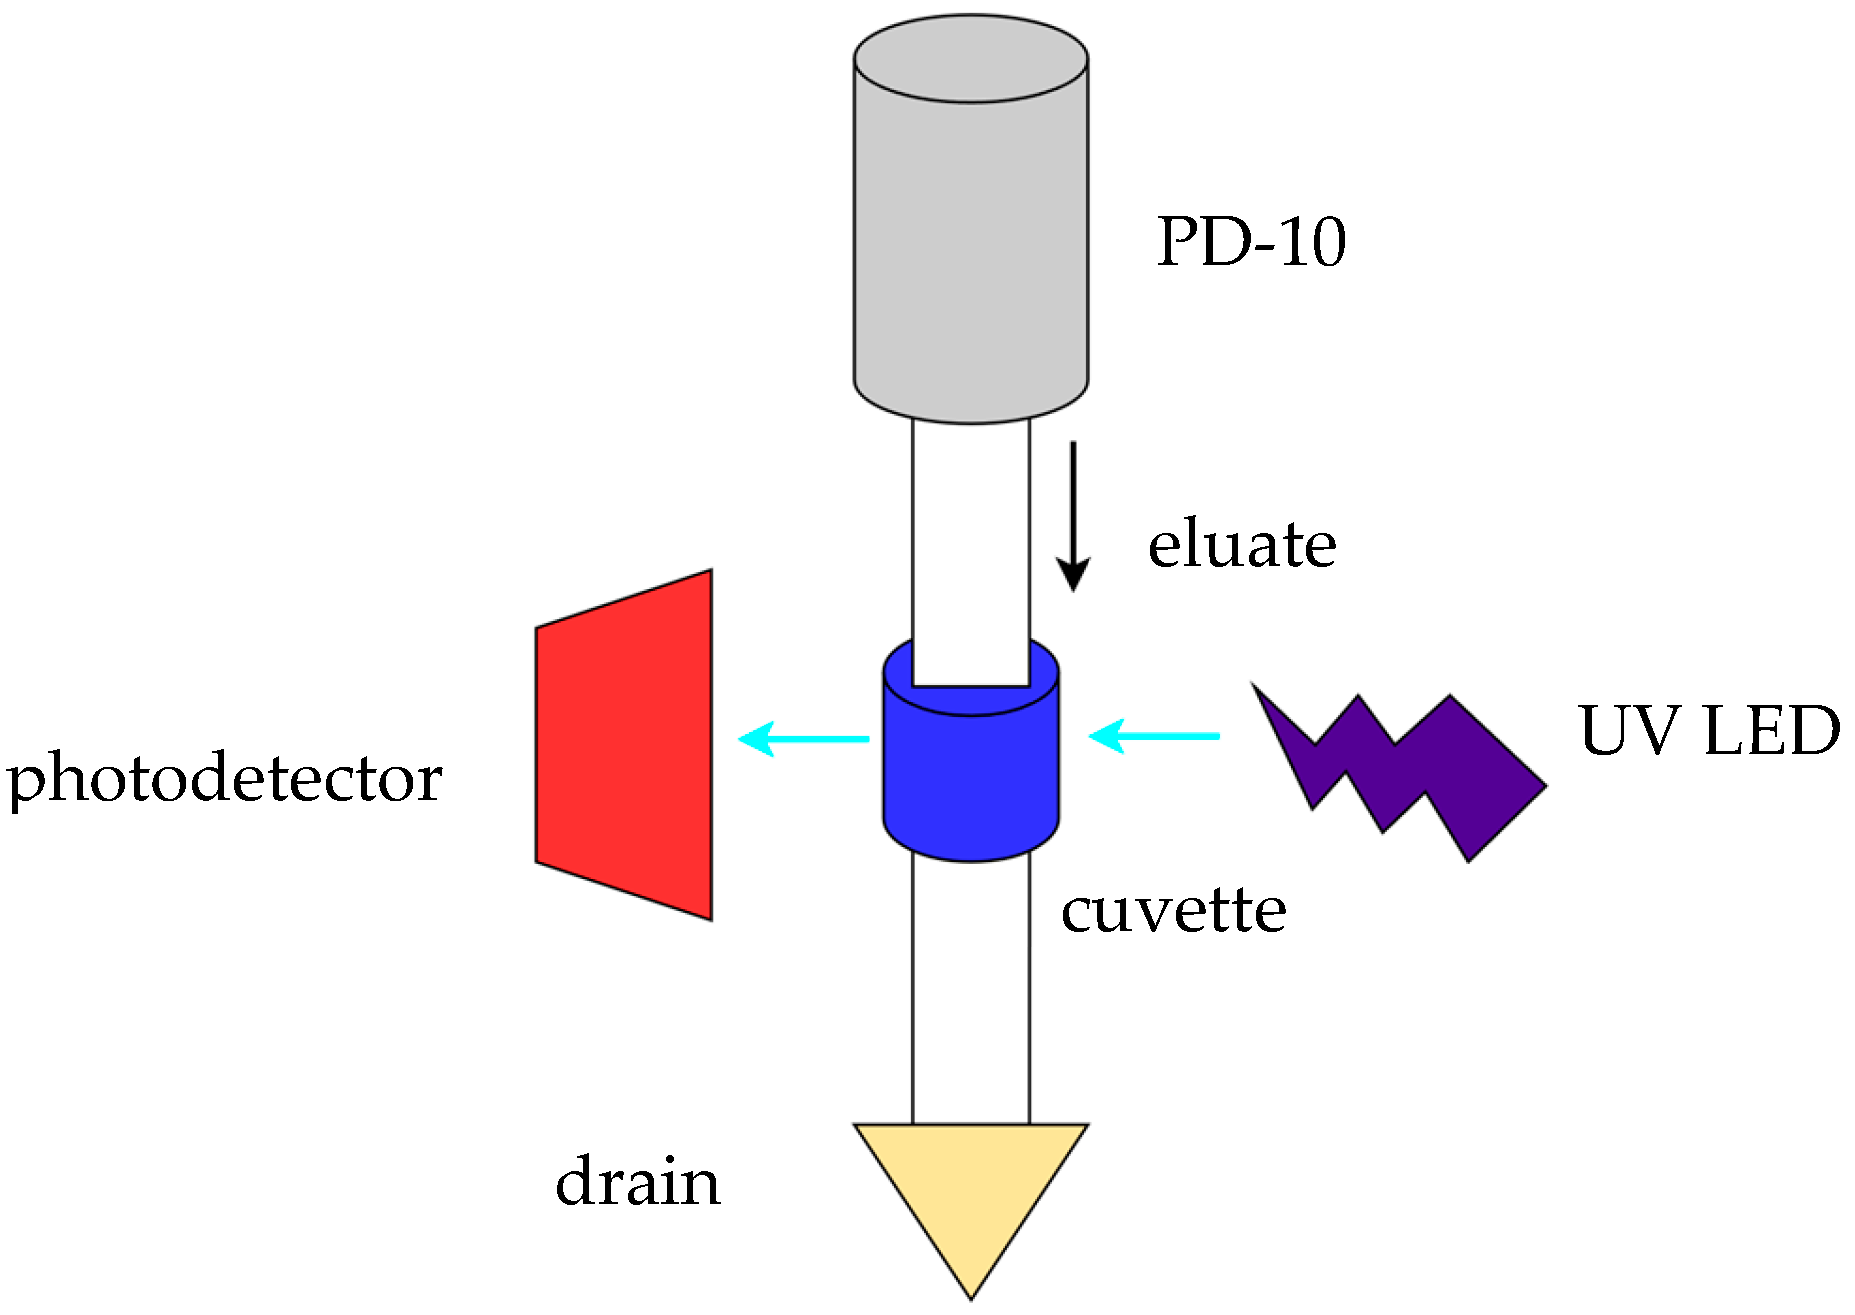
2. Materials and Methods

The sensor uses affordable PD-10 desalting columns (Code No. 17-0851-01) from GE Healthcare® Bio-Sciences AB (Uppsala, Sweden) with Sephadex G-25 Medium chromatographic gel to separate proteins from mid- and low molecular weight metabolites in effluent peritoneal dialysate according to the principles of fast protein liquid chromatography (FPLC) [11,12]. The instrument employs photometric detection at the wavelengths 285 nm (optimized for proteins) or 260 nm (optimized for nucleotides, nucleosides, purines, and pyrimidines related substances) with a deep UV light-emitting diode (LED) as a solid-state light source and a visible-blind UV photodiode as a photodetector. Chromatograms are recorded by direct measurement of the UV absorption of eluate flowing from the PD-10 column and passing through the quartz cuvette (Figure 1). A more detailed description of the sensor was reported earlier [13,14,15].
The instrument can be defined as a chemical sensor employing chromatographic separation and optical detection, which is capable of quantitative determination of biological molecules, i.e., proteins, nucleic acids, middle- and low molecular weight metabolic products. Such devices do not formally belong to the class of biosensors due to the fact that they do not incorporate a biointerface and cannot provide as high selectivity as real biosensors. Nevertheless, similar systems are often considered in the context of biosensors because they perform the same functions and can successively substitute or supplement biosensors in biomedical, environmental, or industrial applications.
The measurement procedure is as follows: after column regeneration with a small amount (25 mL) of TRIS buffer, a sample of effluent peritoneal dialysate is introduced into the column, retained for 20–40 s (so that dialysate is absorbed into the gel), and another 25 mL of buffer is added. Over the next 10–15 min, the optical signal I(t) is recorded by the photodetector at the wavelengths of 260 and 285 nm. In accordance with the Beer-Bouguer-Lambert law, optical absorption a(t) is calculated as follows:
a t = l o g I m a x I t
where Imax—the reference signal, which is proportional to the intensity of UV light transmitted by the cuvette with blank buffer recorded at the beginning of chromatogram processing.
The residual samples of effluent peritoneal dialysate taken from 28 CAPD patients during regular hospital visits were provided by the Mariinsky City Hospital (Saint Peterburg, Russia). The study was coordinated and approved by the Institute of Experimental Medicine (Saint Peterburg, Russia); the permission from the Institute Ethics Committee confirming that it meets ethical standards was obtained, and patients’ personal information was not disclosed by the hospital. Total protein concentration in the samples was determined by the calorimetric photometric method using the Abbott Architect c8000 biochemical analyzer.
All PD chromatograms show three overlapping peaks: the first corresponds to proteins; the other two peaks probably correspond to medium and low molecular weight metabolites. Absorption a(t) could be approximated by a series of split Gaussian functions:
a t = n = 1 N f t , t m a x n , A n , σ l e f t n , σ r i g h t n , f t , t m a x n , A n , σ l e f t n , σ r i g h t n = A n exp t t m a x n 2 2 σ l e f t n 2 , t < t m a x n A n exp t t m a x n 2 2 σ r i g h t n 2 , t t m a x n
where A n —the amplitude of the nth peak, t m a x n —the elution time for the nth peak, σ l e f t n —the width of the left half of the nth peak, σ r i g h t n —the width of the right half of the nth peak, N—the number of peaks.
The coefficients t m a x n ,   A n ,   σ l e f t n ,   σ r i g h t n are estimated using iterative least squares regression by the built-in MATLAB nlinfit() function.
It was proven empirically that the area of the right half-peak Sr found from a corresponding Bi-Gaussian function gives the most accurate information about protein concentration:
S r = t m a x n A n exp t t m a x n 2 2 σ r i g h t n 2 d t
The dialysate samples were also analyzed using the AvaSpec-2048 fiberoptic UV spectrophotometer with a deuterium lamp as a UV source. UV spectra were recorded in the 200–400 nm spectral range with the spectral resolution of about 1 nm.

3. Results

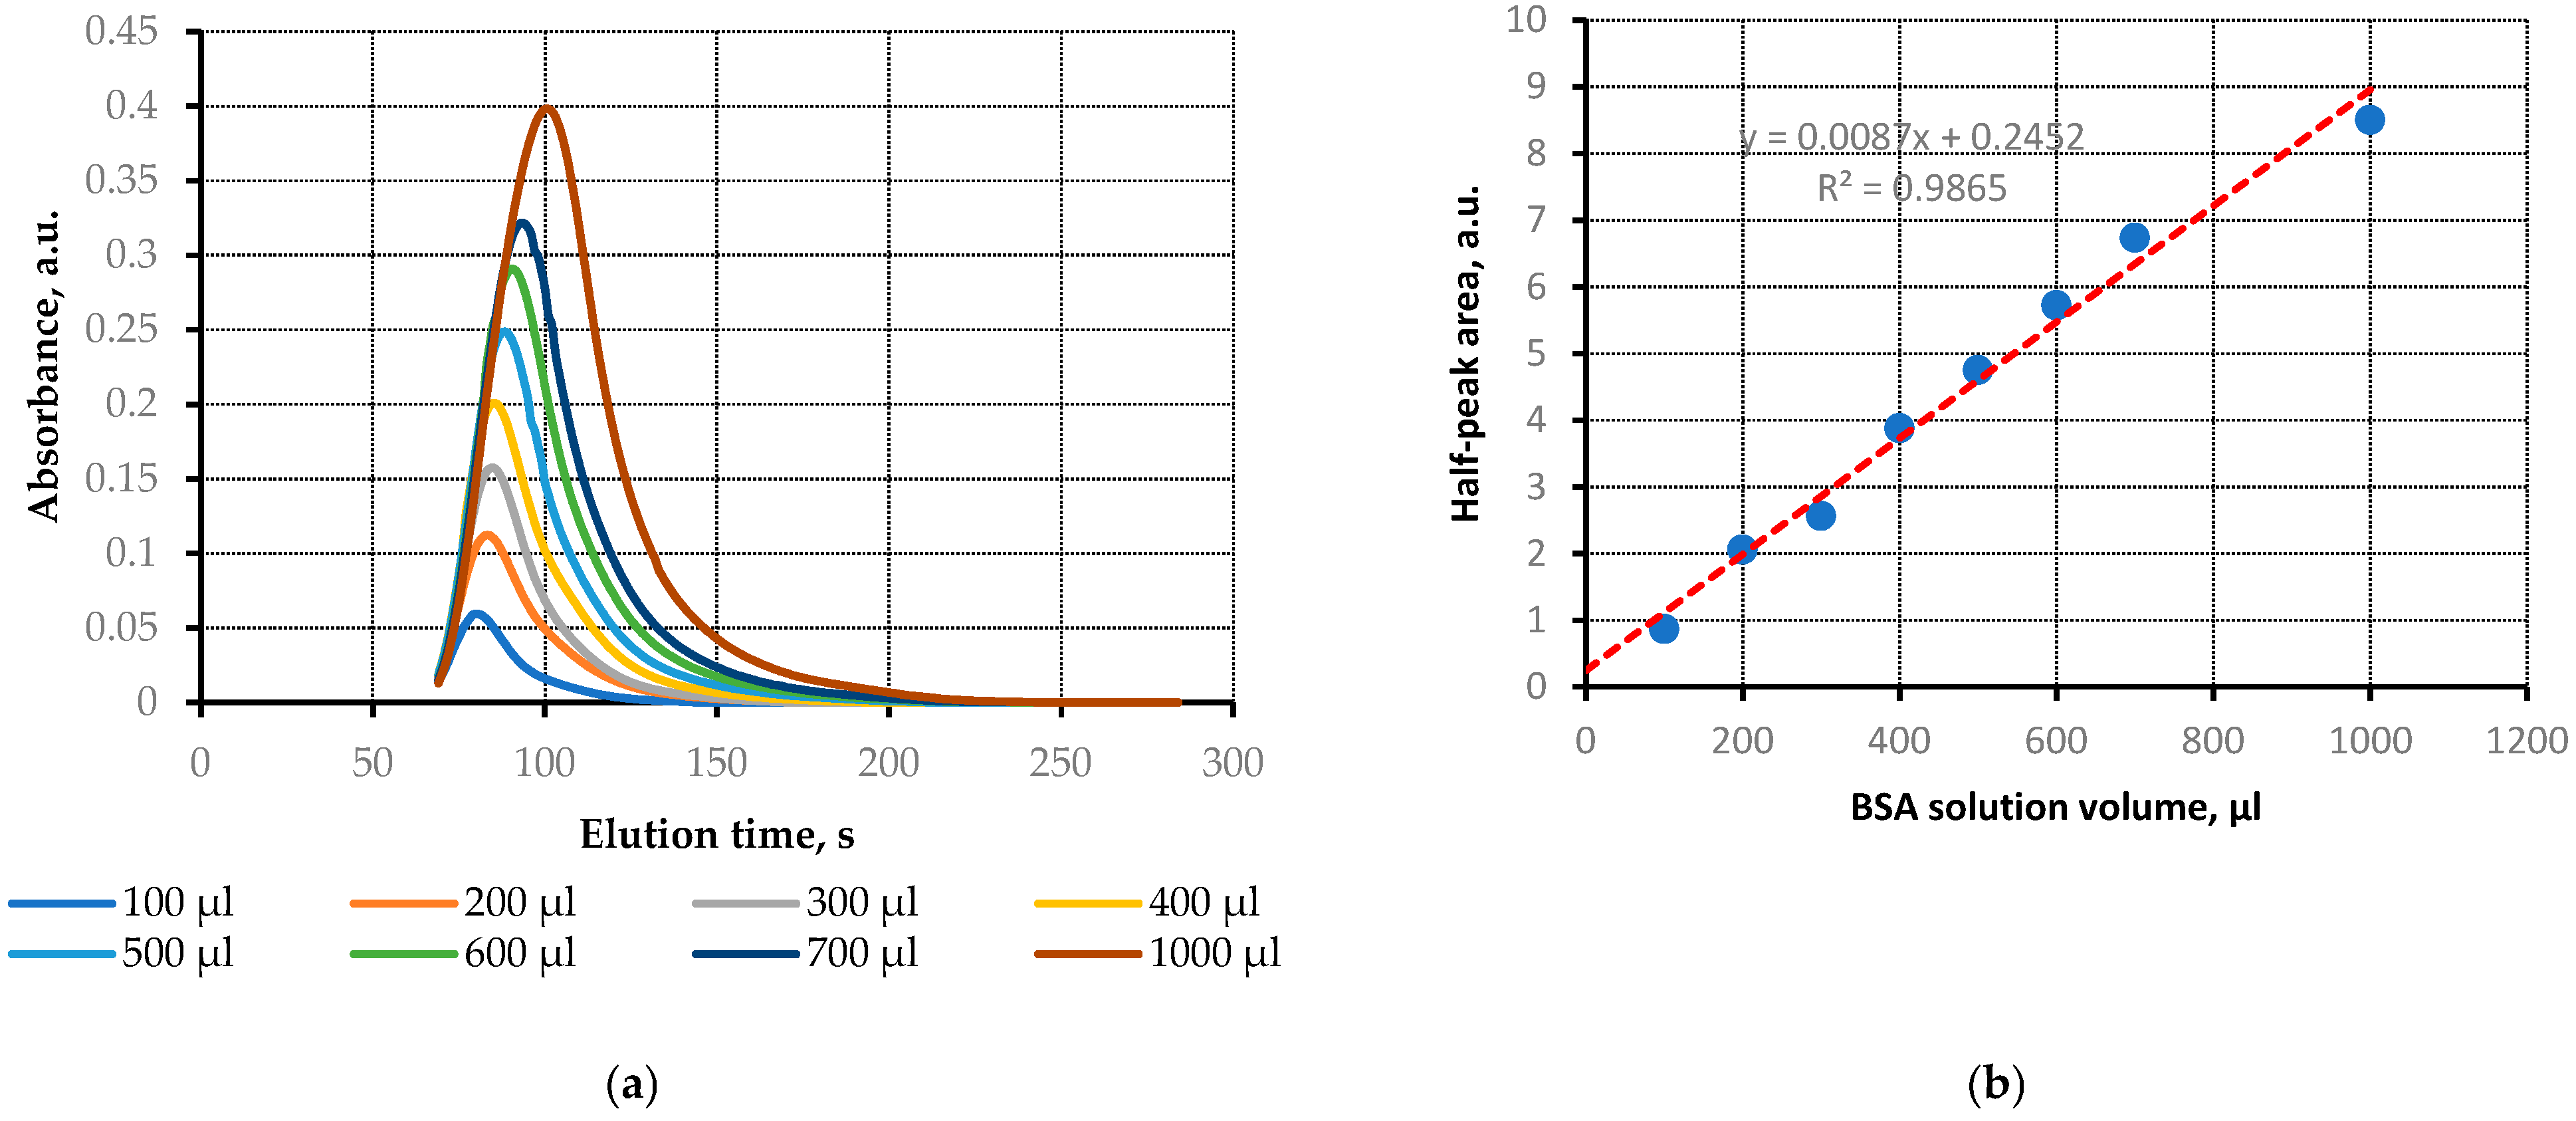
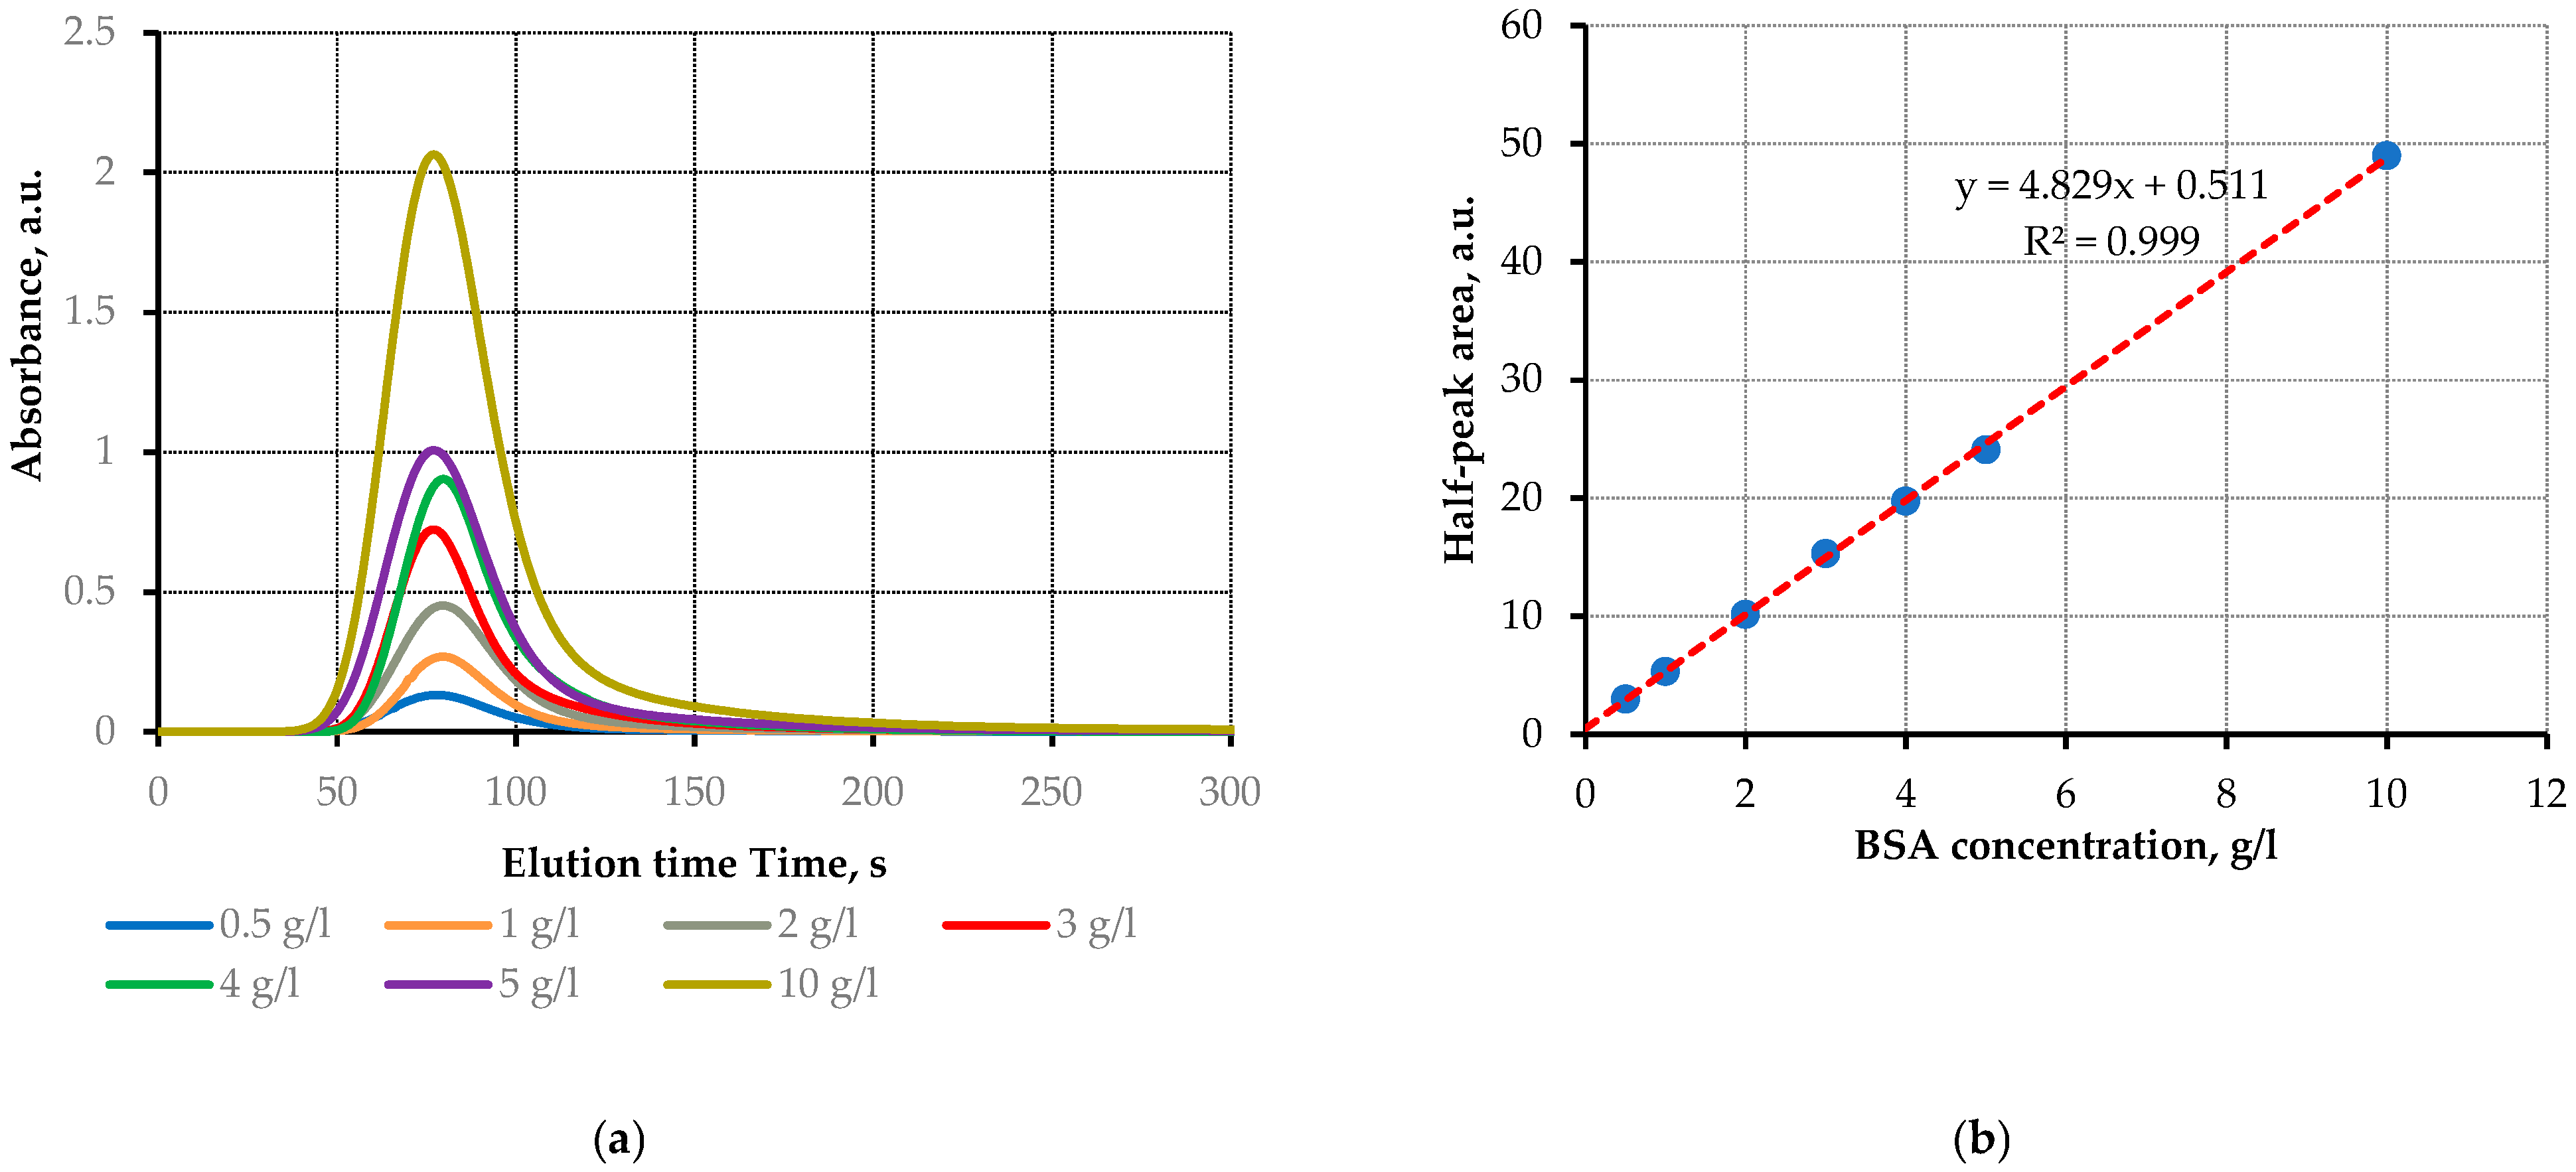
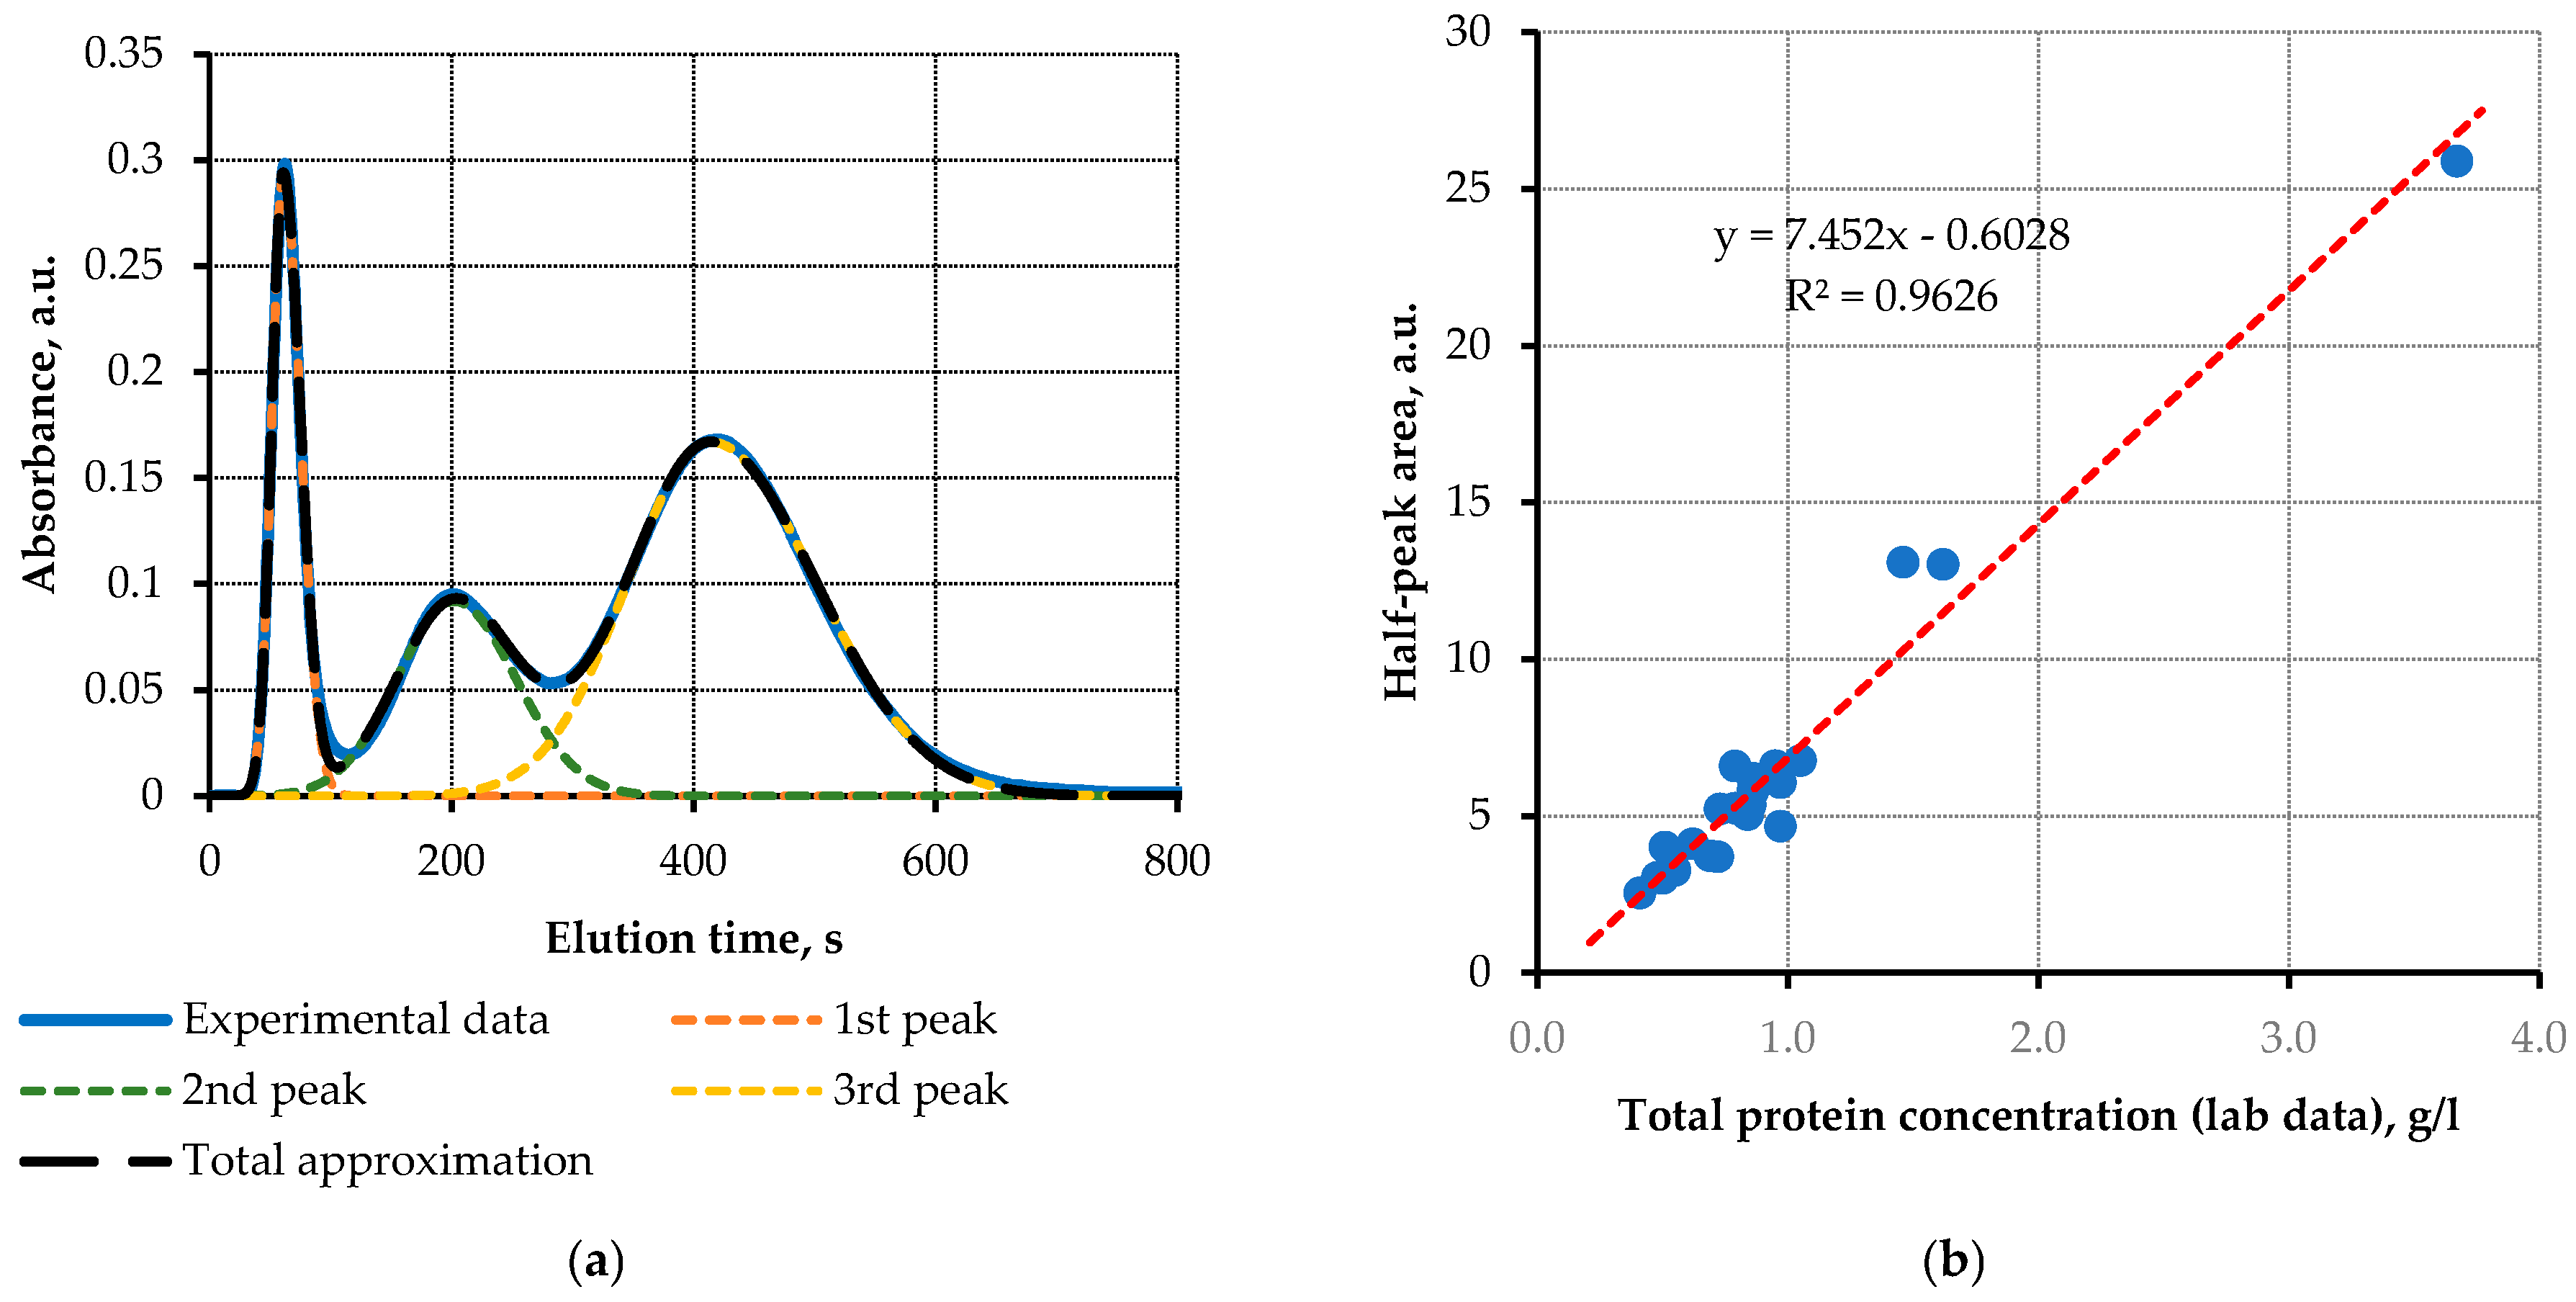
3.1. Sensor Calibration with BSA Solutions

The first stage of the study was to perform the sensor calibration using bovine serum albumin (BSA) aqueous solutions to determine an optimal sample volume and the working range of protein concentrations. Total protein concentration in effluent peritoneal dialysate varies from 0.5 g/L to 4.5 g/L according to [7], and the sensor has to provide reliable data in this range.
The calibrating solutions with the concentrations 0.5, 1, 2, 3, 4, 5, 10 g/L were prepared from 99% pure BSA powder (Lot No. 60154016) purchased from DIA-M (Moscow, Russia). Initially, the chromatograms of the 2 g/L BSA solution with various sample volumes in the range of 100–1000 µL were processed using the FPLS sensor; the elution time of BSA was approximately 50–100 s and slightly increased with the concentration (Figure 2a).
The dependence of the area of the protein right half-peak in the chromatograms on the sample volume was almost linear in the whole range with the Pearson correlation coefficient R2 = 0.985 (Figure 2b); a slight nonlinearity only started to emerge for the volumes larger than 800 µL.
For further experiments we chose an optimal sample volume of 500 µL in such a way that the optical transmittance of the analyte in the sensor cuvette falls in the range 20–40% providing minimal instrumental errors. The chromatograms of BSA solutions (the sample volume was fixed at 500 µL) with various concentrations were processed afterwards (Figure 3a); the dependence of the area of the right protein half-peak on the BSA concentration was also linear in the whole range of 0.5–10 g/L with the Pearson correlation coefficient R2 = 0.999 (Figure 3b).

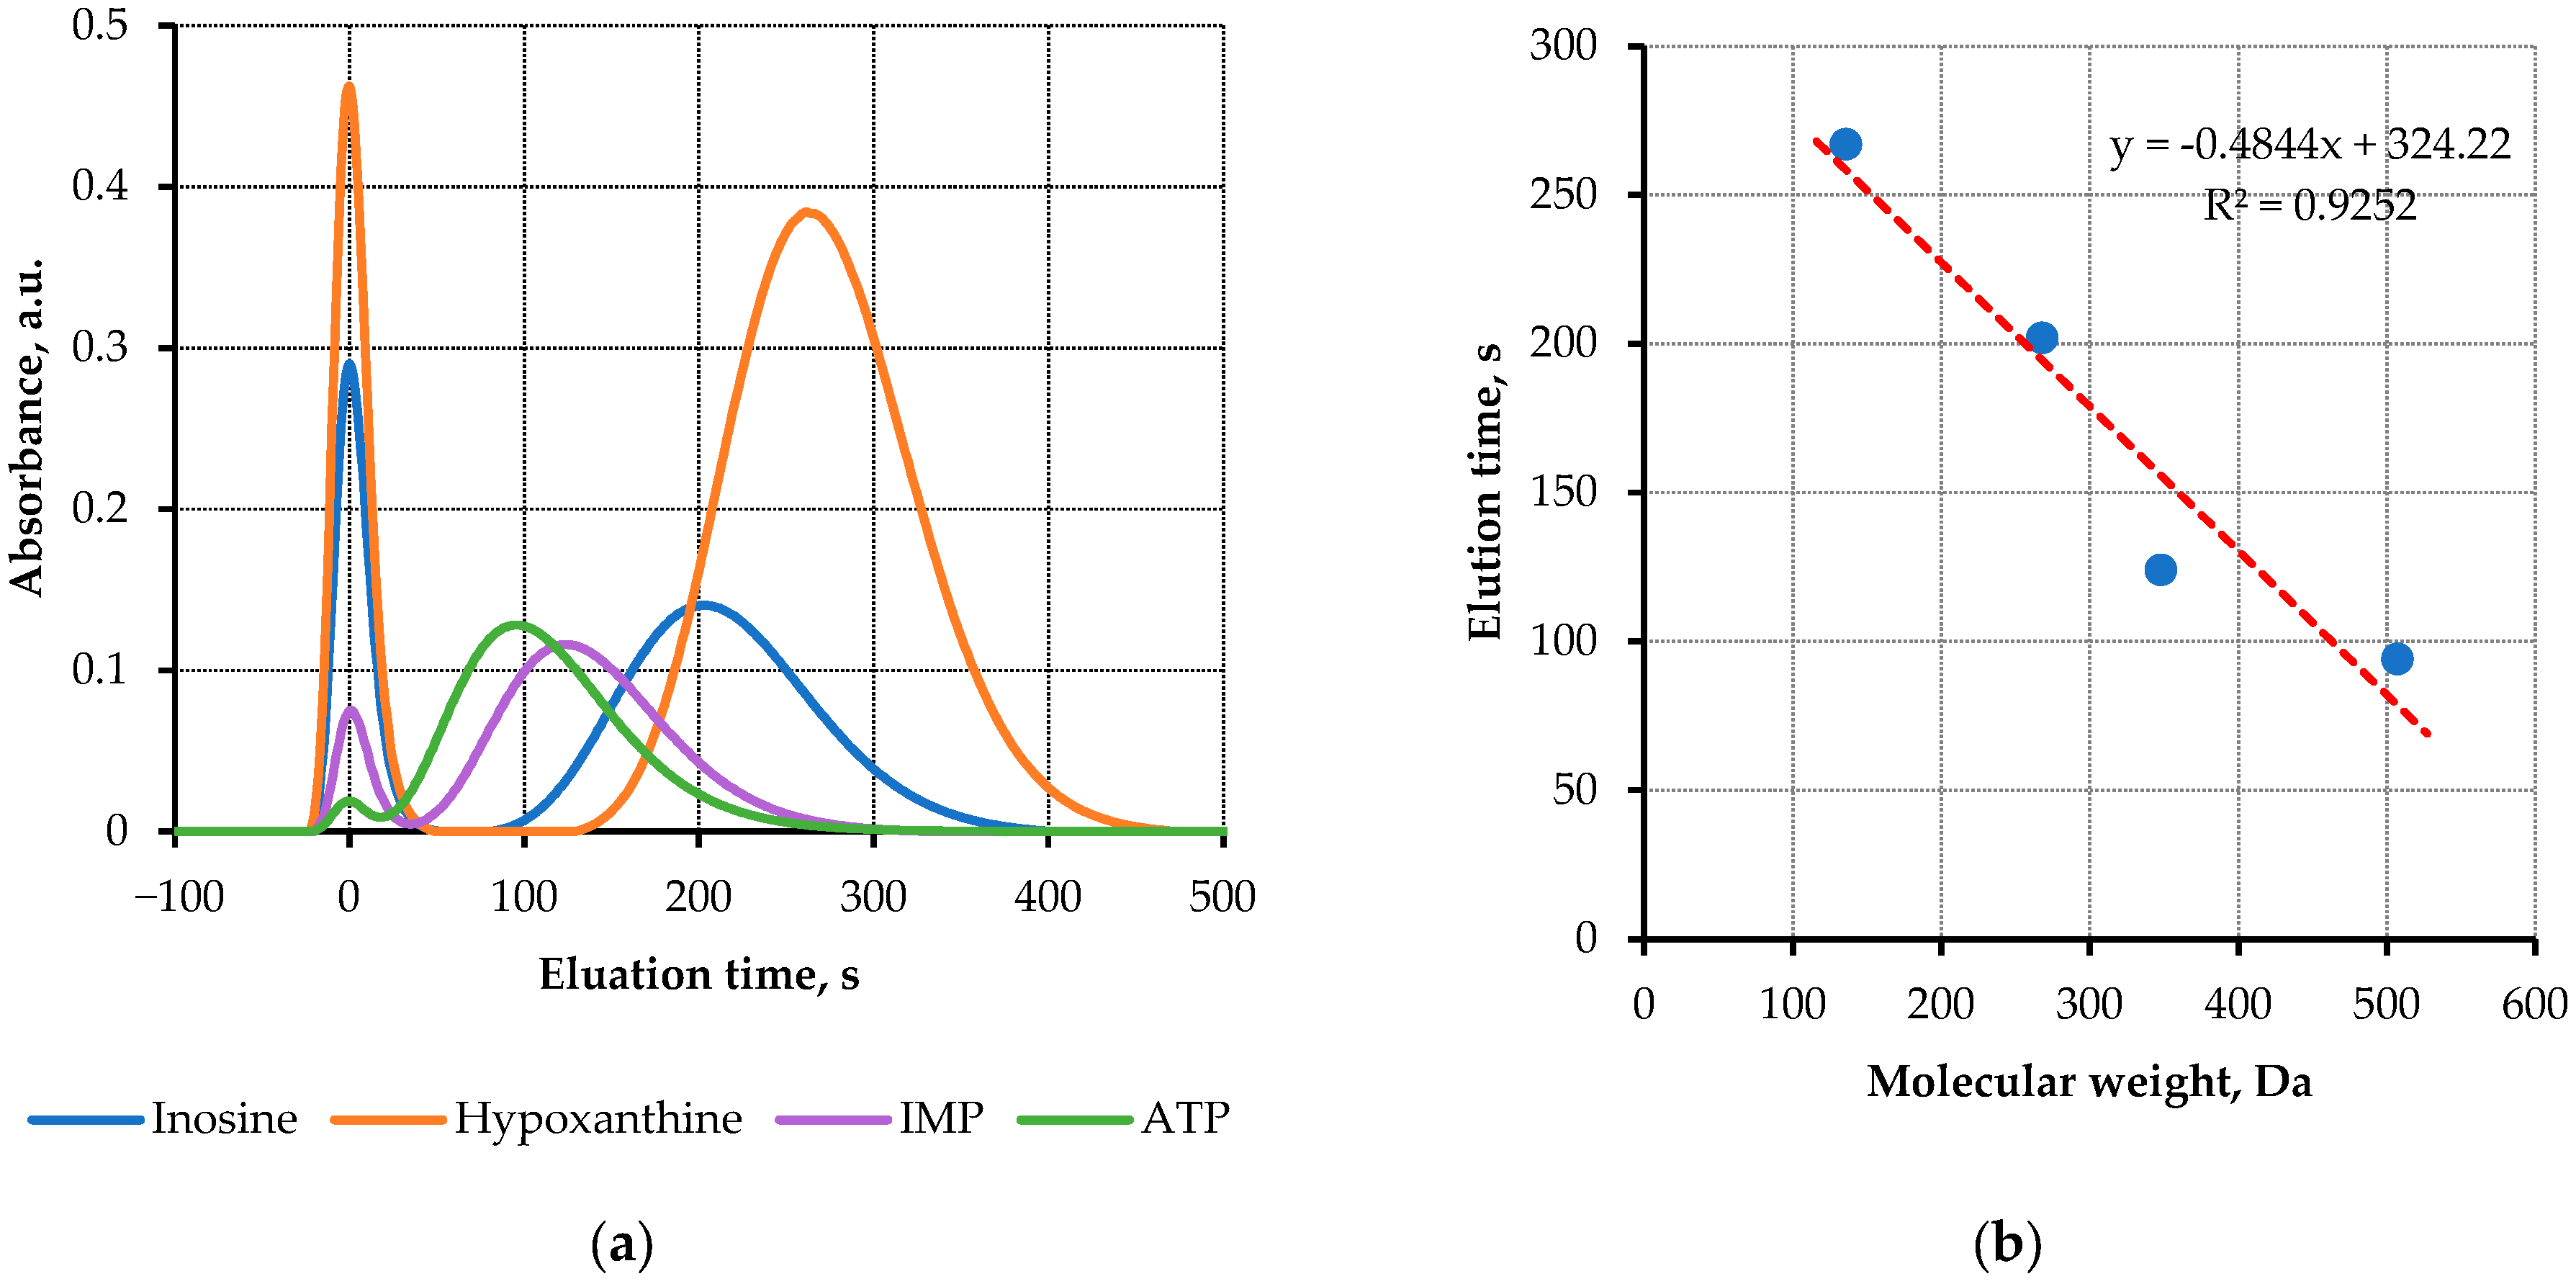
3.2. Sensor Calibration with Nucleotides Solutions

The chromatograms of adenosine triphosphate (ATP), inosine monophosphate (IMP), inosine (Ino), and hypoxanthine (Hx) aqueous solutions were processed, the solutions were prepared from chemicals purchased from Sigma Aldrich (Darmstadt, Germany); the elution times for these nucleotides were obtained relative to the BSA peak. Experimental data are presented in Table 1 and Figure 4. As can be seen from the table and Figure 4b, the elution time is inversely proportional to the molecular weight.

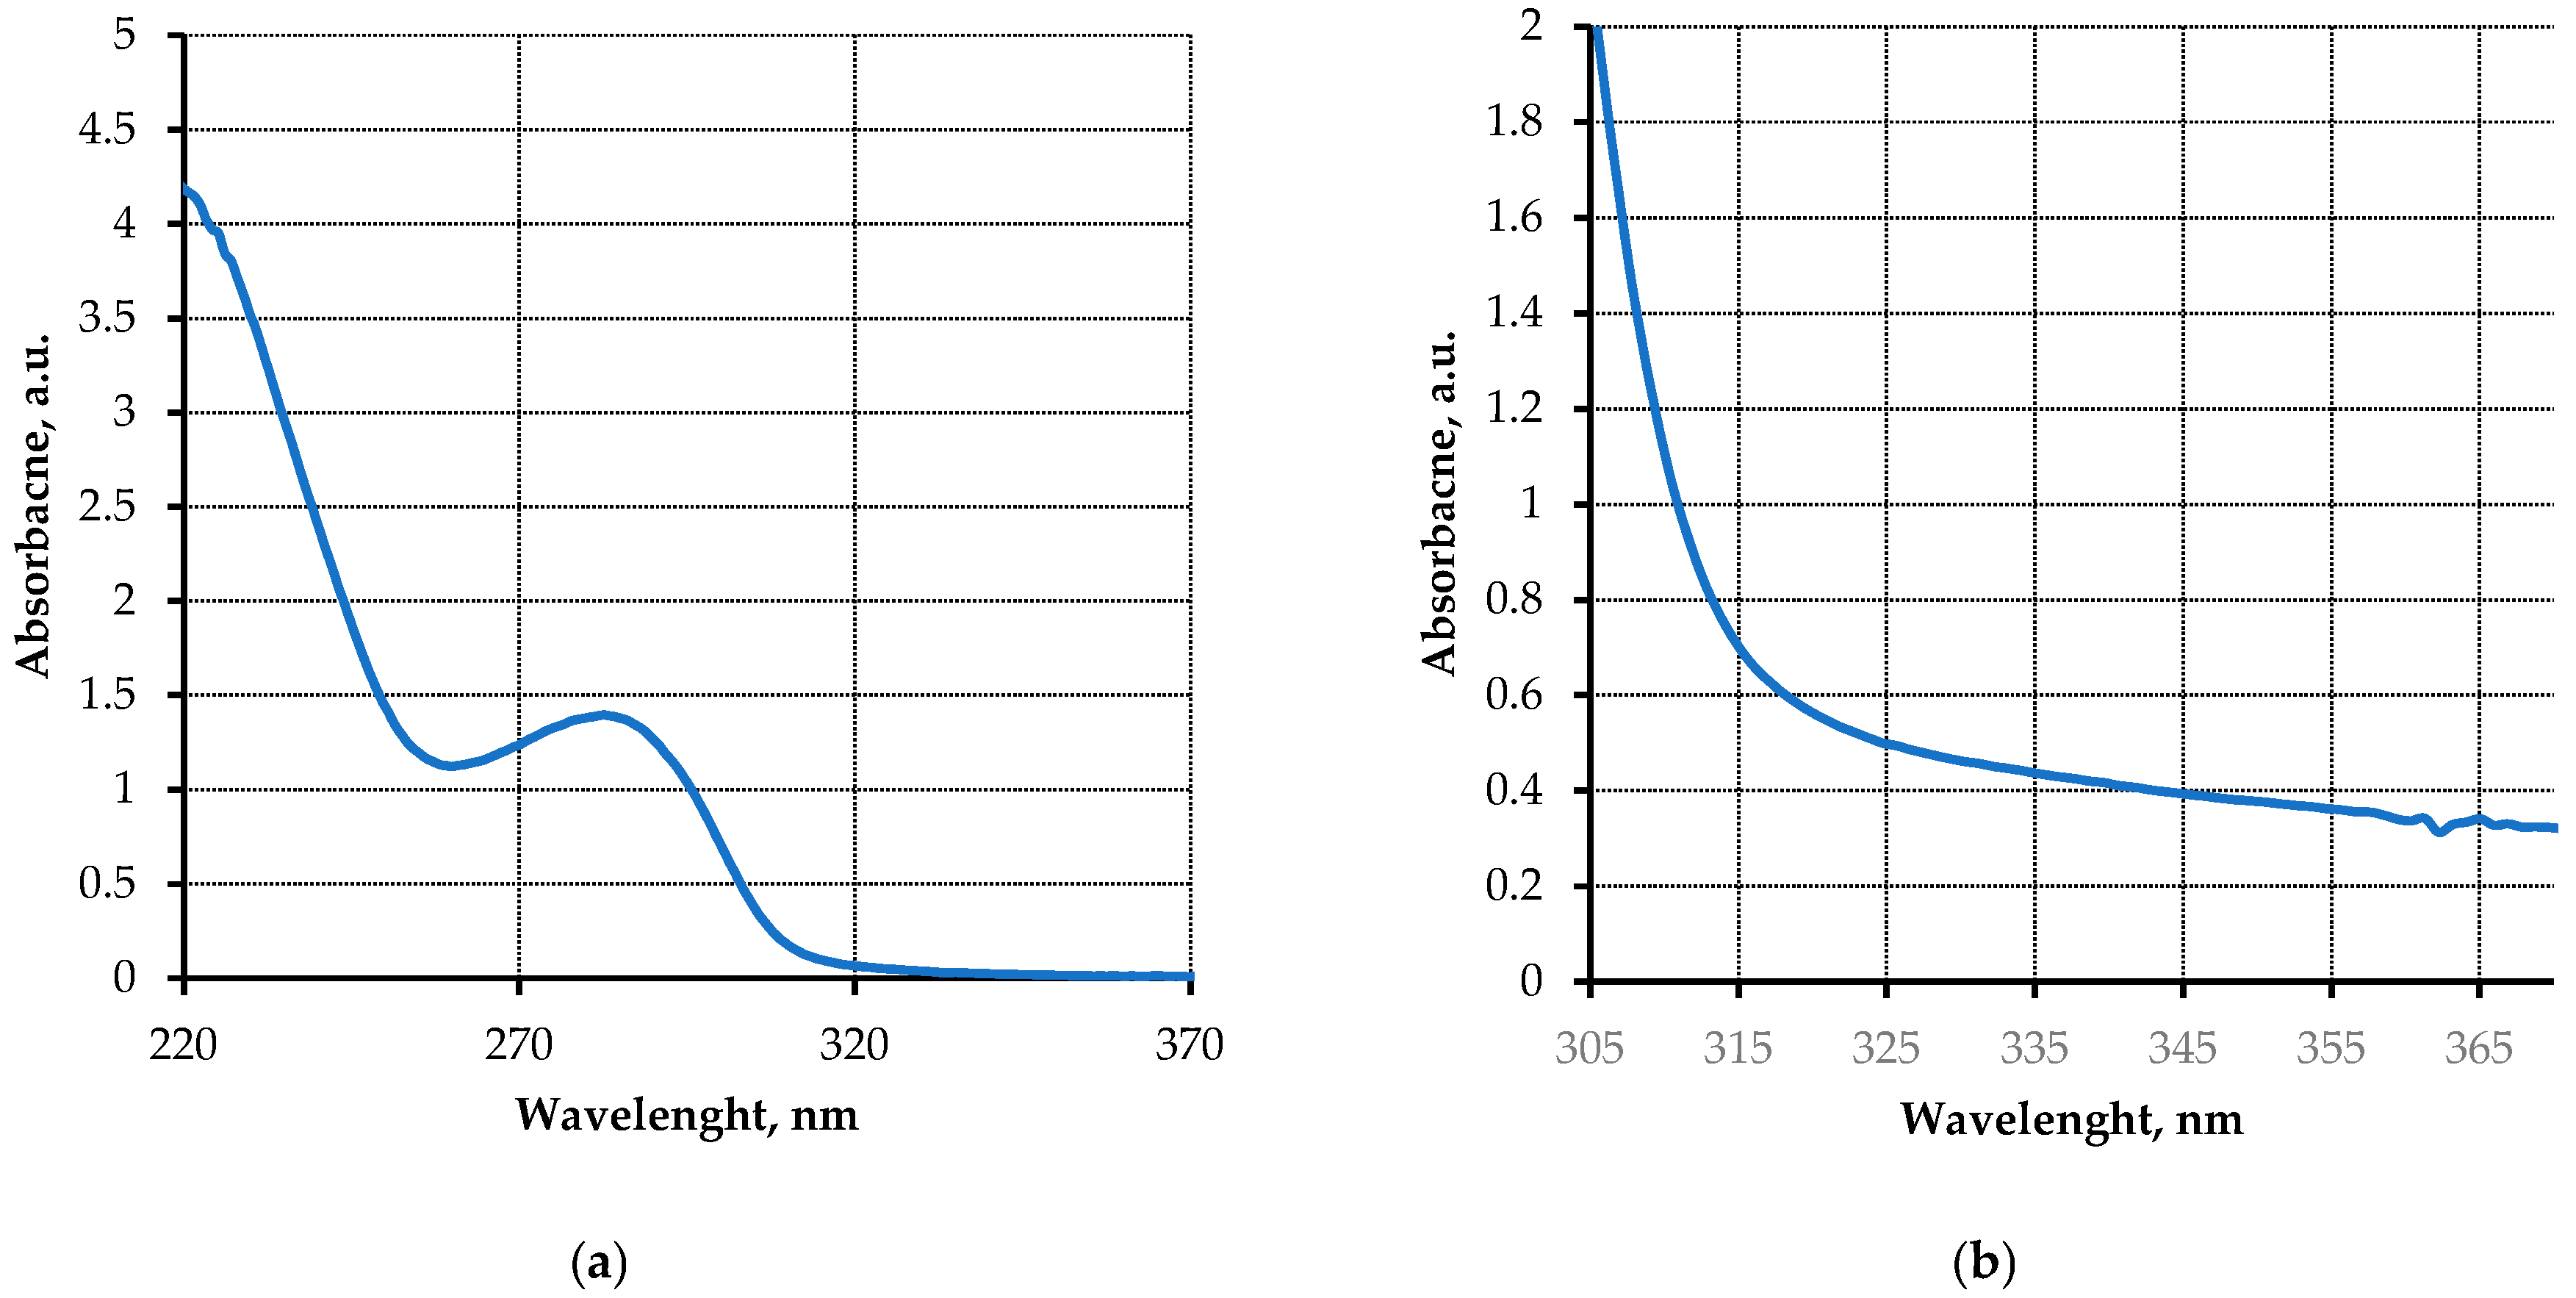
3.3. Chromatograms and UV Absorption Spectra of Effluent Peritoneal Dialysate

Chromatograms of effluent peritoneal dialysate taken from 28 patients with end-stage renal disease were processed. The UV absorption spectra of the samples were recorded in parallel; an example of a chromatogram is shown in Figure 5a.
A strong correlation (R2 = 0.963) was revealed between the area of the first half-peak and the concentration of total protein determined by a standard biochemical method (Figure 5b), which makes it possible to estimate the loss of peritoneal protein with an acceptable accuracy of less than 15%; more detailed data were reported earlier [6].
The origin of the second and the third peaks in the chromatograms still remains unclear, presumably, the second peak may be associated with the advanced glycation end products (AGE) and the third peak is related to purines and pyrimidines substances. To prove this hypothesis UV absorption spectra of dialysate samples were recorded and compared with chromatograms. A cuvette with an optical path of 30 mm was used to record the weak absorption of AGE at 355–365 nm [16], the shorter wavelength part of the spectrum was recorded in a 5 mm cuvette (Figure 6).
The area of the left side of the second peak in the chromatograms shows a relatively good (R2 = 0.705) correlation with the absorption at the wavelengths of 355–365 nm, which are characteristic of AGE. This fact confirms that the second peak is at least partially associated with low molecular weight AGE [17,18], especially taking into account that the elution time for the second peak is close to the elution time of IMP (molecular weight 348 Da), but further research is needed too completely establish this association. The area of the third peak gives a weak correlation (R2 ≈ 0.55) with the absorption of samples at the wavelengths of 260–265 nm, which is associated with purines and pyrimidines. It could be suggested that this peak is possibly related to multiple substances.

4. Conclusions

Thus, the possibility of determining proteins and low molecular weight metabolites in the effluent peritoneal dialysate using a simple chromatographic optical sensor was demonstrated. The optimal sample volume and the working range of protein concentrations were determined by calibration with BSA aqueous solutions. The inverse relationship between the elution time and the molecular weight of analytical substances was established with nucleotides aqueous solutions.
The chromatograms and UV absorption spectra of peritoneal dialysate samples taken from a group of ESRD patients were processed and analyzed; a relatively good correlation (R2 = 0.705) was established between the second peak area and the optical absorption at 355–365 nm. This fact confirms the earlier hypothesis that this peak is at least partially related to low-molecular weight AGE products, and in addition to protein loss assessment the sensor could be used for AGE products determination, which were previously shown to be associated with cardiovascular risks for dialysis patients.

Author Contributions

Conceptualization, G.K. and A.K.; methodology, A.P. and O.S.; software, V.K.; investigation, N.R., A.S., N.O. and Z.R.; resources, R.G. and Z.R.; writing—original draft preparation, G.K. and N.O.; writing—review and editing, A.I., A.F. and A.K. All authors have read and agreed to the published version of the manuscript.

Funding

This research received no external funding.

Institutional Review Board Statement

The study was conducted according to the guidelines of the Declaration of Helsinki, and approved by the Ethics Committee of the Institute of Experimental Medicine (protocol #2/22 from 6 April 2022).

Informed Consent Statement

Patient consent was waived according to the Decision of the Council of the Eurasian Economic Commission No. 29 of February 12, 2016 “On Rules for Clinical and Clinical Laboratory Trials (Studies) of Medical Products”. The document states that written informed consent is not required when residual laboratory samples are used exclusively for in-vitro research and testing of clinical laboratory equipment. Patients’ personal data or medical history were not disclosed by the hospital.

Data Availability Statement

Data available on request due to the Hospital ethical policy.

Acknowledgments

The authors express their gratitude to the Saint Petersburg City Mariinsky hospital and Dialysis unit of North-Western State Medical University named after I.I. Mechnikov doctors and nursing staff for their assistance in obtaining residual peritoneal dialysate samples and valuable comments, and to Roman Korsakov for assistance in software development.

Conflicts of Interest

The authors declare no conflict of interest.

References

  1. Bikbov, B.; Purcell, C.A.; Levey, A.S.; Smith, M.; Abdoli, A.; Abebe, M.; Adebayo, O.M.; Afarideh, M.; Agarwal, S.A.; Agudelo-Botero, M.; et al. Global, regional, and national burden of chronic kidney disease, 1990–2017: A systematic analysis for the Global Burden of Disease Study 2017. Lancet 2020, 395, 709–733. [Google Scholar] [CrossRef]
  2. Li, P.K.-T.; Chow, K.M.; Van de Luijtgaarden, M.W.M.; Johnson, D.W.; Jager, K.J.; Mehrotra, R.; Naicker, S.; Pecoits-Filho, R.; Yu, X.Q.; Lameire, N. Changes in the worldwide epidemiology of peritoneal dialysis. Nat. Rev. Nephrol. 2017, 13, 90–103. [Google Scholar] [CrossRef]
  3. Mehrotra, R.; Devuyst, O.; Davies, S.J.; Johnson, D.W. The Current State of Peritoneal Dialysis. J. Am. Soc. Nephrol. 2016, 27, 3238–3252. [Google Scholar] [CrossRef] [PubMed]
  4. Blumenkrantz, M.J.; Gahl, G.M.; Kopple, J.D.; Kamdar, A.V.; Jones, M.R.; Kessel, M.; Coburn, J.W. Protein losses during peritoneal dialysis. Kidney Int. 1981, 19, 593–602. [Google Scholar] [CrossRef] [PubMed]
  5. Fan, J.; Ye, H.; Zhang, X.; Cao, P.; Guo, Q.; Mao, H.; Yu, X.; Yang, X. Association of Lean Body Mass Index and Peritoneal Protein Clearance in Peritoneal Dialysis Patients. Kidney Blood Press. Res. 2019, 44, 94–102. [Google Scholar] [CrossRef] [PubMed]
  6. Chang, T.I.; Kang, E.W.; Lee, Y.K.; Shin, S.K. Higher Peritoneal Protein Clearance as a Risk Factor for Cardiovascular Disease in Peritoneal Dialysis Patient. PLoS ONE 2013, 8, e56223. [Google Scholar] [CrossRef]
  7. Lu, W.; Pang, W.-F.; Jin, L.; Li, H.; Chow, K.M.; Kwan, B.C.-H.; Leung, C.B.; Li, P.K.-T.; Szeto, C.C. Peritoneal protein clearance predicts mortality in peritoneal dialysis patients. Clin. Exp. Nephrol. 2018, 23, 551–560. [Google Scholar] [CrossRef] [PubMed]
  8. Dong, J.; Chen, Y.; Luo, S.; Xu, R.; Xu, Y. Peritoneal Protein Leakage, Systemic Inflammation, and Peritonitis Risk in Patients on Peritoneal Dialysis. Perit. Dial. Int. 2013, 33, 273–279. [Google Scholar] [CrossRef] [PubMed]
  9. Fung, W.W.-S.; Li, P.K.-T. Recent advances in novel diagnostic testing for peritoneal dialysis-related peritonitis. Kidney Res. Clin. Pract. 2022, 41, 156–164. [Google Scholar] [CrossRef] [PubMed]
  10. Lingervelder, D.; Koffijberg, H.; Kusters, R.; IJzerman, M.J. Point-of-care testing in primary care: A systematic review on implementation aspects addressed in test evaluations. Int. J. Clin. Pract. 2019, 73, e13392. [Google Scholar] [CrossRef] [PubMed]
  11. Walls, D.; Loughran, S.T. Protein Chromatography: Methods and Protocols, 2011st ed.; Humana Press: Totowa, NJ, USA, 2011; p. 681. ISBN 9781607619123. [Google Scholar]
  12. Determann, H. Gel Chromatography, Gel Filtration, Gel Permeation, Molecular Sieves: A Laboratory Hand Book, 2nd ed.; Springer: New York, NY, USA, 1969; p. 208. ISBN 978-3642950841. [Google Scholar]
  13. Sünter, A.; Frorip, A.; Korsakov, V.; Kurruk, R.; Kuznetsov, A.; Ots-Rosenberg, M. Optical method for screening and a new proteinuria focus group. J. Biomed. Photonics Eng. 2015, 1, 236–247. [Google Scholar] [CrossRef]
  14. Kuznetsov, A.; Frorip, A.; Sünter, A.; Kasvand, N.; Korsakov, V.; Konoplev, G.; Stepanova, O.; Rusalepp, L.; Anton, D.; Püssa, T.; et al. Fast Protein and Metabolites (Nucleotides and Nucleosides) Liquid Chromatography Technique and Chemical Sensor for the Assessment of Fish and Meat Freshness. Chemosensors 2023, 11, 69. [Google Scholar] [CrossRef]
  15. Kuznetsov, A.; Frorip, A.; Sünter, A.; Korsakov, V.; Konoplev, G.; Stepanova, O.; Roschina, N.; Ovsyannikov, N.; Lialin, D.; Gerasimchuk, R.; et al. Optical Chemical Sensor Based on Fast-Protein Liquid Chromatography for Regular Peritoneal Protein Loss Assessment in End-Stage Renal Disease Patients on Continuous Ambulatory Peritoneal Dialysis. Chemosensors 2022, 10, 232. [Google Scholar] [CrossRef]
  16. Kuznetsov, A.; Frorip, A.; Gerasimchuk, R.P.; Konoplev, G.A.; Rosenberg, M.; Sinijärv, H.; Sünter, A.; Vasilevsky, A.M.; Zemchenkov, A.Y. MP479 Multimode monitoring of age excretion in hemodialysis. Nephrol. Dial. Transplant. 2016, 31, i500–i501. [Google Scholar] [CrossRef]
  17. Stinghen, A.E.M.; Massy, Z.A.; Vlassara, H.; Striker, G.E.; Boullier, A. Uremic Toxicity of Advanced Glycation End Products in CKD. J. Am. Soc. Nephrol. 2016, 27, 354–370. [Google Scholar] [CrossRef] [PubMed]
  18. Jiang, J.; Zhang, Y.; Chen, J.; Yang, X.; Mei, C.; Xiong, F.; Shi, W.; Zhou, W.; Liu, X.; Sun, S.; et al. Serum and Tissue Levels of Advanced Glycation End Products and Risk of Mortality in Patients on Maintenance Hemodialysis. Am. J. Nephrol. 2021, 52, 8–16. [Google Scholar] [CrossRef] [PubMed]
Figure 1. Schematic diagram of the sensor.
Engproc 35 00025 g001
Figure 2. Calibration of the FPLC sensor with 2 g/L BSA solution with different sample volumes: (a) The chromatograms; (b) Dependence of the protein half-peak area on the sample volume.
Engproc 35 00025 g002
Figure 3. Calibration of the FPLC sensor with BSA solution with various concentrations: (a) The chromatograms; (b) Dependence of the protein half-peak area on the concentration.
Engproc 35 00025 g003
Figure 4. Calibration of the FPLC sensor with nucleotides solutions: (a) The chromatograms of the nucleotides with the BSA peak as a time reference; (b) Dependence of the elution time on the molecular weight.
Engproc 35 00025 g004
Figure 5. (a) An example of an effluent peritoneal dialysate chromatogram approximated with a set of split Gaussian fitting curves; (b) Dependence of the right half-peak area on total protein concentration determined by a standard biochemical assay.
Engproc 35 00025 g005
Figure 6. Examples of a dialysate UV absorption spectrum: (a) 5 mm cuvette; (b) 30 mm cuvette.
Engproc 35 00025 g006
Table 1. Elution times for nucleotides.
SubstanceMolecular Weight, DaElution Time, s
ATP50794
IMP348124
Ino268202
Hx136267
Disclaimer/Publisher’s Note: The statements, opinions and data contained in all publications are solely those of the individual author(s) and contributor(s) and not of MDPI and/or the editor(s). MDPI and/or the editor(s) disclaim responsibility for any injury to people or property resulting from any ideas, methods, instructions or products referred to in the content.

