Proceeding Paper

Ag/TiO2 Nanocomposites for Nanothermometry in the Biological Environment †

1
Department of Chemical Science, University of Padua, Via Marzolo 1, 35131 Padova, Italy
2
Consorzio Interuniversitario Nazionale per la Scienza e Tecnologia dei Materiali (INSTM), Via G. Giusti 9, 50121 Firenze, Italy
*
Author to whom correspondence should be addressed.
Presented at the 3rd International Electronic Conference on Biosensors, 8–21 May 2023; Available online: https://iecb2023.sciforum.net.
Eng. Proc. 2023, 35(1), 16; https://doi.org/10.3390/IECB2023-14585
Published: 8 May 2023
(This article belongs to the Proceedings of The 3rd International Electronic Conference on Biosensors)

Abstract

:
Local temperature determination is essential to understand heat transport phenomena at the nanoscale and to design nanodevices for biomedical, photonic, and optoelectronic applications. In particular, the detection of the local temperature of the intracellular environment is interesting for photothermal therapy. In the present work, nanoparticles consisting of an Ag core, covered by a TiO2 shell and Ag@TiO2 core–shell, were suitably synthesized through a one-pot method. Silver nanoparticles synthesized in DMF were coated by controlled hydrolysis of titanium tetrabutoxide in the same reaction environment. The synthesis led to nanocomposites where AgNPs were covered by a diffuse layer of anatase. The nanocomposites were characterized using UV/Vis spectroscopy and Raman spectroscopy. The samples obtained proved to be good Raman nanothermometers with a sensitivity comparable to that of simple anatase nanoparticles.

1. Introduction

Since the development of nanodevices for applications in nanomedicine, photonics, and optoelectronics, a deep understanding of heat transport and local heating phenomena within devices has been utterly necessary [1,2]. This knowledge can be acquired through local temperature determination at the nanoscale, which is the investigation field of nanothermometry. The availability of suitable nanothermometers for the intracellular environment is of particular interest for the treatment of carcinogenic tissues in photothermal therapy [3,4]. Cancerous cells can be identified since they are characterized by above-average local temperatures as a result of improved metabolism. Afterward, they can be killed under hyperthermic conditions through the controlled release of a large amount of heat by nanoheaters inside the tissue. This is usually achieved with non-contact techniques which use lasers working in the NIR range, which are less harmful and more tissue penetrative than those in the visible range [4].
In recent years, many techniques for local temperature determination have been developed [2]. Among the optical ones, Raman-spectroscopy-based nanothermometry is adequate for photothermal therapy applications because it can be easily used in physiological environments due to the weak water Raman signals, and it has a high spatial resolution and a large excitation wavelength range. Information on local temperature is obtained from the relationship between the intensities of anti-Stokes and Stokes Raman signals for a specific Raman active vibrational transition of the material used as the nanothermometer, as it follows a Boltzmann distribution [5].
For photothermal therapy applications, it is important to choose a nanothermometer that is biocompatible, nontoxic, and chemically stable, criteria that are satisfied by titanium dioxide nanoparticles in the anatase phase [6]. Anatase nanoparticles are also suitable materials for Raman nanothermometry because they have a large Raman scattering cross section. TiO2 anatase, as a commercial powder [5] and as synthesized nanoparticles [7], has already been tested, using its high-intensity Raman signal with a low Raman shift, at 143 cm−1, as a reference.
In photothermal therapy, it is important that the nanothermometer is in a space close to the nanoheater to avoid the mistaken death of healthy cells [4]. For this reason, Ag@TiO2 nanomaterials can be proposed as potential candidates for thermometer and photothermal material: a TiO2 anatase shell, the Raman nanothermometer, grows around a core of Ag nanoparticles used as nanoheaters, and is characterized by a strong surface plasmon resonance [8]. In the literature, amorphous Ag@TiO2 core–shell nanoparticles have been synthesized with different bottom-up sol–gel methods: one-pot synthesis [9,10], two-step synthesis [11,12], radiation-assisted synthesis [13], and inverse micellar route [14]. Only a few works also proceed with the crystallization of the titania shell to the anatase phase, either by calcination [12,14] or solvothermal treatment [10].
In the present work, the one-pot route was followed because it allows the silver nanoparticles to be covered in the same reaction vessel for their growth. Amorphous core–shell nanoparticles have been synthesized using a procedure described in the literature [9] where the Ag core suspended in DMF is covered by the amorphous titania shell with controlled hydrolysis of titanium tetrabutoxide (TTB). Then, the crystallization to the anatase phase was suitably achieved via solvothermal treatment because it was cleaner and required working temperatures lower than those used in the calcination step. The nanocomposites were characterized by ultraviolet/visible (UV/vis) and Raman spectroscopy. Their Raman nanothermometric performances were evaluated at a 530 nm excitation wavelength. The performances obtained with the nanocomposites, in terms of temperature sensitivity, were compared with those of pure anatase nanoparticles.

2. Materials and Methods

2.1. Materials

Silver nitrate (AgNO3 ≥ 99.0, Fluka 7761-88-8, Thermo Fisher Scientific-Fisher Scientific AS, Oslo, Norway), N,N-dimethilformamide (DMF ≥ 99.8% pure, Merck Millipore 68-12-2, Merck KGaA, Burlington, MA, United States), titanium (IV) tetrabutoxide (TTB ≥ 97.0% pure, Fluka 5593-70-4), acetylacetone (Sigma-Aldrich 123-54-6, Merck), ethanol (EtOH ≥ 99.8% pure, Sigma-Aldrich 64-17-5, Merck), dihydrated trisodium citrate (≥99.0 pure, Fluka 6132-04-3), and double-distilled water were used for the synthesis of Ag@TiO2, TiO2, and Ag NPs.

2.2. Synthesis of Ag NPs

Silver nanoparticles stabilized with citrate were synthesized using a procedure from the literature [15]. To a refluxing solution of AgNO3 (1.06 mM in 100 mL of double-distilled water) we added a solution of sodium citrate (1% m/m in water). After at least 70 min, the greyish-green suspension was cooled to room temperature and then centrifuged and washed twice with water. After being dried under vacuum on a silica gel drier, a black solid was obtained.

2.3. Synthesis of Ag@TiO2

A solution of TBT/acetylacetone (5.75 mM in 100 mL of ethanol) was added to 25 mL of fresh suspension of AgNPs (3.8 mM AgNO3/0.8 M double-distilled water in 30 mL of DMF) under magnetic stirring. The clear mixture was heated to reflux and turned reddish and then brownish-black in a few minutes. After 90 min, the suspension was cooled to room temperature, centrifugated, and washed twice with ethanol. The mixture was transferred to a Berghof stainless steel solvothermal bomb (Model pressure vessel digestec DAB-3, 200 mL volume, limit temperature of use 180 °C, held up to 8 bar) and then heated at 150 °C for 24 h. The synthesis led to a light brown sand precipitate, isolated by centrifugation, and washed twice with ethanol. After being dried under vacuum on a silica gel drier, a brownish-black solid was obtained.

2.4. Synthesis of TiO2 NPs

The TiO2 sample was obtained with a synthesis modified from the literature [12]. Double-distilled water (4 mL) was added to a TBT solution (5.75 mM in 75 mL of ethanol). After 20 min of magnetic stirring under mild heating, the white suspension was cooled to room temperature. The mixture was transferred to a Berghof stainless steel solvothermal bomb (Model pressure vessel digestec DAB-3, 200 mL volume, limit temperature of use 180 °C, held up to 8 bar) and then heated at 150 °C for 24 h. After centrifugation, the white solid was dried under vacuum on a silica gel drier.

2.5. Optical Characterization

UV/Vis spectra were recorded in fluorescence quartz cuvettes (10 × 10 mm) on a double-beam Agilent Cary 5000 UV-Vis-NIR spectrometer. Data were collected with the Cary WinUV Scan software and plotted with MATLAB R2022b.
Two Raman setups were used to collect Raman spectra: (1) Micro-Raman equipped with an Ar+ laser @ 514.5 nm (Spectra Physics, Stabilite 2017), output power 1W. This micro-Raman works in a backscattering geometry: the Raman signal is separated from the Rayleigh scattering, using an edge filter, and analyzed with an imaging spectrograph through a liquid-nitrogen-cooled CCD camera. (2) Micro-Raman setup equipped with a CW Optical Pumped Semiconductor Laser (Coherent, Verdi G7, Santa Clara, CA, USA), providing the line at 530 nm. The laser beam was coupled to a microscope (Olympus BX 40) and focused on the sample using 100×, 50×, or 20× objectives (Olympus SLMPL). Raman scattering was coupled into the slit of a three-stage subtractive spectrograph, consisting of a double monochromator (Jobin Yvon, DHR 320) and a spectrograph (Jobin Yvon, HR 640). A liquid-nitrogen-cooled CCD was used to detect the Raman signal.
For temperature measurements, the Raman instrument was interfaced with a temperature-control stage (Linkam, THMS600/720, Tadworth, UK). The stage was used, in the range of 77–600 K, to control the sample temperature. Samples were uniformly heated/cooled, with a rate of 5 K/min and a thermalization time of at least 15 min, to reach the desired temperature. After thermalization time, consecutive Stokes and anti-Stokes measurements were conducted and repeated to obtain a consistent set of data. Usually, for temperature measurements, a power intensity lower than 3 mW was used to avoid laser-induced heating. All Raman spectra were collected with LabSpec software (HORIBA) and analyzed with MATLAB R2022b.

3. Results and Discussion

3.1. Characterization

The UV/Vis spectra of the silver suspension, the mixture before and after reflux, and the purified suspension of Ag@TiO2 core–shell nanoparticles are shown in Figure 1a. The formation of an amorphous titania shell around the silver core was confirmed by the redshift of the Ag plasmonic band, correlated with the high refraction index of TiO2 [12]. The purification procedure, necessary for the removal of the residual amount of DMF, prior to solvothermal treatment, was efficient and caused the disappearance of the strong absorption band of acetylacetone-coordinated titanium (IV), below 400 nm [16].
The Raman spectrum of the synthesized core–shell nanoparticles was recorded and compared with that of the TiO2 powder and Ag NPs, as shown in Figure 1b. All Raman spectra were recorded using the excitation wavelength of 514.5 nm. It is clear that the solvothermal treatment led to a single TiO2 crystalline phase for the one-pot nanoparticles, that is, the desired anatase phase. The main signature is the strong signal at 143 cm−1, followed by the less intense signals at 195, 393, 513, and 635 cm−1. These signals are comparable to data reported in the literature [17]. The remaining peak at 233 cm−1 is assigned to the contribution of Ag NPs, as it clearly emerges from the comparison with the spectrum of Ag NPs and the data from the literature [18].

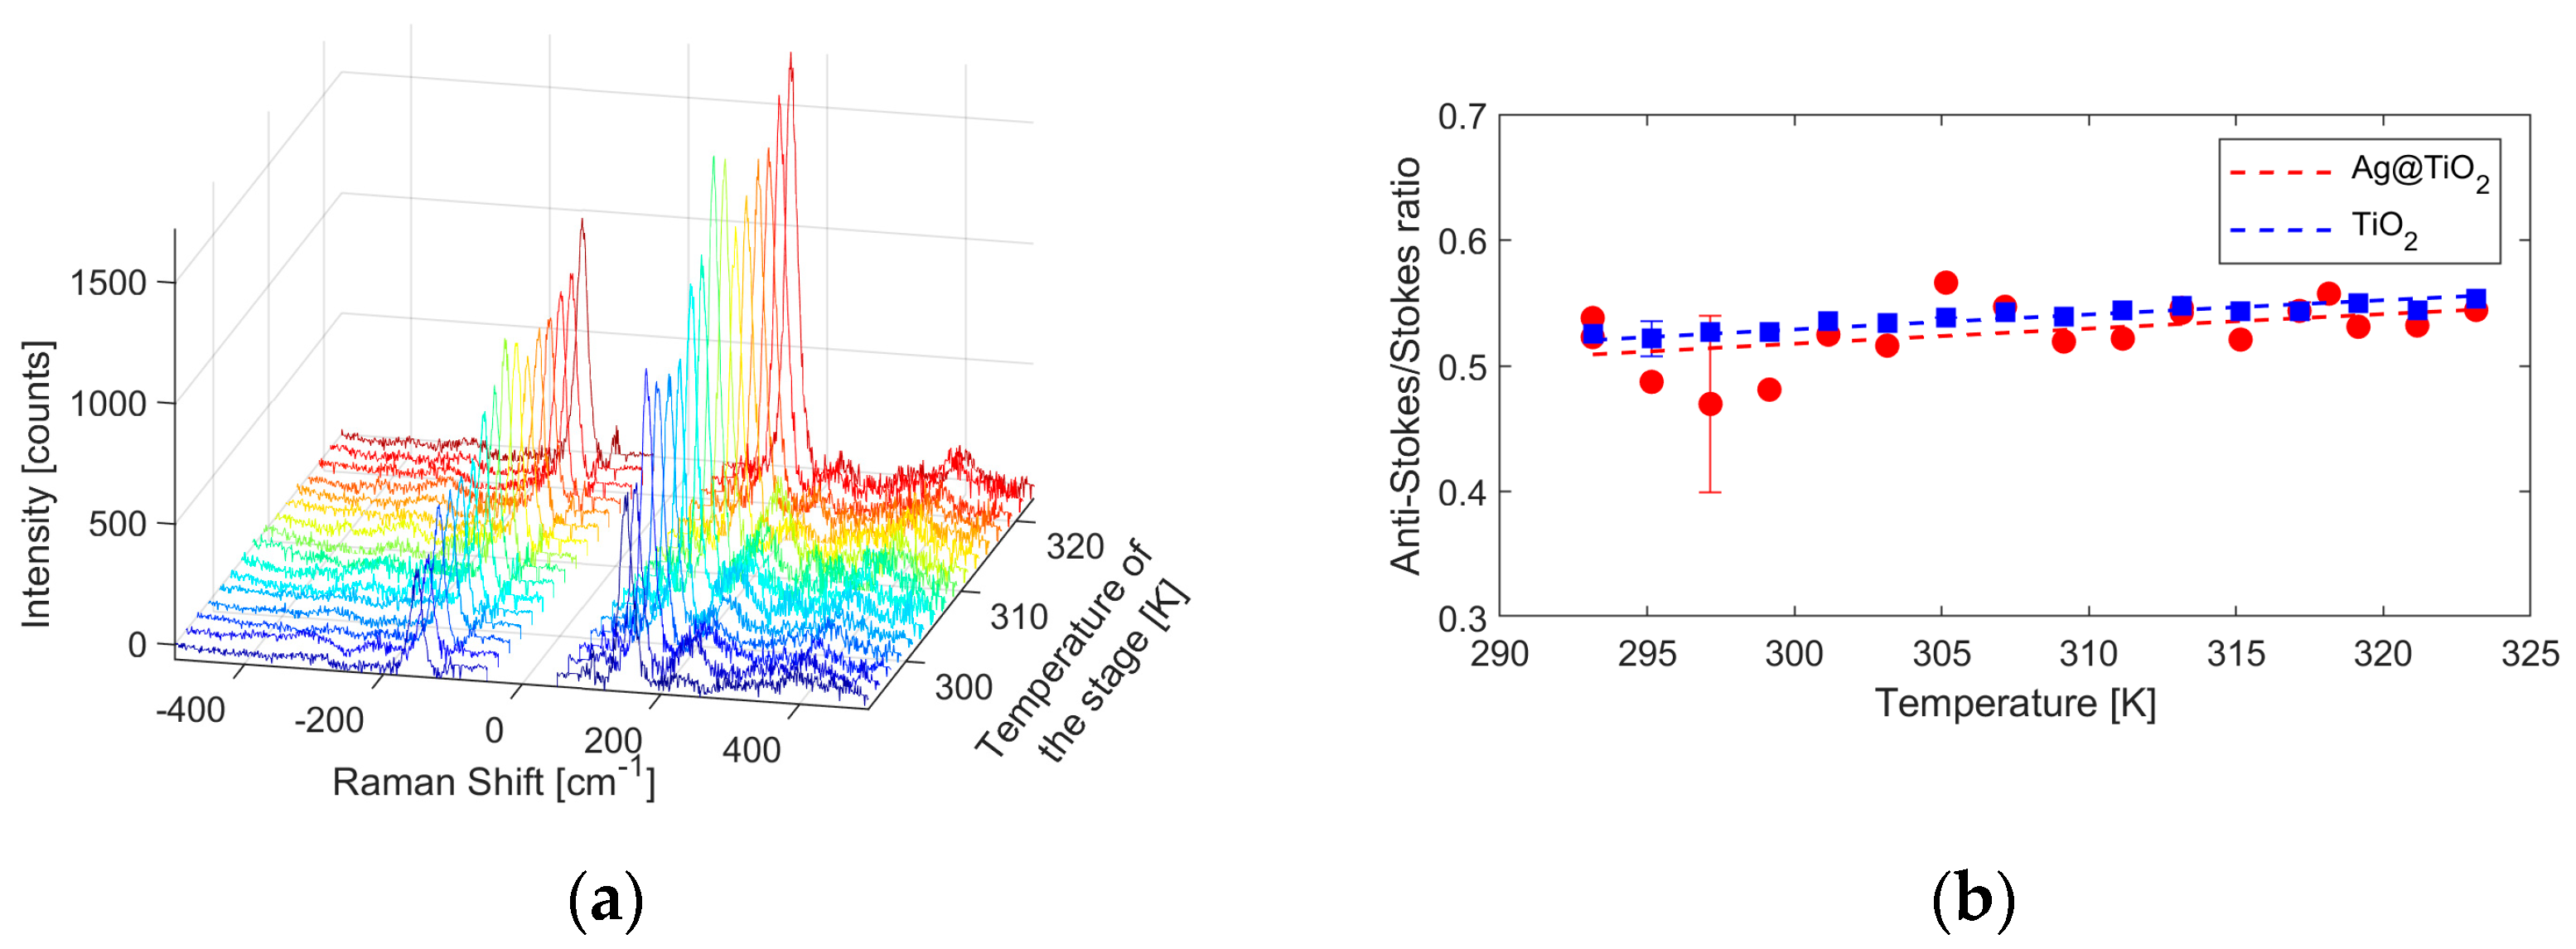
3.2. Raman Nanothermometry

For the Raman nanothermometric measurements, Stokes and anti-Stokes spectra were collected at the 530 nm excitation wavelength in the temperature range of 293.15 to 323.15 K (every 5 K) and are reported in Figure 2a. The signals centered at −143 and 143 cm−1 were fitted with a Lorentzian function, and the ratio of their intensities was plotted against the temperature in Figure 2b.
From the fitting of anti-Stokes/Stokes intensity ratios, the experimental constants for Ag@TiO2 and TiO2 were obtained, since the determination of these parameters is a key point in the correlation of the Raman signal to the temperature. The results, together with the laser power used for the measurements, are resumed in Table 1.
The values found are in agreement with those obtained at a comparable excitation wavelength (514.5 nm) with commercial and properly synthesized TiO2 NP [5,7], where a high sensitivity and an uncertainty of a few degrees have been demonstrated. This confirms the possibility of using Ag@TiO2 as a nanothermometer. For the practical use of these materials, it remains to verify the extent of the local heating induced as the intensity of the laser radiation increases and the efficiency at 800 nm of excitation wavelength, which is of particular interest for future photothermal therapy application.

4. Conclusions

The synthesis of Ag@TiO2 core–shell nanoparticles led to nanocomposites where silver cores with a wide dimensional distribution are covered by a layer of anatase. These nanomaterials have proven to be good Raman nanothermometers in the visible range, with performances comparable to those of simple anatase nanoparticles in the temperature range of 293.15 to 323.15 K. When comparing the experimental parameters of the Ag@TiO2 core–shell nanostructures with those of commercial anatase NPs, it is therefore possible to state that Ag@TiO2 also possesses high sensitivity and a few degrees of uncertainty.

Author Contributions

Conceptualization, R.S., S.G., and D.P.; methodology, R.S., S.G., and D.P.; software, R.Z., M.F., and V.Z.; validation, R.Z., M.F., R.P., and V.Z.; formal analysis, R.Z.; investigation, R.Z., M.F., and V.Z.; resources, R.S., D.P., and S.G.; data curation, R.Z.; writing—original draft preparation, R.Z. and R.S.; writing—review and editing, R.S., R.Z., M.F., V.Z., R.P., S.G., and D.P.; visualization, R.S., R.P., S.G., and D.P.; supervision, R.S. and S.G.; project administration, R.S.; funding acquisition, R.S. and S.G. All authors have read and agreed to the published version of the manuscript.

Funding

This research was funded by the Chemical Science Department of University od Padova, project P-DiSC#10BIRD2019-UNIPD.

Institutional Review Board Statement

Not applicable.

Informed Consent Statement

Not applicable.

Data Availability Statement

Not applicable.

Conflicts of Interest

The authors declare no conflict of interest.

References

  1. Bradac, C.; Lim, S.F.; Chang, H.-C.; Aharonovich, I. Optical Nanoscale Thermometry: From Fundamental Mechanisms to Emerging Practical Applications. Opt. Mater. 2020, 8, 2000183. [Google Scholar] [CrossRef]
  2. Quintanilla, M.; Liz-Marzán, L. Guiding Rules for Selecting a Nanothermometer. Nano Today 2018, 19, 126–145. [Google Scholar] [CrossRef]
  3. Piñol, R.; Brites, C.D.S.; Silva, N.J.; Carlos, L.D.; Millán, A. Chapter 6 - Nanoscale Thermometry for Hyperthermia Applications. In Micro and Nano Technologies. In Nanomaterials for Magnetic and Optical Hyperthermia Applications, 1st ed.; Fratila, R.M., De La Fuente, J.M., Eds.; Elsevier: Amsterdam, The Netherlands, 2019; pp. 139–172. [Google Scholar] [CrossRef]
  4. Gao, P.; Wang, H.; Cheng, Y. Strategies for efficient photothermal therapy at mild temperatures: Progresses and challenges. Chin. Chem. Lett. 2022, 33, 575–586. [Google Scholar] [CrossRef]
  5. Zani, V.; Pedron, D.; Pilot, R.; Signorini, R. Contactless Temperature Sensing at the Microscale Based on Titanium Dioxide Raman Thermometry. Biosensors 2021, 11, 102. [Google Scholar] [CrossRef] [PubMed]
  6. Yin, Z.F.; Wu, L.; Yang, H.G.; Su, Y.H. Yin, Z.F.; Wu, L.; Yang, H.G.; Su, Y.H. Recent progress in biomedical applications of titanium dioxide. Phys. Chem. Chem. Phys. 2013, 15, 4844. [Google Scholar] [CrossRef] [PubMed]
  7. Pretto, T.; Franca, M.; Zani, V.; Gross, S.; Pedron, D.; Pilot, R.; Signorini, R. A Sol-Gel/Solvothermal Synthetic Approach to Titania Nanoparticles for Raman Thermometry. Sensors 2023, 23, 2596. [Google Scholar] [CrossRef] [PubMed]
  8. Yguerabide, J.; Yguerabide, E.E. Light-Scattering Submicroscopic Particles as Highly Fluorescent Analogs and Their Use as Tracer Labels in Clinical and Biological Applications: I. Theory. Anal. Biochem. 1998, 262, 137–156. [Google Scholar] [CrossRef] [PubMed]
  9. Pastoriza-Santos, I.; Koktysh, D.; Mamedov, A.; Giersig, M.; Kotov, N.; Liz-Marzán, L. One-Pot Synthesis of Ag@TiO2 Core-Shell Nanoparticles and Their Layer-by-Layer Assembly. Langmuir 2000, 16, 2731–2735. [Google Scholar] [CrossRef]
  10. Wang, P.; Wang, D.; Xie, T.; Li, H.; Yang, M.; Wei, X. Preparation of monodisperse Ag/Anatase TiO2 core–shell nanoparticles. Mater. Chem. Phys. 2008, 109, 108–183. [Google Scholar] [CrossRef]
  11. Demirörs, A.; van Blaaderen, A.; Imhof, A. A General Method to Coat Colloidal Particles with Titania. Langmuir 2010, 26, 9297–9303. [Google Scholar] [CrossRef] [PubMed]
  12. Hong, D.; Lyu, L.M.; Koga, K.; Shimoyama, Y.; Kon, Y. Plasmonic Ag@TiO2 Core−Shell Nanoparticles for Enhanced CO2 Photoconversion to CH4. ACS Sustain. Chem. Eng. 2019, 7, 18955–18964. [Google Scholar] [CrossRef]
  13. Karimipour, M.; Ebrahimi, M.; Abafat, Z.; Molaei, M. Synthesis of Ag@TiO2 core-shells using a rapid microwave irradiation and study of their nonlinear optical properties. Opt. Mater. 2016, 57, 257–263. [Google Scholar] [CrossRef]
  14. Zhang, D.; Song, X.; Zhang, R.; Zhang, M.; Liu, F. Preparation and Characterization of Ag@TiO2 Core-Shell Nanoparticles in Water-in-Oil Emulsions. EurJIC 2005, 9, 1643–1648. [Google Scholar] [CrossRef]
  15. Lee, P.; Meisel, D. Adsorption and Surface-Enhanced Raman of Dyes on Silver and Gold Sols. J. Phys. Chem. 1982, 86, 3391–3395. [Google Scholar] [CrossRef]
  16. Lee, W.; Yeop, J.; Heo, J.; Yoon, Y.J.; Park, S.; Jeong, J.; Shin, Y.; Kim, J.; An, N.; Kim, D.; et al. High colloidal stability ZnO nanoparticles independent on solvent polarity and their application in polymer solar cells. Sci. Rep. 2020, 10, 18055. [Google Scholar] [CrossRef] [PubMed]
  17. Giarola, M.; Sanson, A.; Monti, F.; Mariotto, G.; Bettinelli, M.; Speghini, A.; Salviulo, G. Vibrational Dynamics of Anatase TiO2: Polarized Raman Spectroscopy and Ab Initio Calculations. Phys. Rev. B 2010, 81, 174305-1–174305-7. [Google Scholar] [CrossRef]
  18. Joshi, N.; Jain, N.; Pathak, A.; Singh, J.; Prasad, R.; Upadhyaya, C.P. Biosynthesis of silver nanoparticles using Carissa carandas berries and its potential antibacterial activities. J. Sol-Gel Sci. Technol. 2018, 86, 682–689. [Google Scholar] [CrossRef]
Figure 1. (a) UV/Vis spectra of the initial suspension of Ag NPs in DMF (red), the starting mixture after adding the TBT solution (violet line), the suspension 90 min after reflux (black line), and the purified mixture after centrifugation and double washing in ethanol (blue line); (b) Raman spectra of Ag@TiO2 nanoparticles, the citrate-stabilized Ag NPs, and the synthesized TiO2 NPs at an excitation wavelength of 514.5 nm.
Engproc 35 00016 g001
Figure 2. (a) Stokes and anti-Stokes Raman spectra of Ag@TiO2 nanoparticles, collected every 5 K, in the temperature range 293.15 (dark blue line)–323.15 (dark red line) K. (b) Exponential fitting of the nanothermometric data of Ag@TiO2 nanocomposites (red dot and line) and for the anatase nanoparticles (blue squares and line) at 530 nm excitation wavelength. For each data sequence, the maximum and minimum error bars are shown with the same color code.
Engproc 35 00016 g002
Table 1. Raman nanothermometry data collected at 530 nm.
SampleLaser Power
[mW]
Experimental
Constant
Sensitivity at
295.15 K [K−1]
Relative Sensitivity
[K−1%]
Ag@TiO2 1.441.007 ± 0.0200.00120.26
TiO21.521.007 ± 0.0040.00120.24
Disclaimer/Publisher’s Note: The statements, opinions and data contained in all publications are solely those of the individual author(s) and contributor(s) and not of MDPI and/or the editor(s). MDPI and/or the editor(s) disclaim responsibility for any injury to people or property resulting from any ideas, methods, instructions or products referred to in the content.

