1. Introduction
With an increase in the average age of the global population over the last several decades, glaucoma has become an important global health concern that claims the eyesight of many patients annually. It is the second-leading cause of blindness with nearly 80 million people affected by the disease [
1]. Glaucoma-induced neuron damage is irreversible, which means that early detection is necessary since patients are often not aware of vision loss until a very advanced stage of the disease [
2]. One risk factor that is often indicative of glaucoma is an increase in a patient’s intraocular pressure (IOP) [
3], which is determined by the inflow and outflow of aqueous humor to the eye. The traditional way to measure the IOP change is by using Goldmann applanation tonometry (GAT) [
4]. This process uses a device to measure the force required to flatten a particular area on the cornea which can then be related to the intraocular pressure. For this technique, the patient must visit the doctor during office hours to take the IOP reading, and this generally involves the use of local anesthesia and multiple visits to the clinic. The problem with this technique is that IOP changes throughout the day as a person moves; in fact, fluid flow can be 50% lower during sleeping hours [
3,
5]. Such large variations mean that it is not possible for a singular pressure measurement taken at one time of the day to embody the entirety of a patient’s unique IOP trends that could signify glaucoma development. Therefore, there is a need for continuous IOP monitoring for early detection of glaucoma.
To continuously monitor the IOP, many invasive and non-invasive designs have been proposed in the literature. Implantable devices utilizing optical techniques or impedance-based devices have been proposed, but they require a surgical procedure which increases the cost and discomfort for the patient [
6,
7]. A non-invasive way of continuous monitoring of the IOP can be achieved by using contact lens-based designs, many of which have been proposed in the literature utilizing techniques such as strain-based sensing and microfluidics-based sensing. Designs utilizing impedance change due to changes in the curvature of the eye, which result from IOP change, and can provide an accuracy of up to 1 mmHg but need to be calibrated for each patient depending on the shape, radius of the cornea, and hydration level in the eye [
8,
9]. Soft contact lens-based designs utilizing microfluidic channels have been previously reported by our group [
10,
11]. These designs utilize an embedded micro-channel inside the lens which is partially filled with an incompressible liquid. When the intraocular pressure changes, the lens deforms slightly, and the fluid shifts inside the micro-channel. This movement of the fluid can then be related to the amount of pressure change. Experimental testing for these designs was reported, and an average fluid displacement of 40.8 µm/mmHg was achieved.
The design proposed in this article further utilizes the effect of deformation of the lens for detecting the IOP change. The design uses strategically placed holes on the lens such that their shape changes under the influence of IOP. The ratio of x length and y length of the holes is used as the factor to find the IOP. The placement, shape, and size of the holes is decided by conducting detailed COMSOL Multiphysics simulations. The performance of the optimized design using different commercially available materials is also simulated within a pressure range of 10 mmHg to 40 mmHg to test the feasibility of the design for intraocular pressure measurement.
2. Design and Working Principle
2.1. Operation of the Device
The operation of the proposed device is based on the correlation between the intraocular pressure and the change in curvature in human eyes. Multiple studies have been conducted showing that the curvature of the cornea can change up to 3 µm for a 1 mmHg change in IOP, whereas the curvature of the sclera can change up to 100 µm for a 1 mmHg IOP change [
12,
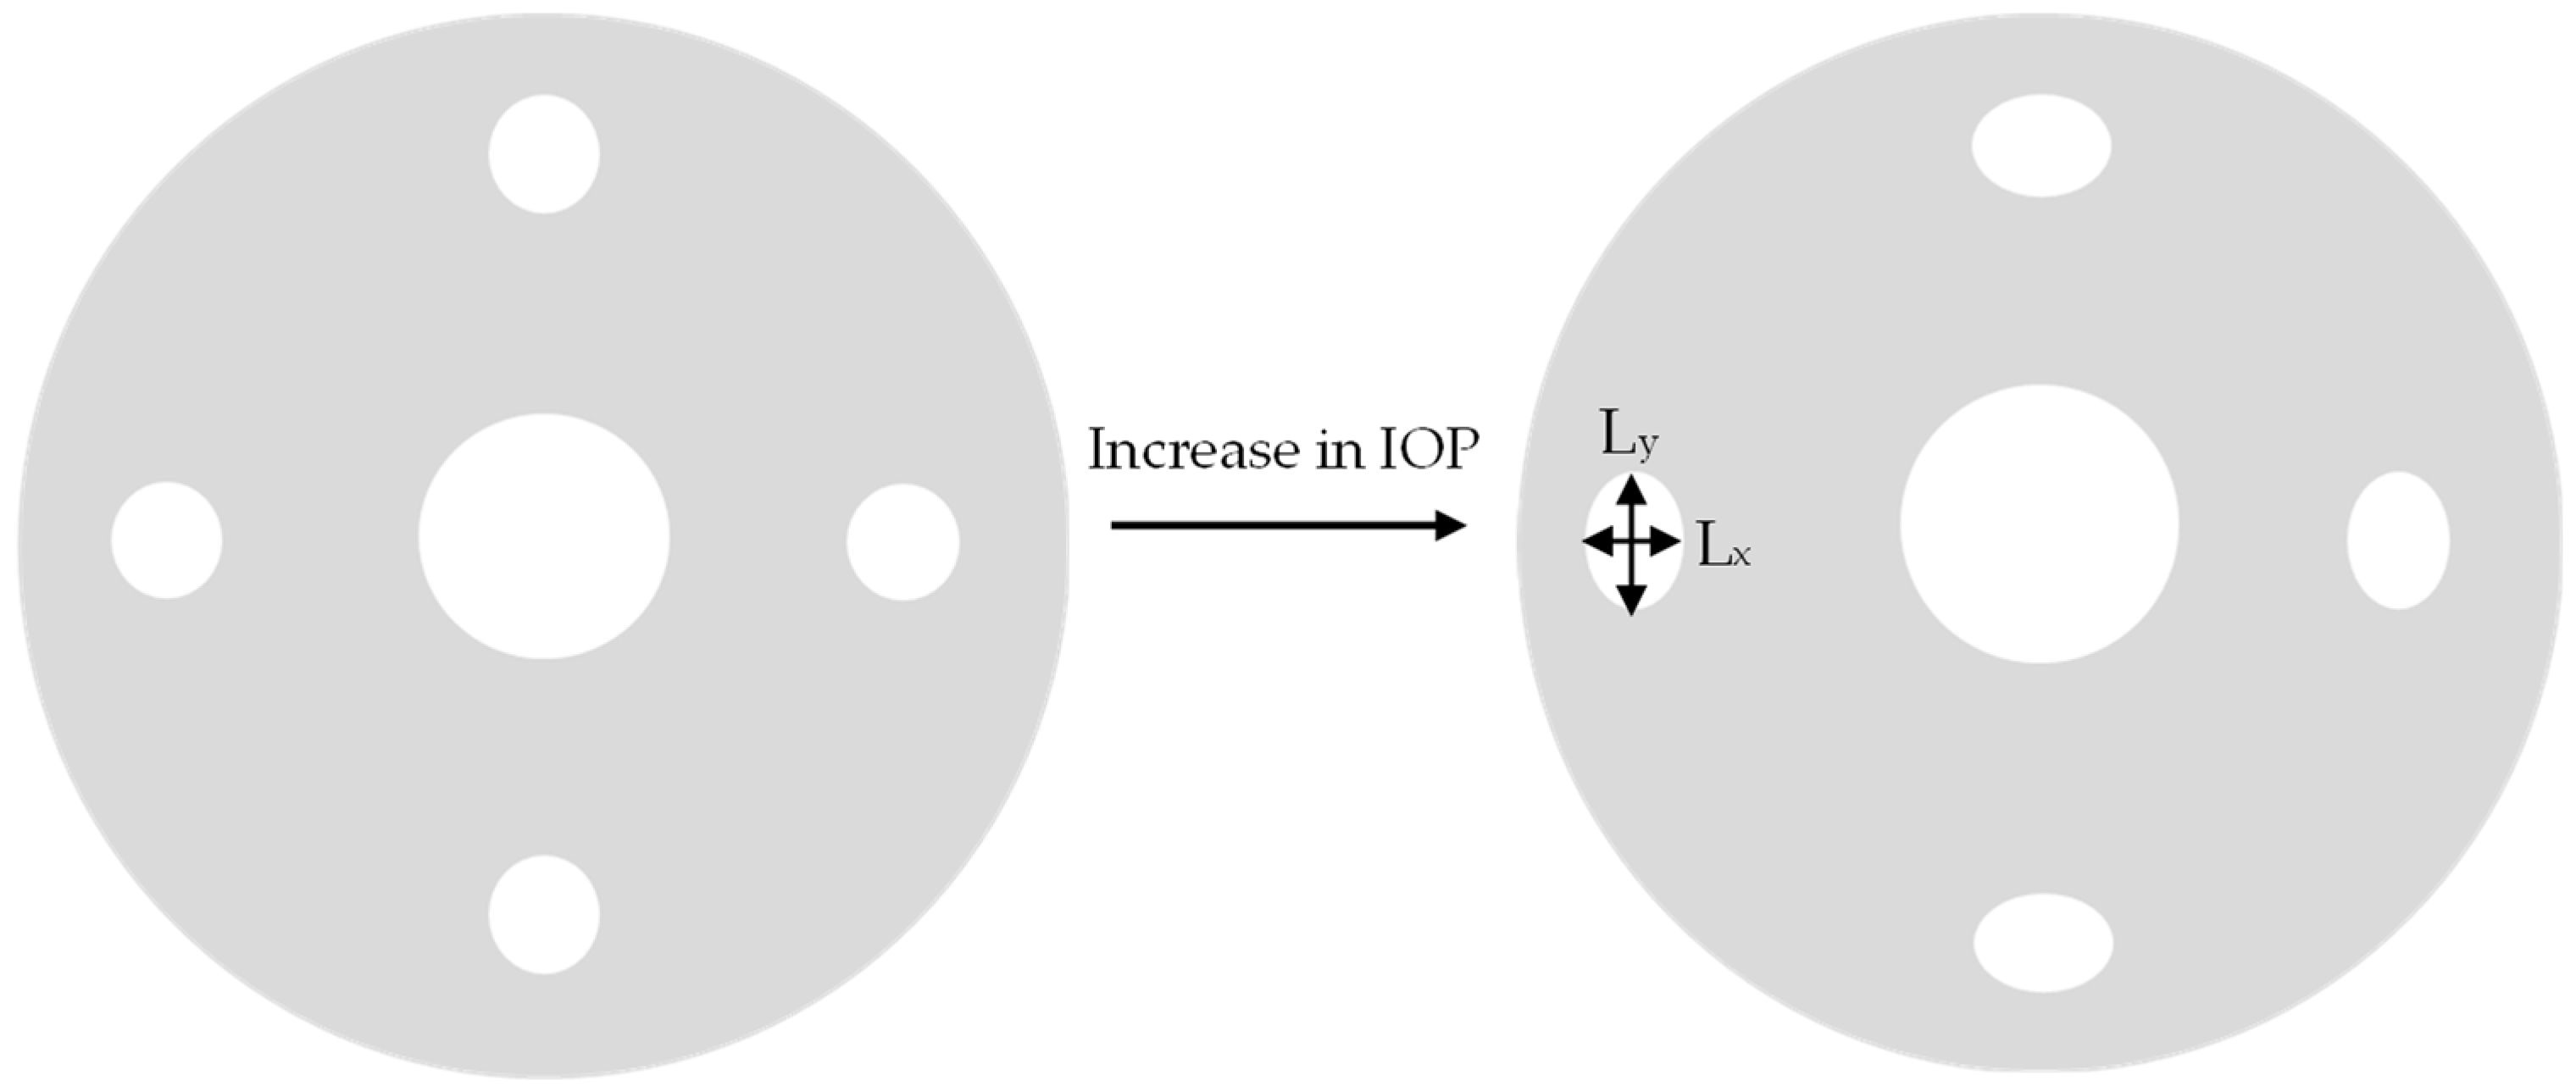
13]. This variation in the curvature under the influence of the IOP can be utilized to detect the pressure change. For the proposed design, custom polymer-based lenses as well as off-the-shelf lenses can be utilized. Contact lenses with strategically placed holes are used to detect the pressure change. As the pressure inside the eye changes, the shapes of the holes change with it. The ratio of diameters along x and y axes is used as the factor to find the IOP change.
Figure 1 schematically shows how the shapes of the holes change with a change in pressure.
The circular holes on the periphery transform into ellipses when the IOP increases, whereas the central hole expands equally in all directions. Therefore, the R value, which is the ratio of x length and y length of the holes, increases for the holes along the periphery and remains same for the central hole. Factors such as the number of holes, the diameter of holes, and the presence of the center hole have a significant effect on the sensitivity of the device as the R factor changes significantly with these parameters. The effect of these parameters on the performance of the device is discussed in subsequent sections.
The R value can be recorded using any imaging device such as a smartphone camera. Pictures of the eye can be taken periodically during the day; then, a mobile application using machine vision-based techniques can be used to measure the change in shape of the holes to get the R value and the corresponding intraocular pressure value, once the system has been calibrated. This allows the user as well as the physician to continuously monitor the IOP change. Similar techniques have been previously proposed [
10].
2.2. Parametric Optimization
The effect of factors such as hole size, number of holes, and the presence of the center hole on the performance of the device was studied using COMSOL Multiphysics. A uniform pressure ranging between 10 mmHg and 40 mmHg was applied, and the deformation at various points of interest was recorded. The effect of central hole was observed by keeping the same hole size and number of holes in the lens with the only difference being the presence or absence of the central hole of 6 mm diameter. The presence of a central hole allows for a much larger deformation of the holes on the periphery as can be seen in
Figure 2. This increased deformation can be attributed to the decrease in structural stiffness of the lens due to the presence of the central hole.
Figure 3 shows the R value at different pressures for both designs. The R value for the design with a central hole is nearly twice the value for the design without a center hole.
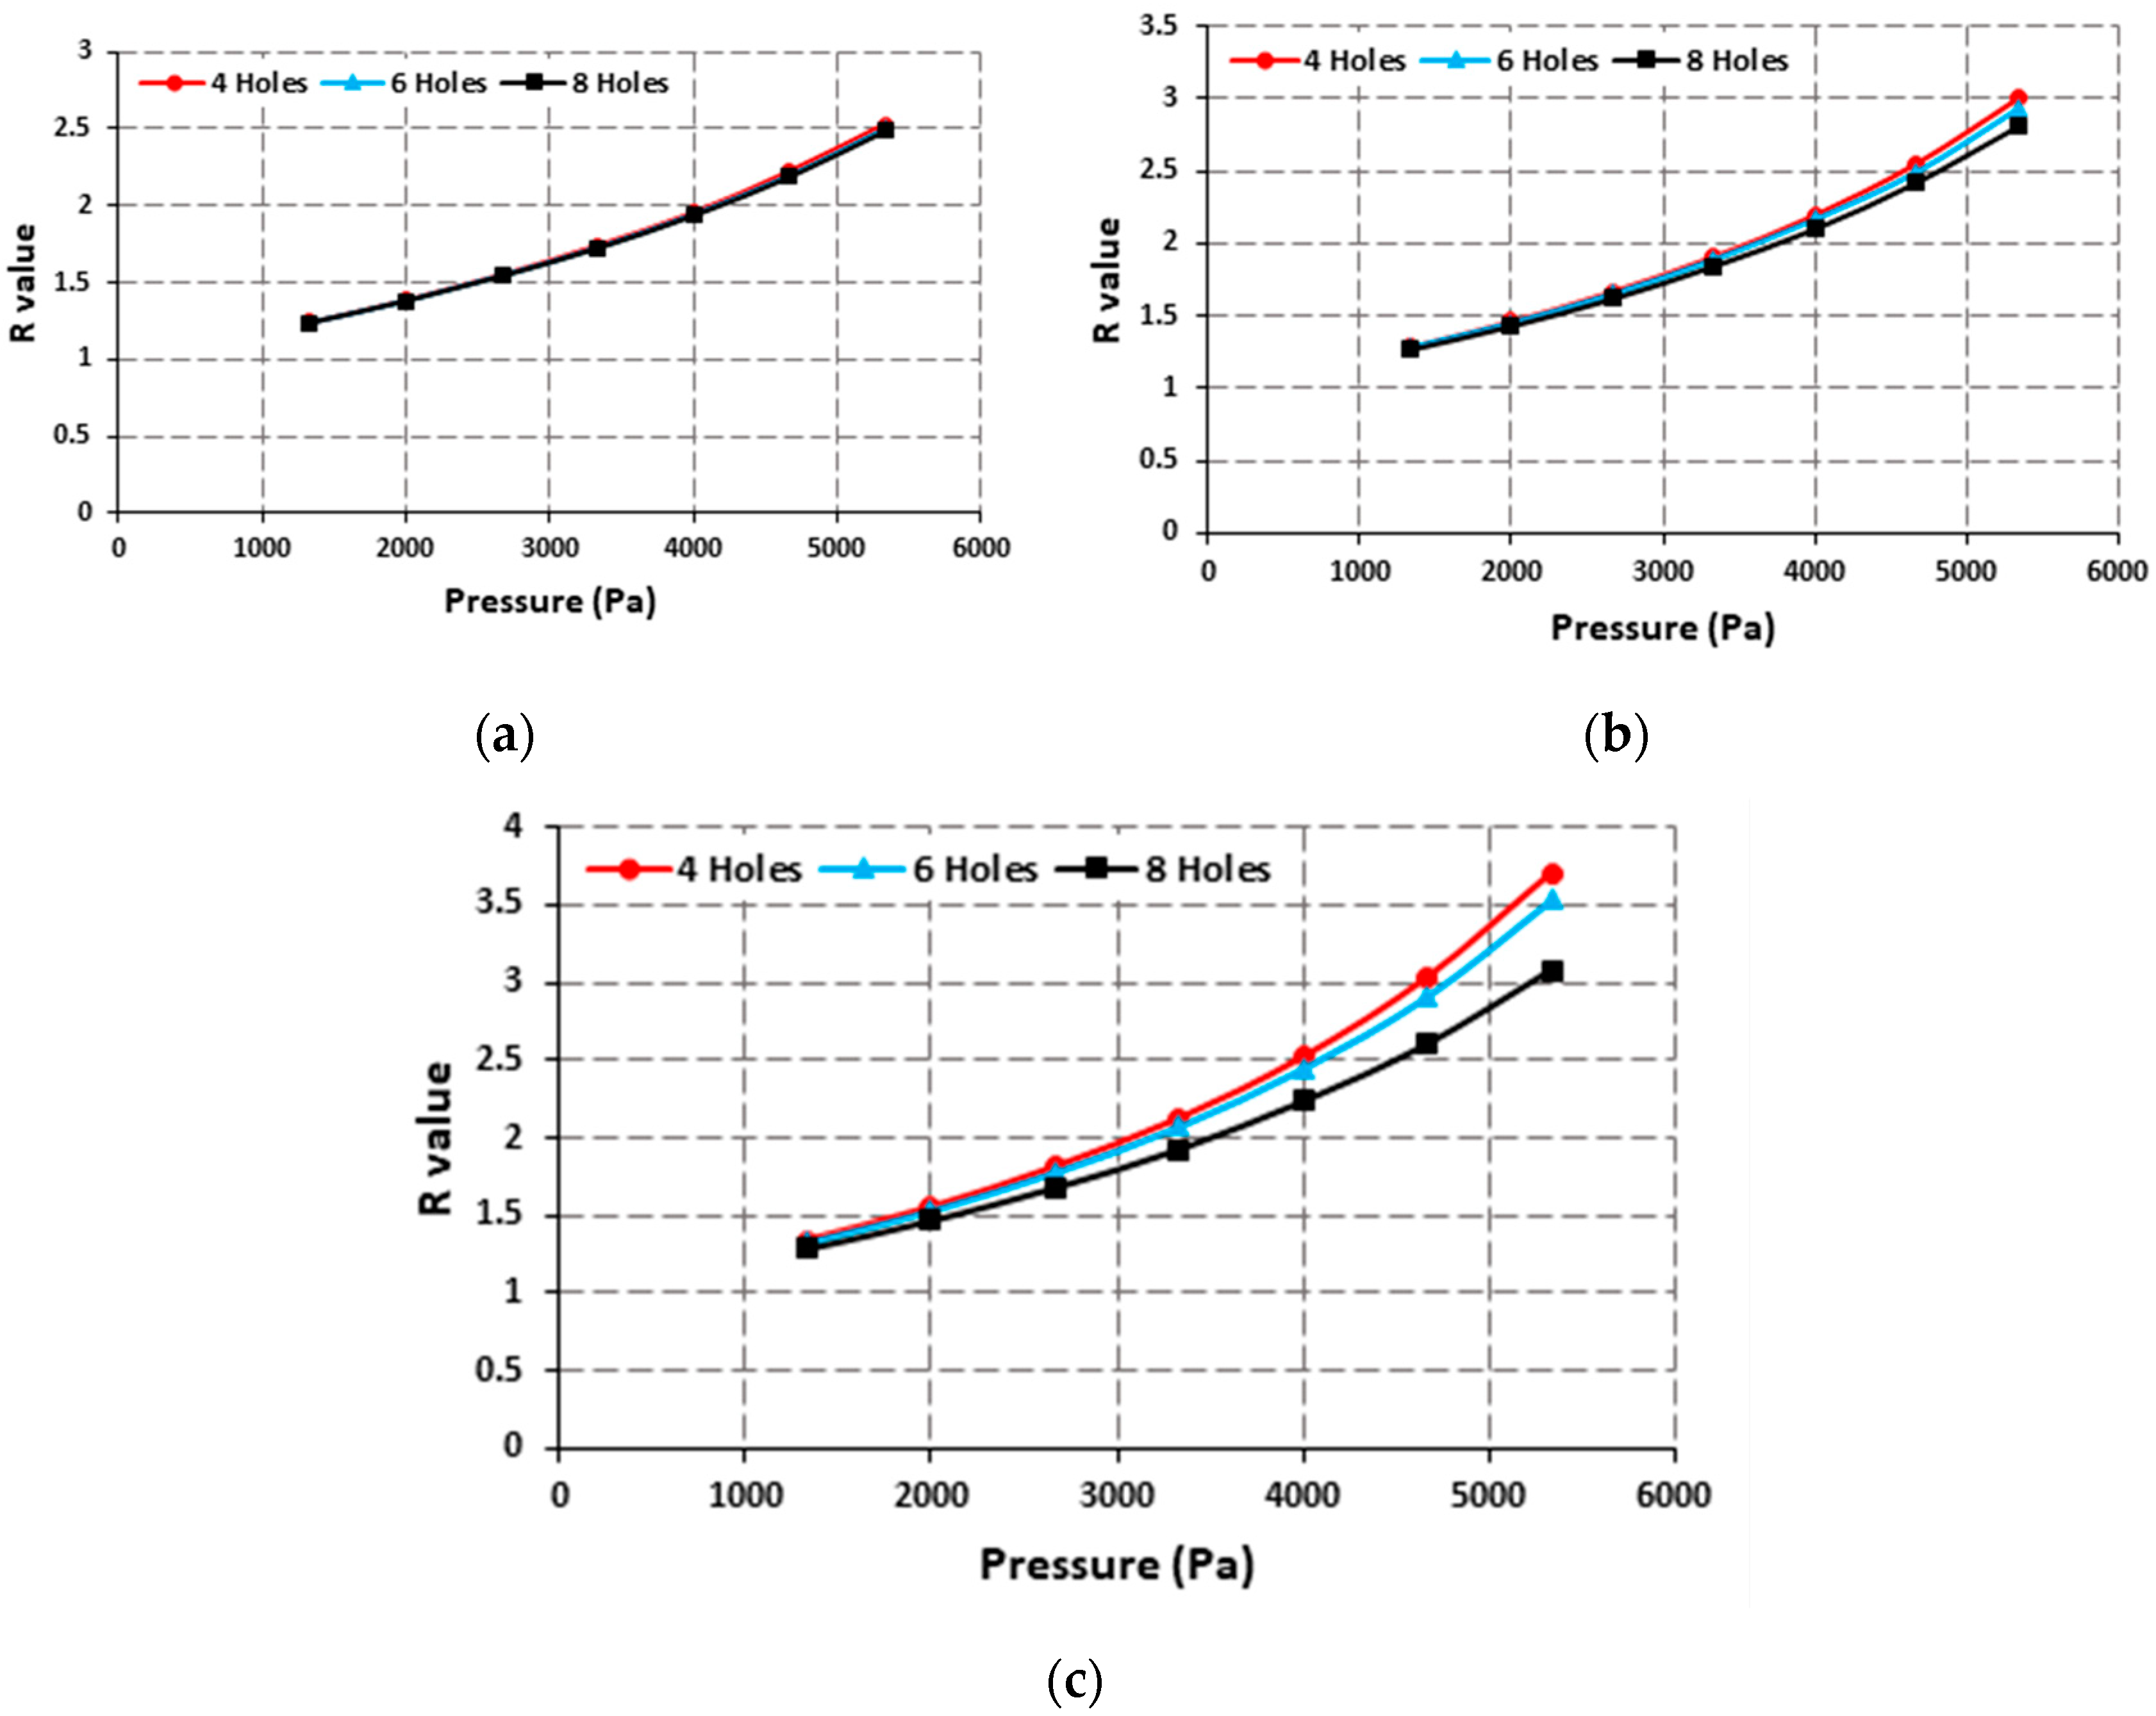
The effect of the size and number of holes was also simulated. The number of holes was varied between 4 to 8, and the size was varied from 1 mm to 2 mm. It was found that at a small size the number of holes had insignificant effect on the R value, but as the size was increased the effect of number of holes was more pronounced. The design with most holes provided the lowest R values, but the difference was within 15%. With a large size and large number of holes, most of the surface of the lens has empty spaces which affect the structural integrity and produce undesired deformation in the holes which results in the reduction of the overall R value.
Figure 4 shows the effect of the number of holes on the R value at different hole sizes.
The effect of hole size can also be observed from
Figure 4. The highest R values are achieved with a 2 mm holes size for any number of holes as can be seen in
Figure 4c. The highest R values are provided by the design with four holes with a size of 2 mm.
3. Results and Discussion
The parametric optimization of the designs showed that the best results were achieved with a lens design with a center hole and four holes on the periphery with a 2 mm diameter. The maximum R value of 3.71 was achieved giving a sensitivity value of 0.1237 per mmHg or 0.696 per kPa, as can be seen from
Figure 5.
The proposed design can be fabricated using polymers such as PDMS which is already a widely used material for biosensor designs due to its biocompatibility. An additional benefit of using PDMS can be the ease of modification of its properties by changing the composition or curing temperature [
14,
15]. The proposed design also allows for easy fabrication of the lenses either by using molds to make the holes during the fabrication of the lenses or by punching the holes in the finished lenses. This reduces the complexity as well as cost compared to some other lens-based designs which require complex fabrication techniques. Additionally, the performance of the device can be further enhanced by using polymers with low elastic modulus values to encourage higher deformation and therefore a higher R value. Commercially available lenses use different polymers with one of the most widely used ones being hydrogel-based lenses. One of the main benefits of the proposed design is that commercially available lenses can be utilized just by creating the holes in the appropriate areas.
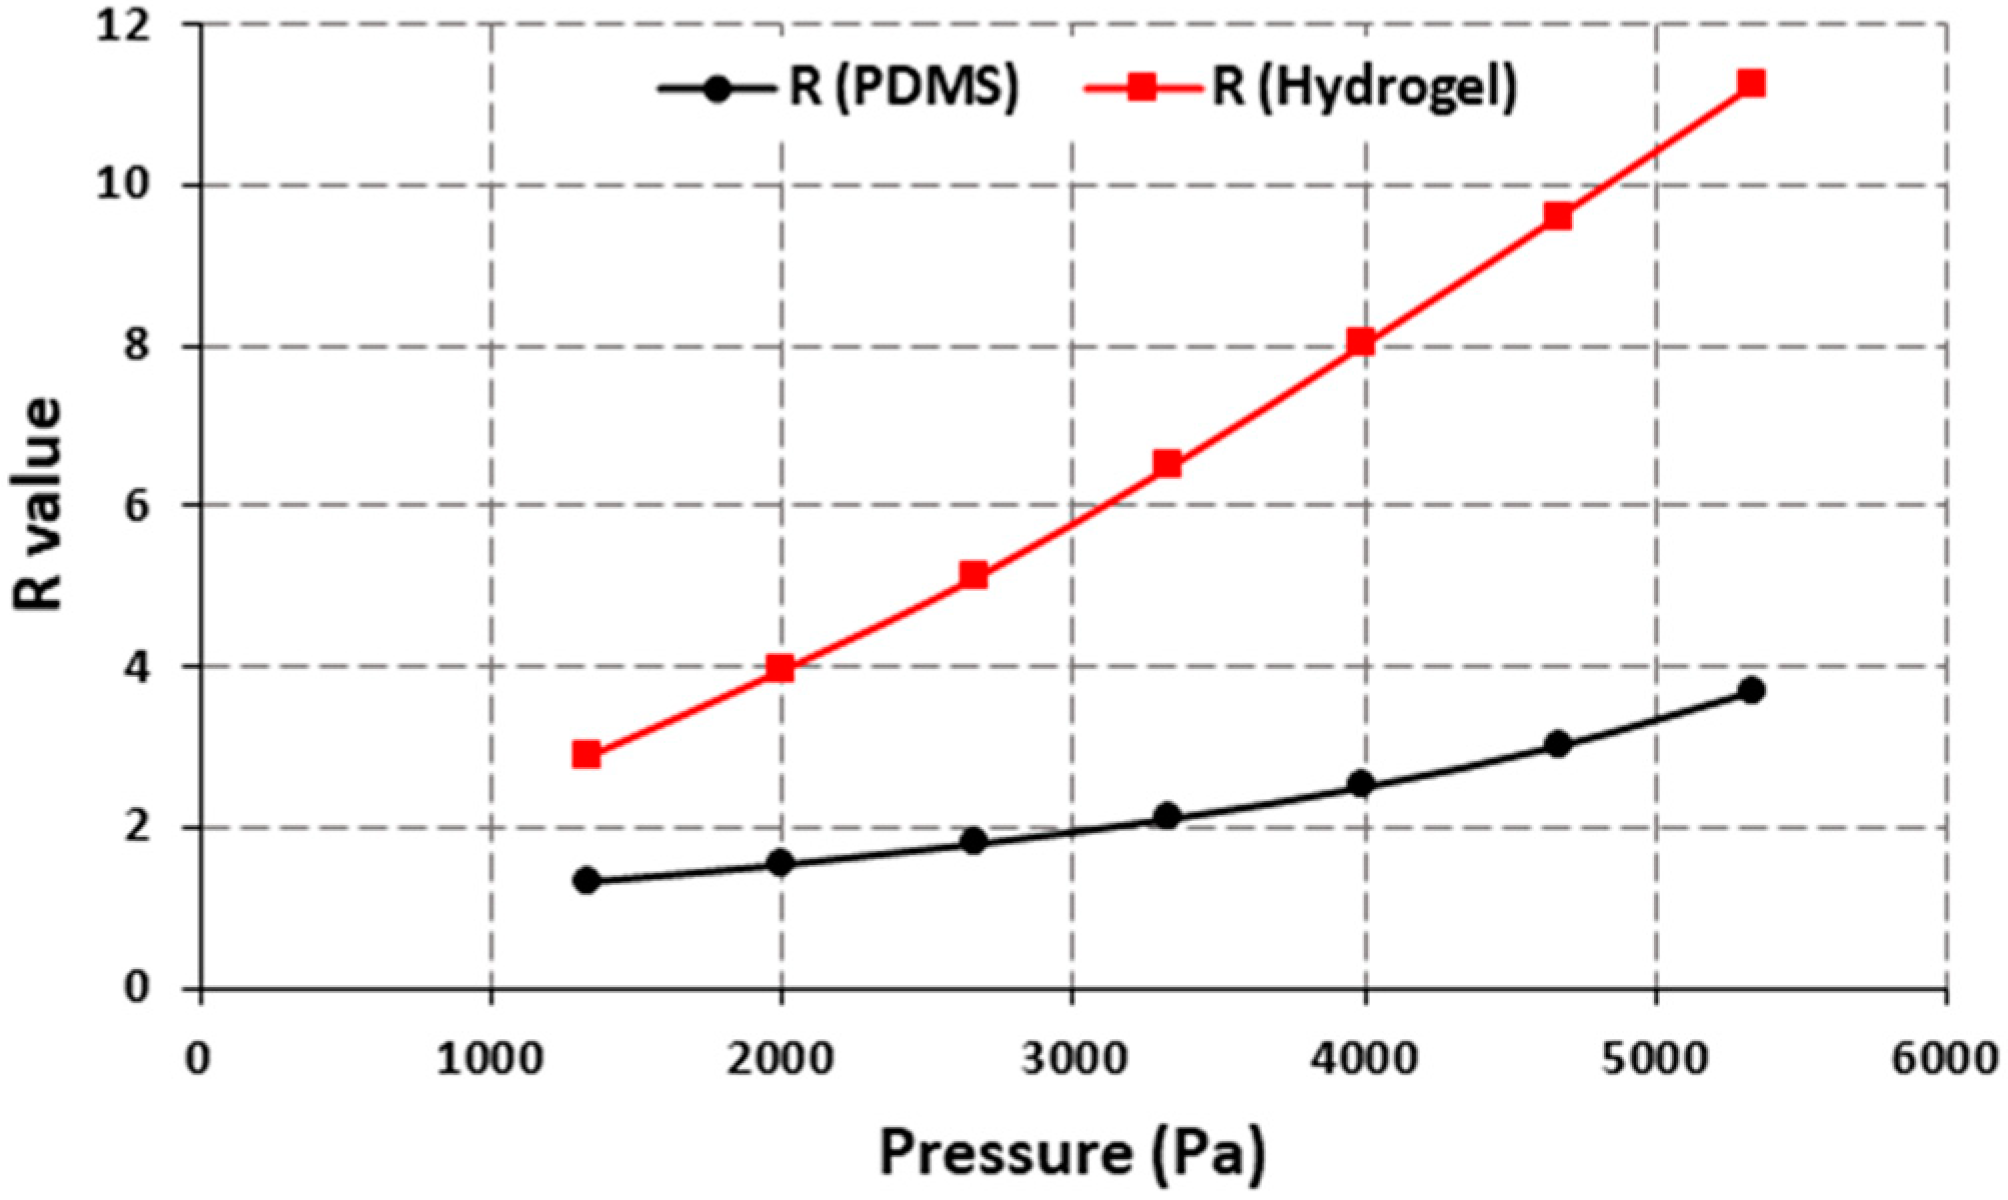
Figure 6 shows the comparison between PDMS and hydrogel-based lens designs which have a center hole and four holes with a 2 mm diameter on the periphery. Different types of hydrogels are used in making contact lenses, and their properties vary based on the curing temperature, water content, etc. The hydrogel used for the simulation had 38% water content with an elastic modulus of 0.5 MPa and a density of 1160 kg/m
3 [
16]. The results show that the sensitivity is increased nearly three times to 0.39 per mmHg by using the hydrogel which enhances the performance of the device.
The COMSOL simulations presented here show the viability of the design for continuous monitoring of IOP throughout the day. By modifying commercially available lenses, the cost of manufacturing can be drastically reduced leading to a cost-effective method for IOP monitoring. The experimental results for the optimized design will be reported in future studies where porcine eyes of different shapes and sizes will be used to demonstrate the operation of the device, as well as the effect of variation of eye sizes on the performance of the device.
4. Conclusions
Continuous monitoring of the intraocular pressure can lead to early diagnosis and in time treatment of glaucoma, but the traditionally used techniques for measuring IOP require repeated visits to the clinic and provide a fraction of the information about the patient’s IOP pattern. Non-invasive techniques such as the use of contact lens-based designs can provide a solution for continuous monitoring of IOP. The contact lens design presented here uses carefully placed holes in custom-made or commercially available lenses to measure the IOP based on the deformation of the holes. The ratio of x length and y length of the holes is related to the change in IOP. Extensive COMSOL Multiphysics simulations on optimization of the design are presented. The optimized design can achieve a sensitivity value of 0.39 per mmHg using commercially available lens material.
Author Contributions
Conceptualization, T.A. and Y.L.; methodology, S.A.R.B., C.F. and Y.L.; software, S.A.R.B. and C.F.; validation, T.A. and Y.L.; writing—original draft preparation, S.A.R.B. and C.F.; writing—review and editing, S.A.R.B., Y.L. and T.A.; visualization, S.A.R.B. and Y.L.; supervision, Y.L.; project administration, T.A. and Y.L. All authors have read and agreed to the published version of the manuscript.
Funding
This research was funded by the National Science and Engineering Research Council of Canada (NSERC).
Institutional Review Board Statement
Not applicable.
Informed Consent Statement
Not applicable.
Data Availability Statement
Not applicable.
Conflicts of Interest
The authors declare no conflict of interest.
References
- Kingman, S. Glaucoma is second leading cause of blindness globally. Bull. World Health Organ. 2004, 82, 887–888. [Google Scholar] [PubMed]
- Lee, D.A.; Higginbotham, E.J. Glaucoma and its treatment: A review. Am. J. Health-Syst. Pharm. 2005, 62, 691–699. [Google Scholar] [CrossRef] [PubMed]
- Križaj, D. What is glaucoma? In Webvision: The Organization of the Retina and Visual System [Internet]; University of Utah Health Sciences Center: Salt Lake City, UT, USA, 2019. [Google Scholar]
- Arend, N.; Hirneiss, C.; Kernt, M. Differences in the measurement results of Goldmann applanation tonometry with and without fluorescein. Ophthalmologist 2014, 111, 241–246. [Google Scholar] [CrossRef] [PubMed]
- Arora, T.; Bali, S.J.; Arora, V.; Wadhwani, M.; Panda, A.; Dada, T. Diurnal versus office-hour intraocular pressure fluctuation in primary adult onset glaucoma. J. Optom. 2015, 8, 239–243. [Google Scholar] [CrossRef] [PubMed]
- Araci, I.E.; Su, B.; Quake, S.R.; Mandel, Y. An implantable microfluidic device for self-monitoring of intraocular pressure. Nat. Med. 2014, 20, 1074–1078. [Google Scholar] [CrossRef] [PubMed]
- Chen, P.J.; Rodger, D.C.; Saati, S.; Humayun, M.S.; Tai, Y.C. Implantable parylene-based wireless intraocular pressure sensor. In Proceedings of the 2008 IEEE 21st International Conference on Micro Electro Mechanical Systems, Tucson, AZ, USA, 13–17 January 2008; pp. 58–61. [Google Scholar]
- Sánchez, I.; Laukhin, V.; Moya, A.; Martin, R.; Ussa, F.; Laukhina, E.; Guimera, A.; Villa, R.; Rovira, C.; Aguilo, J.; et al. Prototype of a nanostructured sensing contact lens for noninvasive intraocular pressure monitoring. Investig. Ophthalmol. Vis. Sci. 2011, 52, 8310–8315. [Google Scholar] [CrossRef] [PubMed]
- Pang, Y.; Li, Y.; Wang, X.; Qi, C.; Yang, Y.; Ren, T.L. A contact lens promising for non-invasive continuous intraocular pressure monitoring. RSC Adv. 2019, 9, 5076–5082. [Google Scholar] [CrossRef]
- Campigotto, A.; Leahy, S.; Zhao, G.; Campbell, R.J.; Lai, Y. Non-invasive Intraocular pressure monitoring with contact lens. Br. J. Ophthalmol. 2020, 104, 1324–1328. [Google Scholar] [CrossRef]
- Campigotto, A.; Lai, Y. A novel non-invasive wearable sensor for intraocular pressure measurement. Med. Devices Sens. 2020, 3, e10086. [Google Scholar] [CrossRef]
- Douthwaite, W.A.; Lam, A.K. The effect of an artificially elevated intraocular pressure on the central corneal curvature. Ophthalmic Physiol. Opt. 1997, 17, 18–24. [Google Scholar] [CrossRef]
- Pierscionek, B.K.; Asejczyk-Widlicka, M.; Schachar, R.A. The effect of changing intraocular pressure on the corneal and scleral curvatures in the fresh porcine eye. Br. J. Ophthalmol. 2007, 91, 801–803. [Google Scholar] [CrossRef] [PubMed]
- Guidi, G.; Hughes, T.C.; Whinton, M.; Brook, M.A.; Sheardown, H. The effect of silicone hydrogel contact lens composition on dexamethasone release. J. Biomater. Appl. 2014, 29, 222–233. [Google Scholar] [CrossRef] [PubMed]
- Lamberti, A.; Marasso, S.L.; Cocuzza, M.J.R.A. PDMS membranes with tunable gas permeability for microfluidic applications. RSC Adv. 2014, 4, 61415–61419. [Google Scholar] [CrossRef]
- Tighe, B.J.; Mann, A. Physicochemical properties of hydrogels for use in ophthalmology. In Biomaterials and Regenerative Medicine in Ophthalmology; Woodhead Publishing: Sawston, UK, 2016; pp. 75–100. [Google Scholar]
| Disclaimer/Publisher’s Note: The statements, opinions and data contained in all publications are solely those of the individual author(s) and contributor(s) and not of MDPI and/or the editor(s). MDPI and/or the editor(s) disclaim responsibility for any injury to people or property resulting from any ideas, methods, instructions or products referred to in the content. |
© 2023 by the authors. Licensee MDPI, Basel, Switzerland. This article is an open access article distributed under the terms and conditions of the Creative Commons Attribution (CC BY) license (https://creativecommons.org/licenses/by/4.0/).


