Abstract
The paper contains the results of a recognition technique based on the comparison of statistical and stochastic characteristics of the wavelet coefficients of energy density describing the emission energy of a nanocrystal with a quantum dot according to the Brus equation for traditional and perspective materials for quantum dots (CdSe, GaAs, CdTe, PbS) used in optoelectronic engineering and technology, in order to analyze their characteristics.
1. Introduction
The application of quantum structures in the design of optical devices and instruments offers an opportunity to significantly expand the range of parameters and purposes of traditional and perspective materials [1]. In this paper, we study the dependence of the total energy of a quantum dot (QD) and the emission energy of nanocrystals with QDs on its size (radius) (CdSe, GaAs, CdTe, PbS), representing nano-objects of spherical shape, bounded in three directions. The analysis is based on a complex approach integrating theoretical research methods, mathematical modeling and numerical methods, and wavelet transform methods.
Wavelet transform methods are a powerful tool to analyze and process signals and functions that are non-stationary in time or heterogeneous in space in order to identify local features. They are divided into continuous (for analyzing signals and time series) and discrete wavelet transforms (for analyzing signals and time series images) [1,2,3].
Three approaches [1,2], which are based on comparing wavelet coefficients (continuous wavelet transform (CWT)) and signal components (detailing and approximating coefficients in discrete wavelet transform (DWT), are used to recognize signals of a different nature:
- Statistical characteristics (mean, dispersion, standard deviation) are used to conduct a wavelet coefficient (CWT) and signal component (DWT) analysis.
- An energy spectrum analysis examines the energy spectrum and is used only for signal components (DWT).
- Stochastic characteristics (fractal dimensionality, Hurst index, correlation dimensionality and phase space dimensionality) evaluate the chaotic nature of wavelet coefficients (CWT) and signal components (DWT).
Continuous wavelet transform (CWT) is chosen as the analysis tool; the result is a wavelet spectrogram with statistical and stochastic characteristics used for recognition.
2. Theoretical Research and Analytical Part
Most modern, traditional and perspective materials used in optoelectronic engineering and technology are nanostructures with QDs, which determine the properties of materials, including their optical properties [4]. QDs are spherical-shaped nano-objects bounded in three directions. QDs are characterized by the effect of the dimensional quantization of energy states by changing the particle size. Decreasing the size of QDs leads to an increased degree of confinement, and the width of the band gap increases as a result of the formation of a bound electron-hole pair (exciton) with a higher energy.
The total energy of QD is the sum of the band gap energy between the occupied level and unoccupied energy level, confinement energies of the hole and the excited electron, and the bound energy of the exciton:
is the reduced mass of the exciton system; is the effective mass of the electron; d is diameter of the confinement; is the size-dependent dielectric constant of the semiconductor; is the Rydberg energy.
Consider the effect of the QD size on their optical properties by calculating the emission energy of a nanocrystal with QDs varying in radius from 2 to 10 nm, using the Brus equation:
where is the band gap energy between occupied level and unoccupied energy level, h is the Planck constant ( J·Hz), r is the radius of the spherical particle (2 to 10 nm), is the effective mass of the electron, and is the effective mass of the hole (Table 1).

Table 1.
Parameters for calculating for different materials.
The energy of the band gap (Eg) is calculated using the following equation:
n is energy level (1, 2, 3...), h is the Planck constant ( [J·Hz), is the effective point charge mass (Table 1), and r is the radius of the spherical particle.
Then, the Brus Equation (2) is as follows:
Table 2 presents the results of calculating the value for CdSe, GaAs, CdTe, PbS, based on the data in Table 1 and Equation (4) [5].
Table 2.
Results of calculations of for different materials (CdSe, CdTe, GaAs, PbS).
Visible spectrum light includes light from violet to red, and a wavelength from 380 nm to 750 nm, which corresponds to the energy range of the photon from 2.75 eV to 1.98 eV. Table 2 shows that the wavelength of the emitted photon depends on the QD radius. Therefore, a smaller point radius is closer to the blue part of the spectrum, while a larger point radius is closer to the red part of the spectrum. Consequently, changing and controlling the size of QDs can help to obtain a certain wavelength of emissions, which determines the color of light.
Below are graphs of the emission energy of a nanocrystal as a function of the radius of a spherical QD (Figure 1a) and graphs of the wavelength dependence from the radius of a spherical QD (Figure 1b).
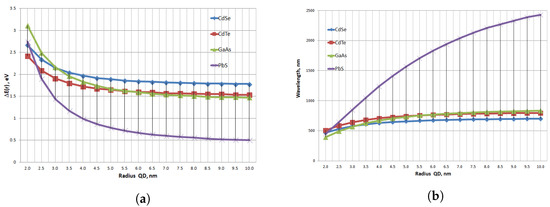
Figure 1.
Graph of the dependence of the emission energy of a nanocrystal on the radius of a QD (a) and a graph of the dependence of wavelength on the radius of a QD (b) for various materials (CdSe, CdTe, GaAs, PbS).
The analysis of the dependencies (Figure 1a,b) shows that with increasing radius QD the emission energy of the nanocrystal decreases and the wavelength increases. PbS material containing lead (Pb) differs from others (CdSe, CdTe, GaAs) in the type of dependence (Figure 1a,b—graphs have a high rate of change; Figure 1b—graphs have a different tangent sign of the tangent angle) and values (Figure 1a—a large spread of the values of the characteristic in the range from 2 to 7; Figure 1b—a large spread of the wavelength value over the entire interval).
The materials considered in this paper are of interest in terms of optical properties describing the emission energy of the nanocrystal and the wavelength, which depend on the size (radius) of the QD, so we calculate the energy density of the signal given the Formula [3]:
where the continuous wavelet transform (CWT) is given by [3,4]:
where is a real wavelet-forming function, often referred to simply as a wavelet; a is the scaling parameter (the inverse of the frequency); b is the shift parameter (analog of time).
For effective data analysis with continuous wavelet transformation, it is necessary to carefully select a family of wavelets, according to the specifics of the research, in order to obtain the best conversion result. This is one of the reasons for the significant variety of wavelet functions, many of which are focused on the wavelet transformation of certain classes of signals and other analysis and synthesis tasks [1,2,6].
Below is the signal energy density based on a continuous wavelet transform (CWT) with a maximum scale of 64 and a step of 1 using a Gaussian wavelet of the 1st order (Table 3).
Table 3.
Energy density of the dependences of the emission energy of a nanocrystal (Figure 1a) based on a continuous wavelet transform and its visualizations-scalograms (n = 64; dn = 1).
For analysis and recognition, we first use statistical characteristics; however, before that, we consider the cross sections of the resulting surface, and the energy density of each material at different scale values to justify the feasibility of application (Figure 2).
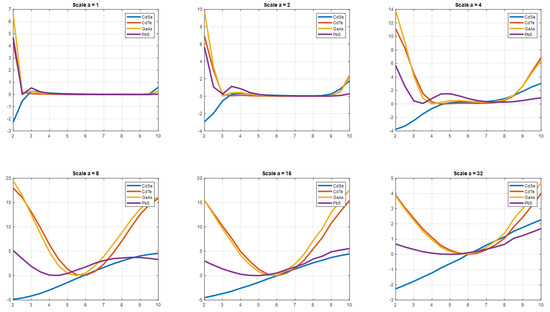
Figure 2.
Graphs of cross sections of signal energy density at scales 1, 2, 4, 8, 16, 32 (Gaussian wavelet of the 1st order): horizontal axis—radius QD (nm), vertical axis—values of wavelet coefficients of energy density.
For each section, we calculate statistical indicators and present the results in the form of graphs and radar charts grouped by statistical characteristics and cross-section scales (1, 2, 4, 8, 16, 32) (Figure 3 and Figure 4).
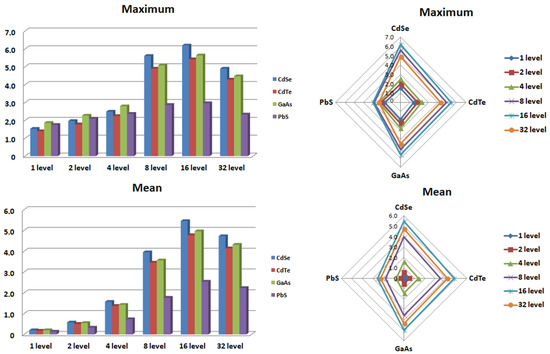
Figure 3.
Graphs and radar charts of statistical characteristics (maximum and mean) of cross sections (Figure 2) of signal energy density at scales 1, 2, 4, 8, 16, 32.
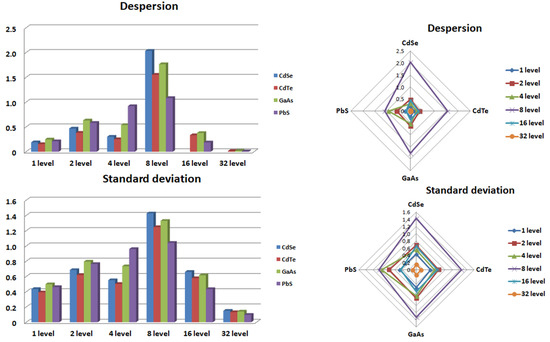
Figure 4.
Graphs and radar charts of statistical characteristics (Dispersion and Standard deviation) of cross sections (Figure 2) of signal energy density at scales 1, 2, 4, 8, 16, 32.
The analysis of the graphs in Figure 3 and Figure 4 shows that the mean will be the most informative and has the highest diagnostic ability if a scale equal to one or two is excluded from the analysis.
The obtained characteristics strongly depend on the wavelet function, which is used for continuous wavelet transformation. Figure 5 shows graphs of the cross sections of the signal energy density at scales 1, 2, 4, 8, 16, 32 and the same dependencies, except that the “Mexican Hat” wavelet is taken as a wavelet function.
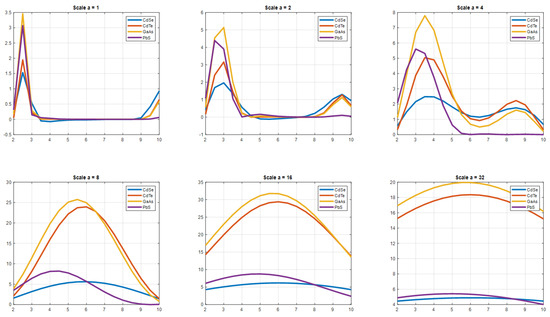
Figure 5.
Graphs of cross sections of signal energy density at scales 1, 2, 4, 8, 16, 32 (“Mexican Hat” wavelet): horizontal axis—the radius of the quantum dot (nm), vertical axis—the values of the wavelet coefficients of energy density.
In the next step, for analysis and recognition, we will use stochastic characteristics, in the form of entropy values, for the energy density obtained using various wavelet functions (Table 4).
Table 4.
The value of the energy density entropy for various wavelet functions and calculation algorithms (setting—Shanon, LogEnerge).
The analysis of the values in Table 4 shows that the entropy value does not depend on the wavelet function, which is used in the continuous wavelet transform. The obtained values have a diagnostic ability.
3. Conclusions
This paper presents the results of a recognition technique based on a comparison of statistical and stochastic characteristics of the wavelet coefficient of energy density describing the emission energy of a nanocrystal with a quantum dot based on the Brus equation for traditional and perspective materials for quantum dots (CdSe, GaAs, CdTe, PbS), used in optoelectronic engineering and technology [7]. An analysis of techniques has shown that the statistical characteristics strongly depend on the wavelet function, which is used to implement a continuous wavelet transform, while the stochastic characteristic, in the form of entropy, has good diagnostic ability and does not depend on the type of wavelet function. Further research is planned for the application of wavelet transforms to extended spectrum materials on spherical QDs used in optoelectronics, as well as research and comparisons of the total energy of quantum dots (1) using wavelet analysis for materials such as CdSe and CdTe.
Author Contributions
Conceptualization, V.B.; methodology, E.K.; software, E.K.; validation, S.D.; writing—original draft preparation, S.D.; writing—review & editing, V.B. All authors have read and agreed to the published version of the manuscript.
Funding
The paper is prepared under partial support of Russian Science Foundation (RSF) (project No. 22-29-00466, 14 January 2022).
Institutional Review Board Statement
Not applicable.
Informed Consent Statement
Not applicable.
Data Availability Statement
Not applicable.
Conflicts of Interest
The authors declare no conflict of interest.
References
- Smolentsev, N.K. Fundamentals of Wavelet theory. Wavelets in MATLAB; DMK Press: Moscow, Russia, 2008. [Google Scholar]
- Zakharov, A.A.; Kozhanova, E.R.; Tkachenko, I.M. Comparative Characteristics of Classical Fourier Transform and Continuous Wavelet Transform Applications: Tutorial; Saratov State Technical University: Saratov, Russia, 2012. [Google Scholar]
- Lazorenko, O.V.; Lazorenko, S.V.; Chernogor, L.F. Wavelet analysis of model signals with features. 1. Continuous wavelet transform. Radiophys. Radio Astron. 2007, 12, 182–204. [Google Scholar]
- Brkić, S. Optical properties of quantum dots. Eur. Int. J. Sci. Technol. 2016, 5, 98–107. [Google Scholar]
- Belyaev, V.V.; Kozhanova, E.R.; Tkachenko, I.M.; Marusin, A.V. Mathematical modeling of optical amplifier processes with modification of the active area. In Proceedings of the 2022 International Conference Laser Optics (ICLO), St.Petersburg, Russia, 20–24 June 2022; p. 1. [Google Scholar] [CrossRef]
- Tkachenko, I.M.; Kozhanova, E.R.; Belyaev, V.V.; Yazbeck, H. Comparative analysis of application of wavelet analysis for the recognition of element composition nanostructures. J. Phys. Conf. Ser. 2019, 1309, 012020. [Google Scholar] [CrossRef]
- Belyaev, V.; Yazbek, H. Application of quantum dot technology for electro-optical and optoelectronic devices. Electron. Sci. Technol. Bus. 2020, 9, 131–139. [Google Scholar]


Disclaimer/Publisher’s Note: The statements, opinions and data contained in all publications are solely those of the individual author(s) and contributor(s) and not of MDPI and/or the editor(s). MDPI and/or the editor(s) disclaim responsibility for any injury to people or property resulting from any ideas, methods, instructions or products referred to in the content. |
© 2023 by the authors. Licensee MDPI, Basel, Switzerland. This article is an open access article distributed under the terms and conditions of the Creative Commons Attribution (CC BY) license (https://creativecommons.org/licenses/by/4.0/).