Abstract
The regional climate model (RegCM4) was used to project the maximum and minimum air temperatures (Tmax and Tmin) of Egypt considering the worst-case scenario: Representative Concentration Pathway 8.5 (RCP8.5). To achieve this goal, the spatial pattern of the simulated Tmax and Tmin was first examined. After that, the simulated Tmax and Tmin were bias-corrected in the historical period with respect to station observations using the Linear-Scaling (LS) technique. Finally, the LS was used to correct the two future scenarios. To downscale the RegCM4, the medium resolution of the Earth System Model of the Max Planck Institute (MPI-ESM-MR) was used to provide the lateral boundary condition and sea surface temperature. The results showed that both Tmax and Tmin exhibit the highest increase in the far-future period (2081–2100) particularly over Western Egypt, the Red Sea, and Upper Egypt (by 4–6 °C). Additionally, the RegCM4 performance is remarkably improved when the LS method is used. Such performance is indicated by a low mean bias in the validation period compared to the evaluation period over majority of stations. Further, the added value of the LS is noted in Tmin more than Tmax. Therefore, the RegCM4 can be used to project the Tmax and Tmin using the LS over the location of interest. In addition, using multiple General Circulation Models (GCMs) is necessary to account for uncertainty associated with the atmospheric forcing.
1. Introduction
Extreme weather events (e.g., heat-waves) have become more destructive and frequent with severe impacts on communities, cities, and island nations and agricultural activities. In particular, General Circulation Models (GCMs)—participated in the fifth phase of the coupled model intercomparison project (CMIP5)—which show a gradual increase of annual temperatures in Northern Africa, higher than average [1]. The authors of [2] examined the changes in temperature and precipitation using the latest Coupled Model Intercomparison Project (CMIP6) simulations for Africa under the three Shared Socioeconomic Pathways (SSPs). They found that future warning is not uniform over Africa and varies regionally, which demand the necessity of downscaling the GCM dataset using Regional Climate Model (RCM). However, GCMs are not suitable for studying extreme phenomena over a region such as MENA where climate fluctuations are subject to enhanced spatial heterogeneity, due to their coarse spatial resolution.
The authors of [3] used the Regional Climate Model ALADIN-Climate to investigate future changes of temperature, precipitation, and associated extreme events in the Middle East and North Africa (MENA) region. They found that the model shows a good ability to capture the numbers of heatwaves (HWN), with an absolute mean bias not exceeding 0.4 in approximately the whole domain. Additionally, the length of the longest heat-wave (HWD) modelled was also satisfactory compared with the reanalysis, despite some overestimations in parts of Saudi Arabia and Egypt and underestimations along the African monsoon regions south of the domain. Moreover, they found that the heat wave magnitude will intensify the most over Morocco, Western Algeria, Libya, Egypt, and Iran. Such intensification is more often noted under the RCP8.5 future scenario than the RCP4.5 scenario.
Bias-correction techniques are valuable tools for correcting the future projections of the Tmax and Tmin. For instance, the authors of [4] examined the effect of climate change on the simulated Tmax and Tmin as well as the total rainfall of Egypt using five GCMs and a high-resolution gridded observational dataset. They reported that Linear and Variance Scaling are promising methods for bias-correcting the total rainfall, Tmax and Tmin of the historical GCMs. The purpose of the present study is to:
- Examine the spatial pattern of the Tmax and Tmin of Egypt in the reference period (1985–2005; RF), as well as under the extreme future scenario (RCP8.5).
- Evaluate and bias-correct the RegCM4 output in comparison with station observations of the RF.
- Correct the RCP8.5 future scenario at the locations where the bias-correction shows its potential skills.
2. Materials and Methods
2.1. Study Area
Egypt is located in northern Africa, between Libya and the Gaza Strip, on the Mediterranean Sea, with a 3500 km-long coastal strip overlooking the Mediterranean Sea to the north and the Red Sea to the east. The low-lying Nile Delta is the most prominent characteristic of the northern coastal zone. Egypt’s climate is characterized as semi-arid, with hot, dry summers and mild winters with minimal precipitation. The country is known for its exceptional wind regimes and locations along the Red Sea and Mediterranean shores. Egypt has a hot desert climate (Köppen climate classification BWh). Except for the northern Mediterranean coast, which receives winter rainfall, the country’s climate is generally extremely dry. In addition to the rarity of rain, Egypt experiences extreme heat during the summer months, though daytime temperatures are more moderate along the northern coast.
2.2. Experiment Design
In this study, model domain and physical configuration were customized following a study conducted in [5]. In this study, daily observed data of Tmax and Tmin (from eleven Egyptian surface weather stations (Table 1) have been used to evaluate and bias-correct the RegCM4 performance in the RF. It is worth mentioning that the selected stations were considered in the present study based on two important points: (1) data availability with high quality control and (2) ability to cover different climate zones of Egypt. The aforementioned period was divided into two time segments: the first period was 1985–1995 (considered as the evaluation period), while the second period was 1996–2005 (as the validation period). In the present work, Linear Scaling (LS; [6]) was used to bias-correct the RegCM4 output with respect to the OBS. According to [6], the corrected RegCM4 output (hereafter RCM) is calculated as:
where RCMnew is the corrected temperature, RCM is the raw output from the RegCM, OBSclim and RCMclim are the monthly climatology of the station observation and the RCM respectively, and (i) refers to the month considered in the analysis. The RegCM4 model performance (before and after using the LS method), was quantified using the mean bias (MB) as a statistical metric.

Table 1.
The Egyptian meteorological stations used in the present study to evaluate the RegCM4 performance in the reference period (RF).
2.3. Validation Data
In this study, daily observed data of the 2-m maximum and minimum air temperature (from eleven Egyptian surface weather stations have been used to evaluate and bias-correct the RegCM4 performance in the historical period (1985–2005) (see Table 1). It is worth mentioning that the selected stations were considered in the present study because of data availability and they cover different climate zones in Egypt. The aforementioned period was divided into two time segments: the first period was 1985–1995 (referred to as evaluation period), while the second period was 1996–2005 (designated as the validation period). A quality control (QC) procedure has been applied to ensure high-quality consistent records. First, the quality control procedure was used to identify possible errors (e.g., finding missing values, outliers). Second, outlier values were excluded to ensure data homogeneity. Two programs have been used to ensure that the observed data passed the QC check and to perform data analysis: (1) Statistical Packages and Software Services (SPSS), and (2) Microsoft Excel program.
3. Results
3.1. Projecting the Maximum and Minimum Air Temperatures under the RCP8.5 Scenario
Figure 1 shows the future changes of the Tmax for the time segments: 2021–2040, 2041–2061, 2061–2080, and 2081–2100 under the RCP8.5 scenario. From Figure 1, it can be noticed that Tmax exhibited a notable increase in different time segments, particularly in the far periods. For instance, the period 2041–2060 showed an increase (by 1–3 °C) over all of Egypt. On the other hand, in the time segment 2061–2080, an increase (by 3–4 °C) was noted over Western Egypt, the Red Sea, and Upper Egypt. In the period 2081–2100, Tmax exhibited the largest increase over Western Egypt, the Red Sea, and Upper Egypt (by 4–6 °C), and by 3–4 °C elsewhere. Concerning the Tmin, an increase by 1–3 °C was observed over all of Egypt in the time segments 2041–2060 and 2061–2080, while in the period 2081–2100, an increase of 3–4 °C over all of Egypt relative to the RF was seen (Figure 2).
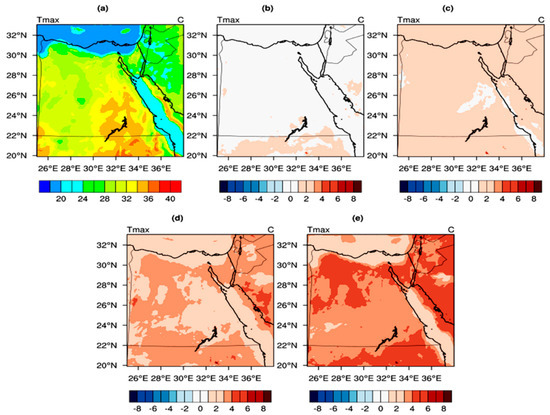
Figure 1.
Tmax for the: (a) reference period (RF) and, future periods: (b) 2021–2040, (c) 2041–2060, (d) 2061–2080, and (e) 2081–2100.
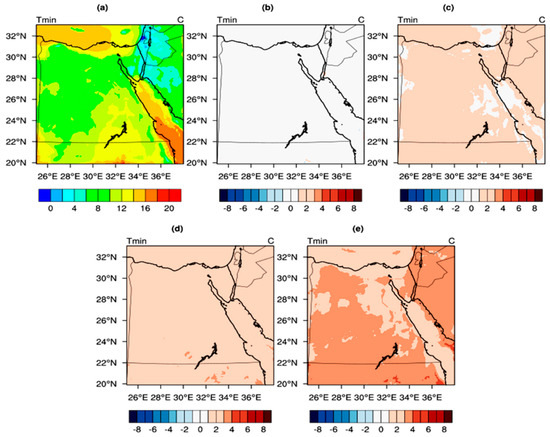
Figure 2.
Tmin for the: (a) reference period (RF) and, future periods: (b) 2021–2040, (c) 2041–2060, (d) 2061–2080, and (e) 2081–2100.
3.2. Evaluating the RegCM4 with Respect to Station Observations
For brevity in the analysis, only five stations were considered: Arish, Dabaa, Matrouh, Mansoura, and Cairo. The rest of the stations are provided in a Supplementary File (Figures S1 and S2). Figure 3 shows the monthly Tmax (in °C) time series for the RegCM4 output (before and after applying the LS) for the five stations (reported in Table 1), in comparison with the OBS. In general, it can be noted that the RegCM4 is able to reproduce the monthly variability of the Tmax with respect to the OBS. Additionally, the model bias differed with respect to the season as well as the location of interest. For instance, in the Evaluation Period (EP) the RegCM4 majorly overestimated the Tmax over Arish with a MB of 1.94 °C before applying the LS and a MB around zero after applying the LS. Furthermore, the RegCM4 was closer to the OBS when the LS was applied compared to when the LS was not used. In the Validation Period (VP), the applicability of the LS was noted as the RegCM4 remained close to the OBS. However, substantial biases were noted as the RegCM4 showed a MB of 0.48 °C before applying the LS and a MB of −1.61 °C after applying the LS.
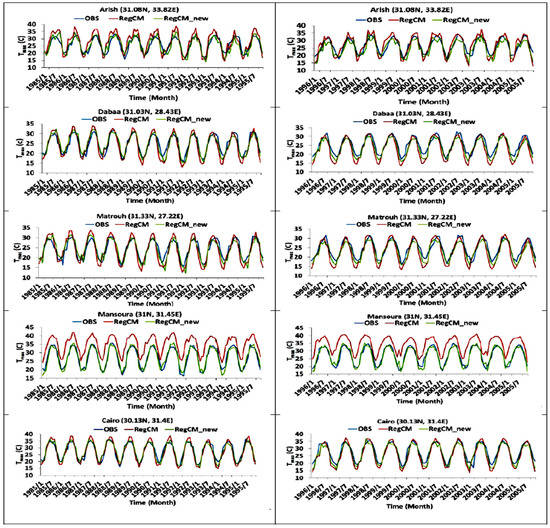
Figure 3.
The Tmax for the station observations (in blue), RegCM before applying the LS (in red) and RegCM_new after applying the LS (in green).
Over Dabaa, the RegCM4 overestimated the Tmax (in the EP) in the summer months (June–July–August) and underestimated in the winter months (December–January–February) by 0.65 °C before using the LS and around zero degrees after using the LS. In the VP, the LS majorly showed its potential skills in the winter months, while the RegCM4 remained close to the OBS in the summer months. Quantitatively, the RegCM4 possessed a MB of −2.28 °C before applying the LS and of −1.62 °C after applying the LS. Since Matrouh is geographically close to Dabaa, therefore a similar behavior was noted in the two locations for both EP and VP (before and after using the LS). For Mansoura, the situation was quite different as the RegCM4 overestimated the Tmax by 7.36 °C in the EP and by 7.08 °C in the VP with respect to the OBS. On the other hand, when the LS was applied the RegCM4 was considerably improved as the RegCM4 showed a MB around zero in the EP and of −0.28 °C in the VP. Moreover, the RegCM4 was very close to the OBS in both EP and VP when the LS was used. Before applying the LS, the RegCM4 was quite close to the OBS with a MB of −0.34 °C in the EP and −1.6 °C in the VP in Cairo. After applying the LS, the RegCM4 had a MB around zero (in the EP); while it showed a MB of −1.25 °C in the VP.
Concerning Tmin (Figure 4), the situation was quite close to the OBS because the RegCM4 underestimated the Tmin at all sites except for Mansoura station (where the RegCM4 overestimated/underestimated the Tmin depending on the season). From Figure 4, it can be observed that the RegCM4 was able to capture the monthly Tmin with respect to the OBS; however the bias varied with the site. For instance, the RegCM4 underestimated the Tmin over Arish by 6.17 °C in the EP and by −6.29 °C in the VP when the LS was not used. On the other hand when the LS was applied, the noted underestimation relatively disappeared because the MB was around zero in the EP and it was −0.11 °C in the VP. Additionally, it can be noted that the RegCM4 remained close to the OBS when the LS was used either in EP or VP. Similar to Tmax, there was a similarity in the RegCM4′s behavior between Dabaa and Matrouh (concerning the Tmin). For example, in Dabaa, the RegCM4 underestimated the Tmin by 2.7 °C (3.36°C) in the EP (VP) before using the LS. Moreover, using the LS led to a remarkable performance in the simulated Tmin because the MB was around zero (−0.57 °C) in the EP (VP). In Matrouh, before applying the LS, Tmin was underestimated by 3.02°C (3.55 °C) in the EP (VP). After using the LS, the situation became better since the MB was around zero (−0.53 °C) in the EP (VP). Unlike the Tmax, there was no considerable difference between the EP and VP either before or after applying the LS. For instance, the MB was −0.96 °C (−2.31 °C) in the EP (VP) before using the LS. After using the LS, the MB became around zero (−1.36 °C) in the EP (VP). However, both simulations (i.e., before and after applying the LS) were close to each other and they underestimated the Tmin in comparison with the OBS.
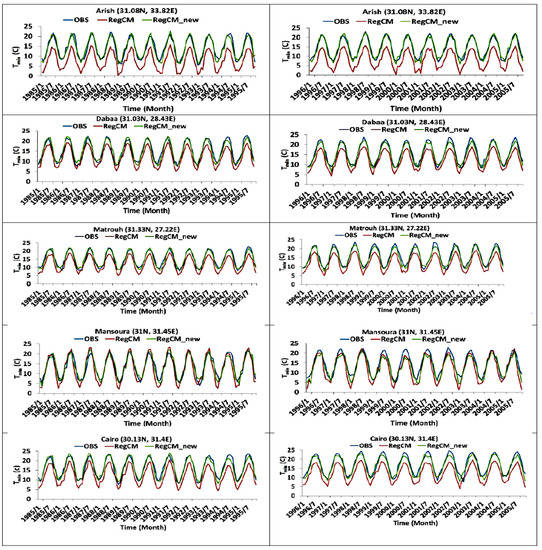
Figure 4.
The Tmin for the stationobservation (in blue), RegCM before applying the LS (in red) and RegCM_new after applying the LS (in green).
In Cairo, the RegCM4 underestimated the Tmin by 3.86 °C (4.6 °C) in the EP (VP) before using the LS. An improved performance of the LS was obviously noted since the MB was −0.017 °C (−0.8 °C) in the EP (VP). In comparison with the Tmax, both Hurgada and Sharm highly underestimated the Tmin with respect to the OBS. For instance, the RegCM4 underestimated the Tmin by 5.93 °C (7 °C) in the EP (VP) before applying the LS. Also, the LS showed its potential skills because the MB was around zero (−1.1 °C) in the EP (VP) when the LS was used. In Sharm, the situation was even more obvious than in Hurgada because the MB was −10.62 °C (−10.76 °C) in the EP (VP) when the LS was not used. After applying the LS, the RegCM4 performance was notably improved since the MB was around zero (−0.15 °C) in the EP (VP) when the LS was considered.
3.3. Correcting the Future Probability of Occurrence
Figure 5 shows the Probability of Occurrence (POO) for the stations: Arish, Matrouh, Mansoura, and Cairo in the future period of 2021–2100. These stations were selected based on the LS potential skills in improving Tmax and Tmin respectively. From Figure 5, it can be noted that POO peaked at 0.03 (for Tmax) over a range of 6–42 °C (before applying the LS) at Arish. After applying the LS, the POO did not show considerable change in its peak but the POO curve was shifted to include a range of 4–38 °C. Concerning Tmin, the POO peaked at 0.04 (before and after applying the LS). Moreover, the POO showed an obvious shift over a range from 1 to 28 °C (before using the LS) to a range of 6–30 °C (after using the LS). At Matrouh, the situation was different from the one noted at Arish. For instance, the POO showed a shift of the Tmax range from 8–38 °C to 10–40 °C. In addition, a peak shift was also noted (from 0.03 to 0.04). Regarding Tmin, there was a notable shift in the POO curve peak, but a considerable shift in the Tmin range (from 4–26 °C to 7–29 °C). The POO showed a notable shift in its peak (0.03–0.04) as well as in the range (from 2–40 °C to 8–46 °C) concerning Tmax at Mansoura. For Tmin, a small shift was noted in the POO curve (from 1–33 °C to 2–32 °C). However, an obvious change in the POO peak was observed (0.03–0.04). Finally at Cairo, there was a shift in both the Tmax range (6–46 °C to 8–44 °C) and POO curve peak (0.02–0.032). Concerning Tmin, an obvious shift was also noted in its range (1–30 °C to 5–34 °C) and POO curve peak (0.032–0.038).
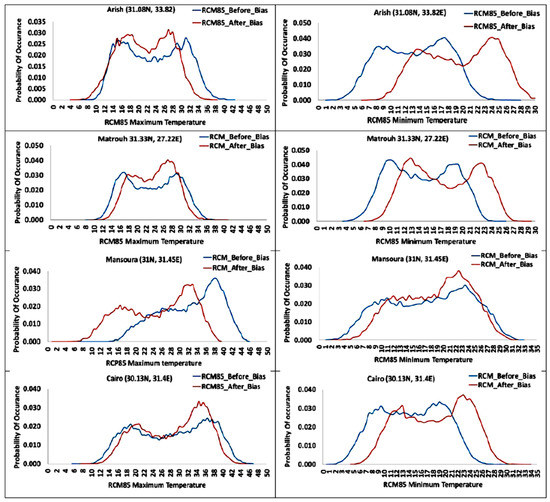
Figure 5.
The Probability of Occurrence for Tmax (left side) and Tmin (right side) before applying the LS (in blue) and after applying the LS (in red). RCM stands for the RegCM4 model output.
4. Discussion and Conclusions
Regional Climate models (RCMs) are valuable tools to examine the influence of climate change on the daily Tmax and Tmin, number of heat-waves as well as the number of hot-days under different future scenarios. Many studies have examined the effect of climate change on temperature indices in the MENA region as in [2,3]. The authors of [4] used different bias-correction techniques (e.g., LS) to correct the future projections of Tmax and Tmin and total rainfall. The bias-correction was applied to the whole region of North Egypt. However, the LS method was not used to correct the future projection at the location of the station observation.
In the present study, the RegCM4 was downscaled (by the MPI-ESM-MR) over Egypt, following [5]. The RCP8.5 was considered as the future scenario. First, the spatial pattern of the simulated Tmax and Tmin was examined over all of Egypt. Then, the future projection was corrected using the bias-correction factors between the RegCM4 (in the RF) and the OBS. The corrected future projected Tmax and Tmin were applied to the POO (as an example) to explore the potential effects of the LS. The results showed that the RegCM4 had the highest increase of the simulated Tmax and Tmin (with respect to the RF) in the far period (2081–2100) of the RCP8.5 scenario.
In the RF, the RegCM4 noted bias (either for Tmax or Tmin) can be attributed to the following reasons: (1) mismatch of the geographic features between the RegCM4 and the OBS, (2) the RegCM4 physical parameterization particularly the short/long-wave radiation, (3) using a prescribed value of ground emissivity during the RegCM4 simulations (which is supposed to vary with each season) and (4) uncertainty propagation from the lateral boundary condition as reported in [7]. As discussed in Section 3.2, the RegCM4 performance improved when the LS method was used. Such performance was confirmed with a low MB in both EP and VP. Additionally, the potential skills of the LS appeared in Tmin more than in Tmax.
In some stations; the LS could not show a notable improvement because the RegCM4 was close to the observation or it could not explicitly represent the local geographic feature of the station under study. It is important to highlight that the static data (which represent the initial condition of the RegCM4) are an important source of uncertainty. Therefore, uncertainty of the static data propagates to the RegCM4 physical parameterization and eventually the simulated Tmax and Tmin particularly over the arid-to-hyper-arid region (as in this study). Despite of the aforementioned sources of uncertainty, the RegCM4 showed an improved performance using the LS method over majority of the stations.
To ensure a robust performance among all stations, the static data need to be updated to account for the local geography features of each station. Additionally, the RegCM4 physical parameterization needs to be revised; and additional sensitivity studies need to be conducted. After that, the RegCM4 can be re-evaluated with respect to the OBS. A future study will consider using multiple GCMs (CMIP5/CMIP6; [8,9,10]) and their ensemble to further examine the impact of climate change on the simulated Tmax/Tmin. In addition, a comparison between direct downscaling (using multiple GCMs with different spatial resolutions) and one-way nesting (using one GCM) will be performed to see which approach is suitable for simulating the Tmax and Tmin of Egypt as recommended by [7]. For stations that did not show a remarkable improvement or that showed a bad performance; other bias-correction techniques (e.g., Variance Scaling and Empirical Quantile Mapping) can be considered to further evaluate the RegCM4, as reported in [4,11].
Supplementary Materials
The supplementary are available at: https://www.mdpi.com/article/10.3390/ASEC2022-13852/s1.
Author Contributions
Conceptualization, S.A.A.; methodology S.A.A.; software, S.A.A. and S.M.M.; validation, S.M.M.; formal analysis, S.A.A. and S.M.M.; investigation, S.A.A. and S.M.M.; resources, A.S.Z.; data curation, S.M.M.; writing—original draft preparation, S.A.A. and S.M.M.; writing—review and editing, S.A.A., S.M.M., A.S.Z. and M.M.A.W. All authors have read and agreed to the published version of the manuscript.
Funding
This research received no external funding.
Institutional Review Board Statement
Not applicable.
Informed Consent Statement
Not applicable.
Data Availability Statement
Not applicable.
Acknowledgments
This work was conducted as a part of the Interactive Map project of the Egyptian Meteorological Authority (EMA). The EMA is acknowledged for providing the computational power for conducting the model simulations as well as the station observations. The MPI-ESM-MR dataset was retrieved from http://www.clima-dods.ictp.it/RegCM4 (accessed on 1 March 2018).
Conflicts of Interest
The authors declare no conflict of interest.
References
- Stocker, T.F.; Qin, D.; Plattner, G.-K.; Tignor, M.; Allen, S.K.; Boschung, J.; Nauels, A.; Xia, Y.; Bex, V.; Midgley, P.M. (Eds.) IPCC 2013: Climate Change 2013: The Physical Science Basis; Contribution of Working Group I to the Fifth Assessment Report of the Intergovernmental Panel on Climate Change; Cambridge University Press: Cambridge, UK; New York, NY, USA, 2013; 1535p. [Google Scholar]
- Almazroui, M.; Saeed, F.; Saeed, S.; Nazrul Islam, M.; Ismail, M.; Klutse NA, B.; Siddiqui, M.H. Projected change in temperature and precipitation over Africa from CMIP6. Earth Syst. Environ. 2020, 4, 455–475. [Google Scholar] [CrossRef]
- Driouech, F.; ElRhaz, K.; Moufouma-Okia, W.; Arjdal, K.; Balhane, S. Assessing Future Changes of Climate Extreme Events in the CORDEX-MENA Region Using Regional Climate Model ALADIN-Climate. Earth Syst. Environ. 2020, 4, 477–492. [Google Scholar] [CrossRef]
- Nashwan, M.S.; Shahid, S.; Chung, E.S. High-Resolution Climate Projections for a Densely Populated Mediterranean Region. Sustainability 2020, 12, 3684. [Google Scholar] [CrossRef]
- Anwar, S.A.; Salah, Z.; Khald, W.; Zakey, A.S. Projecting the Potential Evapotranspiration of Egypt Using a High-Resolution Regional Climate Model (RegCM4). Environ. Sci. Proc. 2022, 19, 43. [Google Scholar] [CrossRef]
- Lafon, T.; Dadson, S.; Buys, G.; Prudhomme, C. Bias correction of daily precipitation simulated by a regional climate model: A comparison of methods. Int. J. Climatol. 2013, 33, 1367–1381. [Google Scholar] [CrossRef]
- Xu, X.; Huang, A.; Huang, Q.; Zhang, Y.; Wu, Y.; Gu, C.; Cai, S.; Zhu, X. Impacts of horizontal resolution of the lateral boundary conditions and downscaling method on the performance of RegCM4.6 in simulating the surface climate over central-eastern China. Earth Space Sci. 2022, 9, e2022EA002433. [Google Scholar] [CrossRef]
- Taylor, K.E.; Stouffer, R.J.; Meehl, G.A. An Overview of CMIP5 and the experiment design. Bull. Am. Meteor. Soc. 2012, 93, 485–498. [Google Scholar] [CrossRef]
- Li, S.; Lü, S.; Gaoa, Y.; Ao, Y. The change of climate and terrestrial carbon cycle over Tibetan Plateau in CMIP5 models. Int. J. Climatol. 2015, 35, 4359–4369. [Google Scholar] [CrossRef]
- Eyring, V.; Bony, S.; Meehl, G.A.; Senior, C.A.; Stevens, B.; Stouffer, R.J.; Taylor, K.E. Overview of the Coupled Model Intercomparison Project Phase 6 (CMIP6) experimental design and organization. Geosci. Model Dev. 2016, 9, 1937–1958. [Google Scholar] [CrossRef]
- Gado, T.A.; Mohameden, M.B.; Rashwan, I.M.H. Bias correction of regional climate model simulations for the impact assessment of the climate change in Egypt. Environ. Sci. Pollut. Res. 2021, 29, 20200. [Google Scholar] [CrossRef] [PubMed]


Disclaimer/Publisher’s Note: The statements, opinions and data contained in all publications are solely those of the individual author(s) and contributor(s) and not of MDPI and/or the editor(s). MDPI and/or the editor(s) disclaim responsibility for any injury to people or property resulting from any ideas, methods, instructions or products referred to in the content. |
© 2022 by the authors. Licensee MDPI, Basel, Switzerland. This article is an open access article distributed under the terms and conditions of the Creative Commons Attribution (CC BY) license (https://creativecommons.org/licenses/by/4.0/).