
Evaluation of the Noise Benefits from Performing CDO in TMA Using OpenSky Data †

Abstract
:1. Introduction
2. Airports
3. Datasets
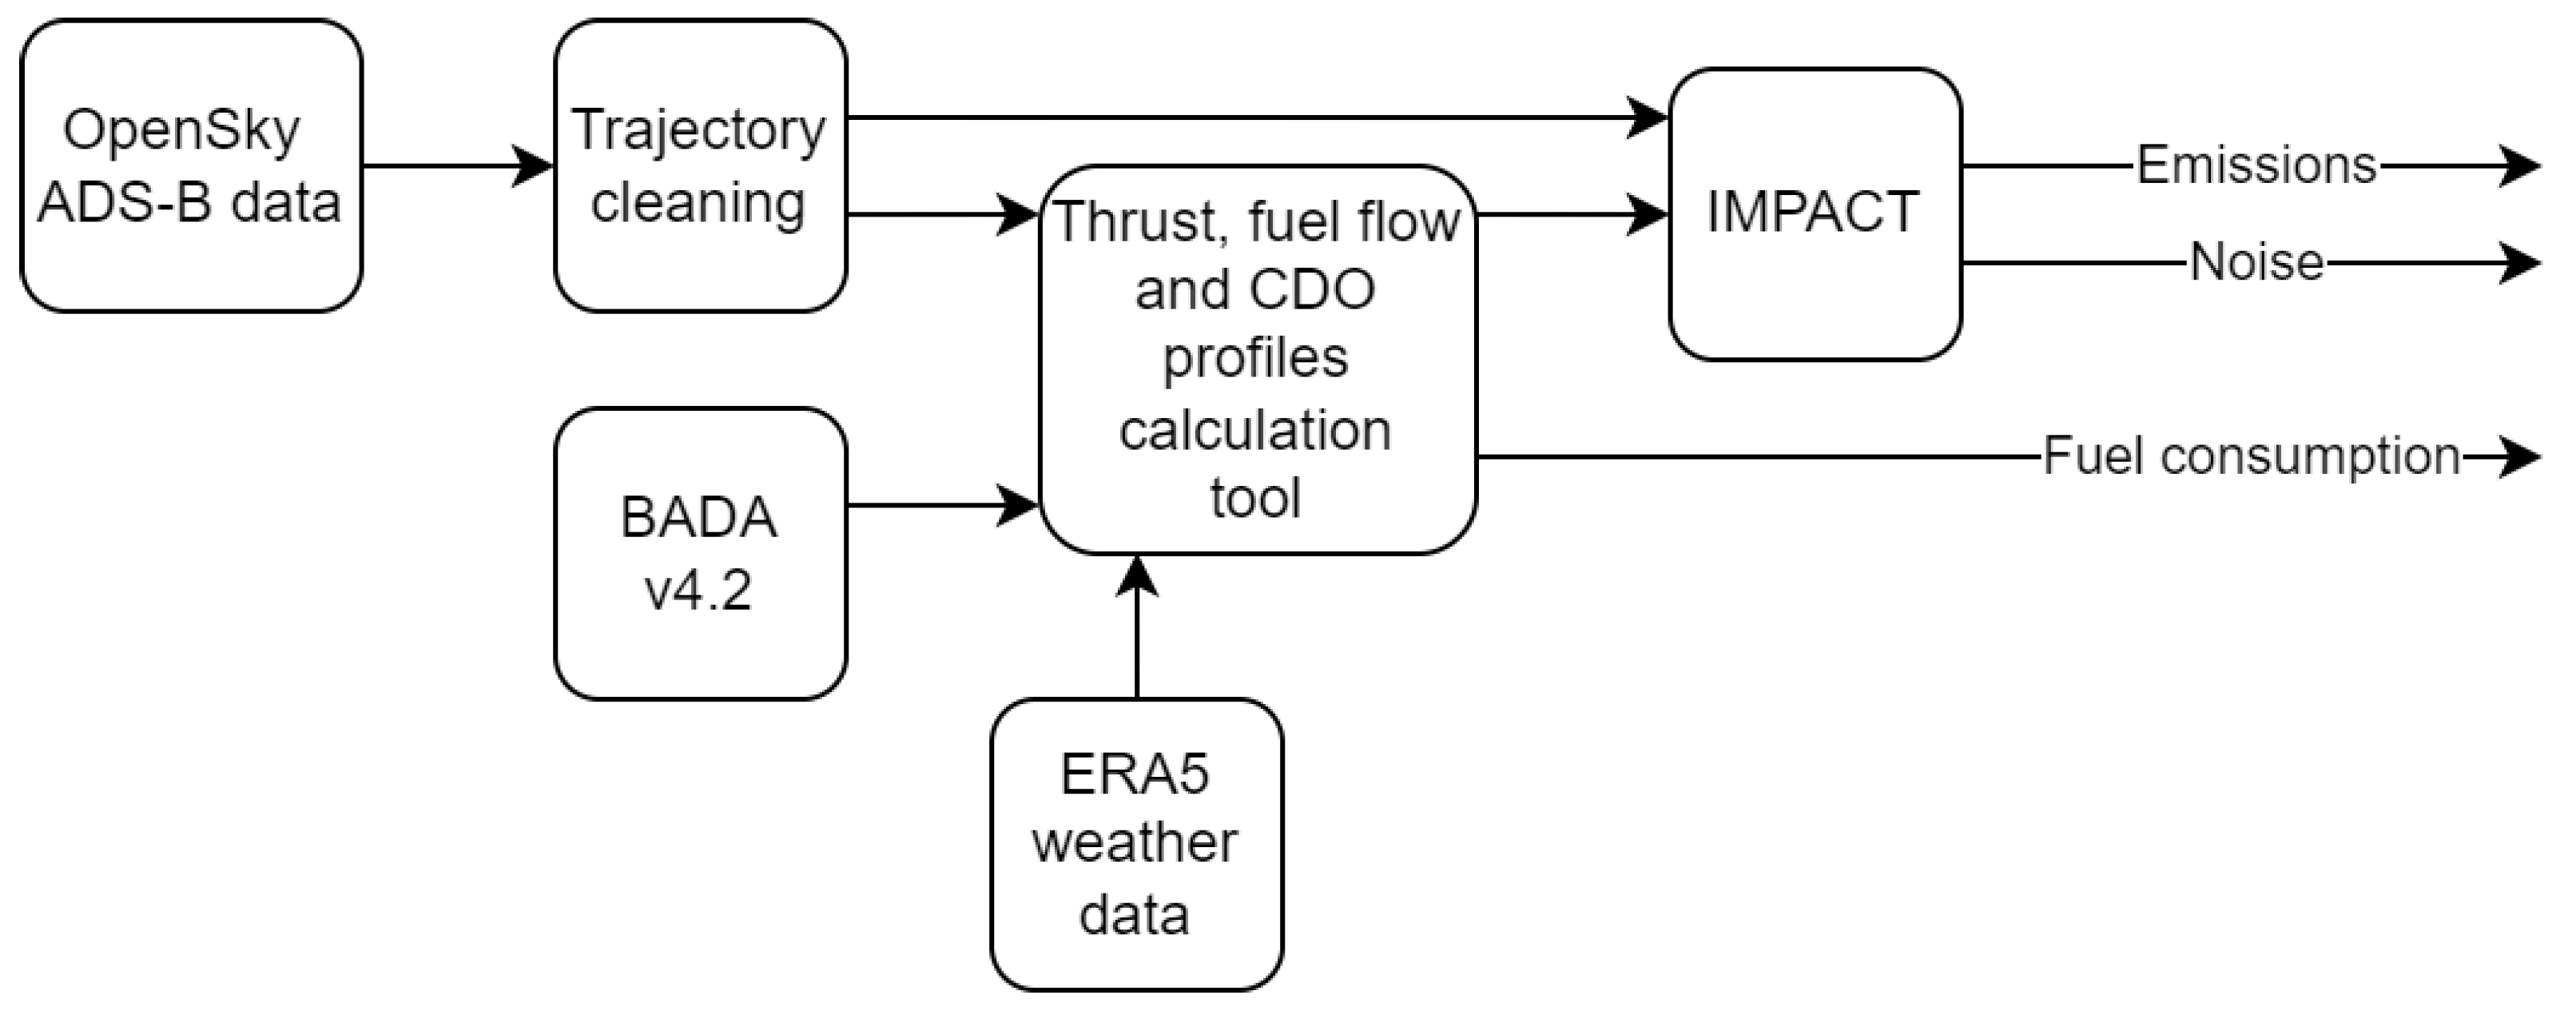
4. Methodology
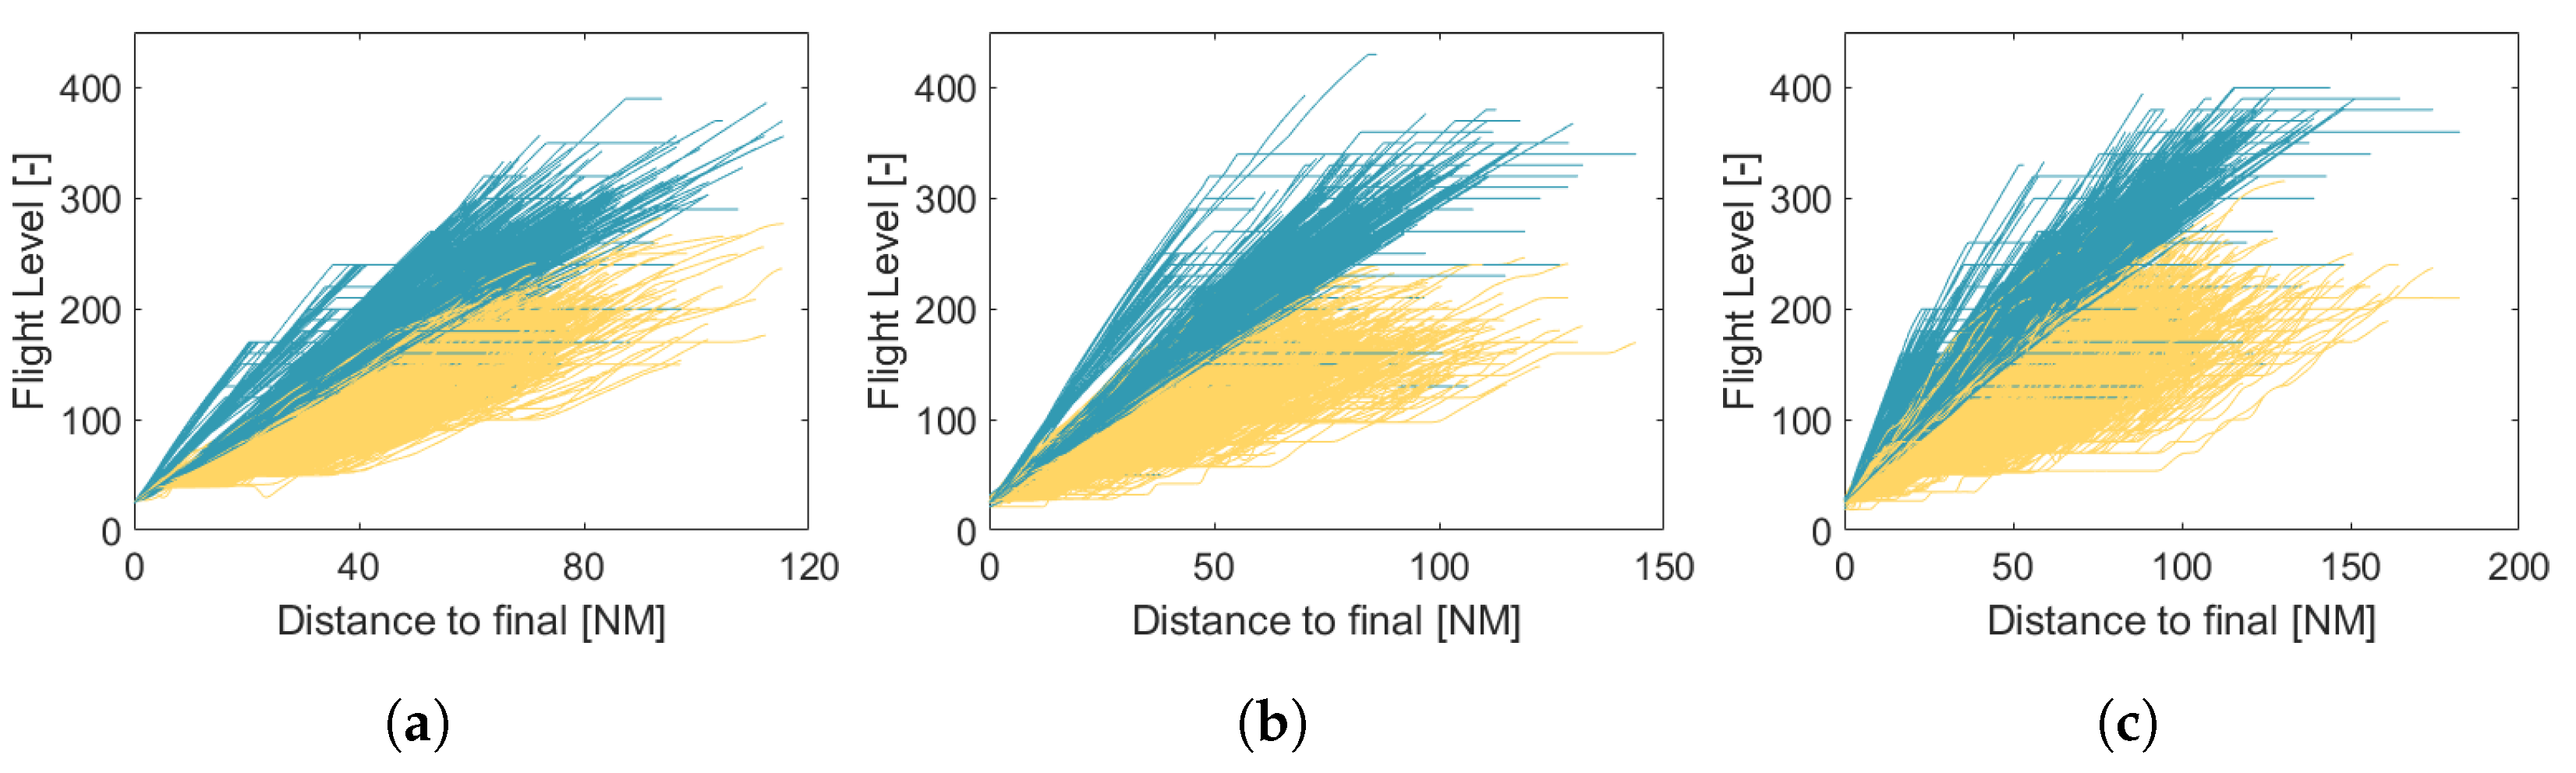
4.1. CDO Profile Generation
4.2. Emissions
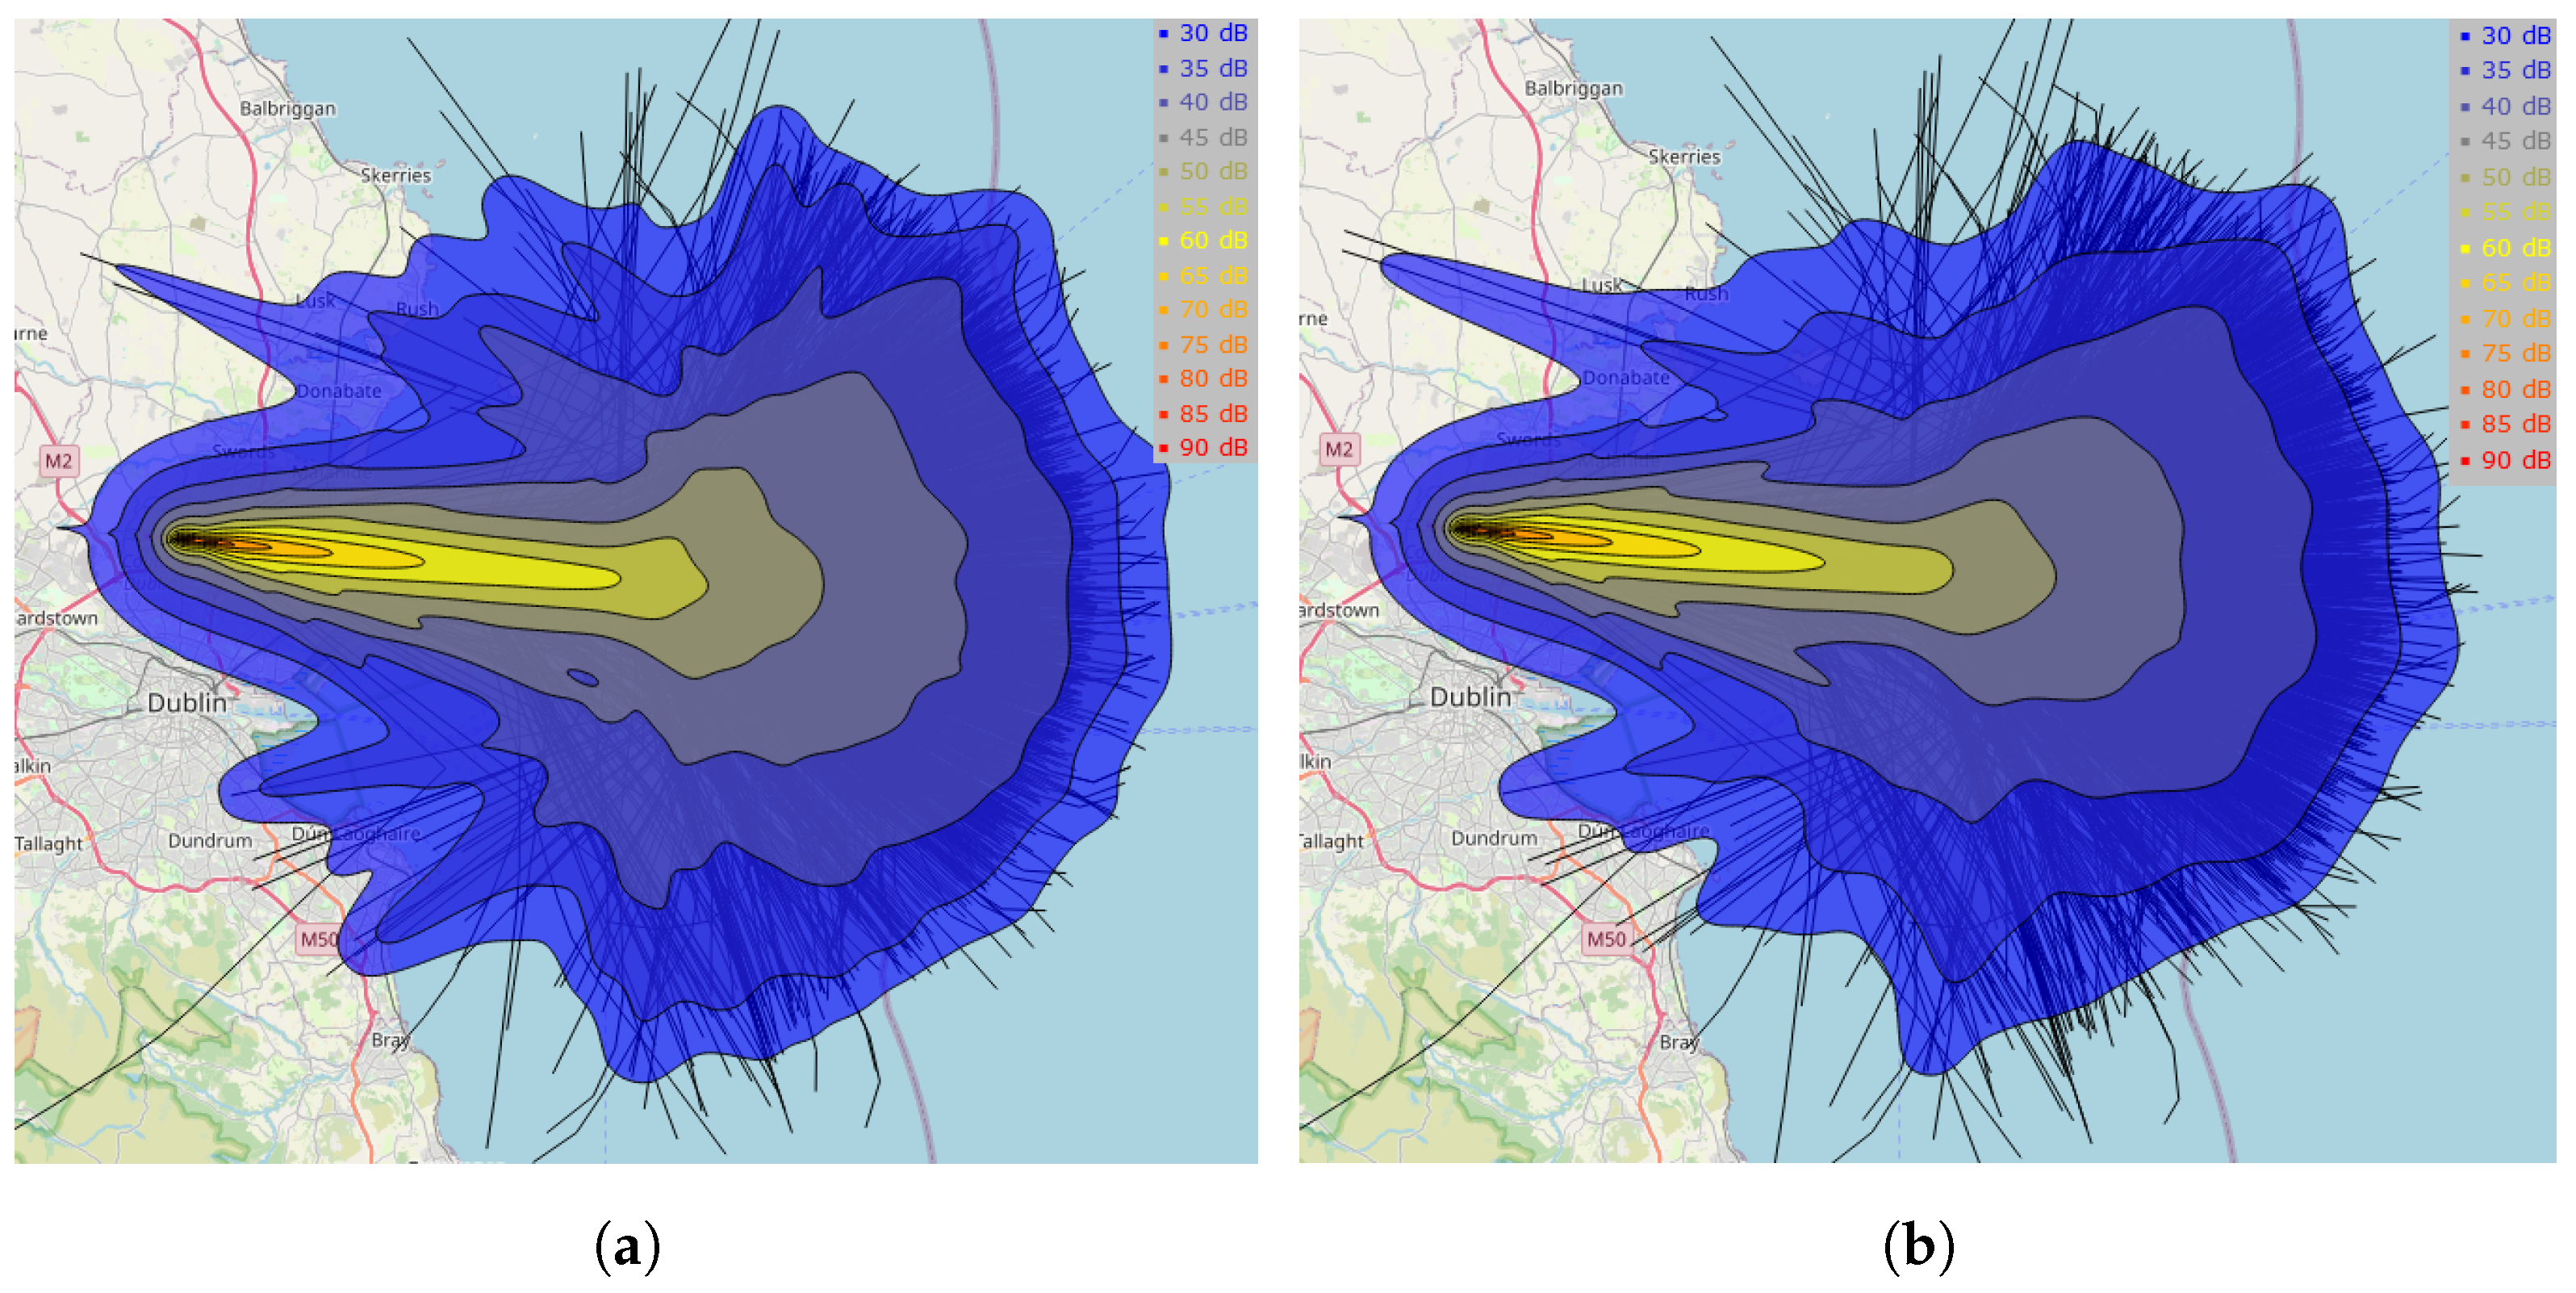
4.3. Noise
4.4. Fuel Consumption
5. Results
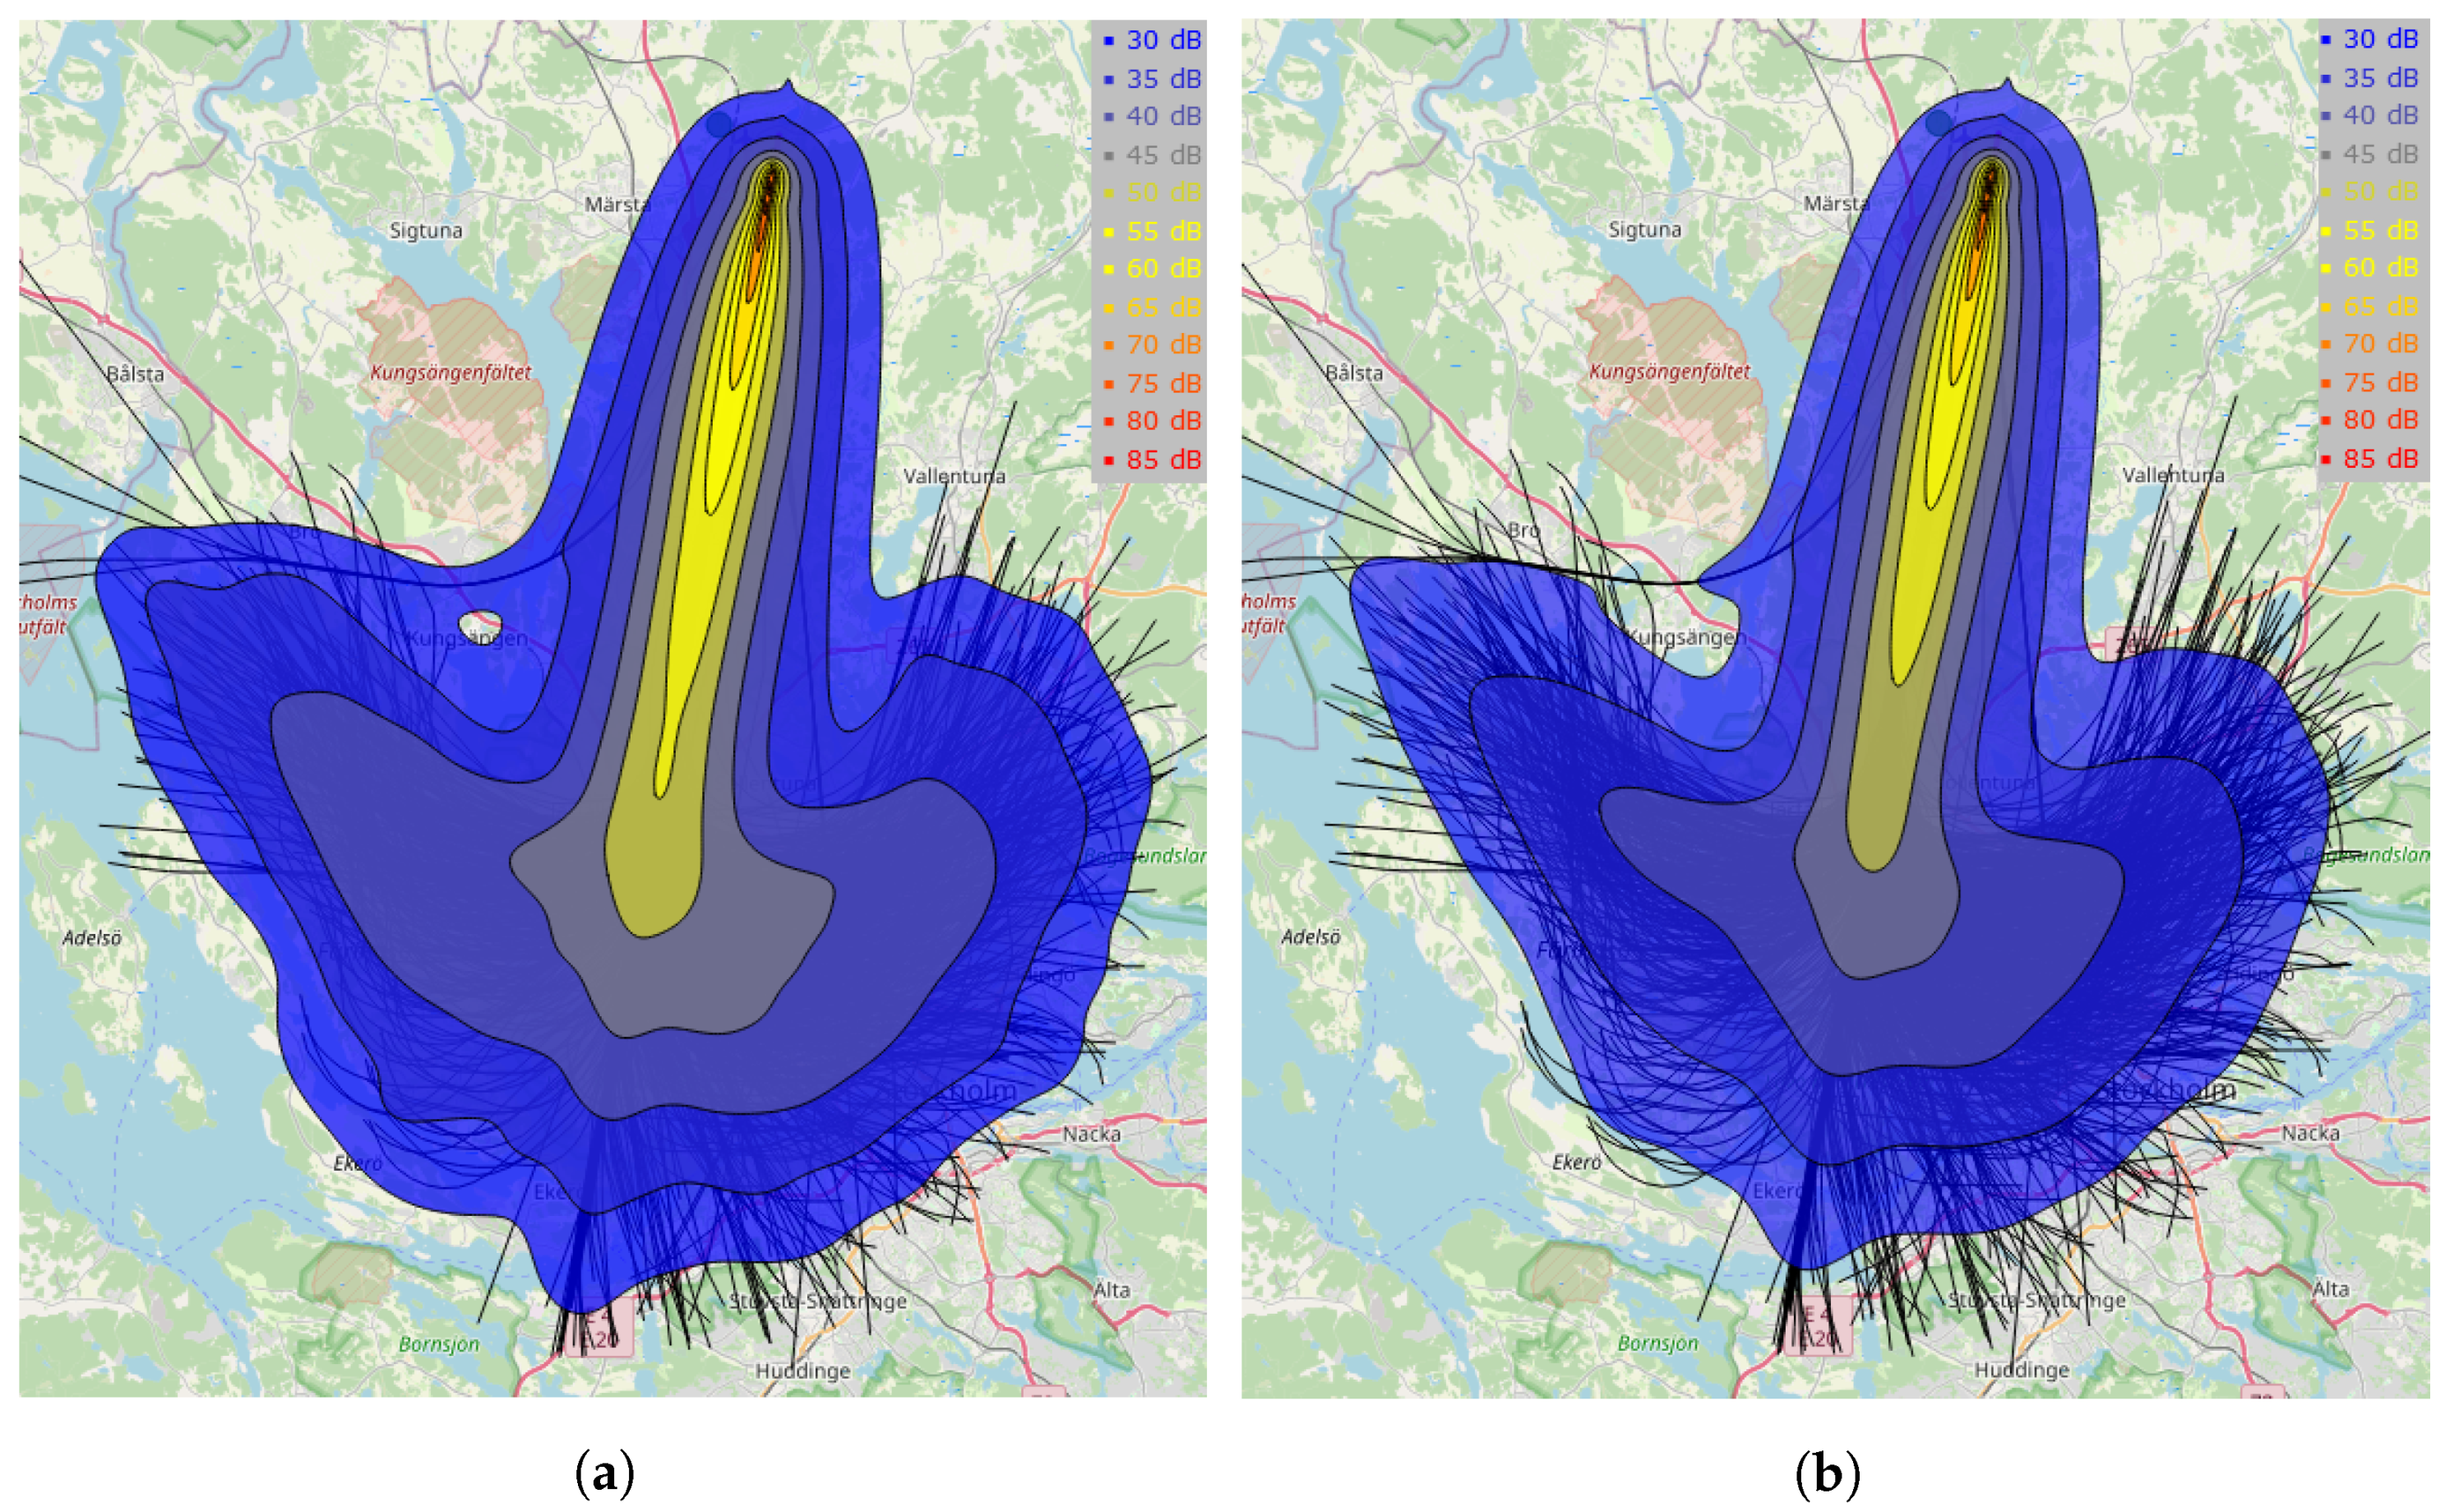
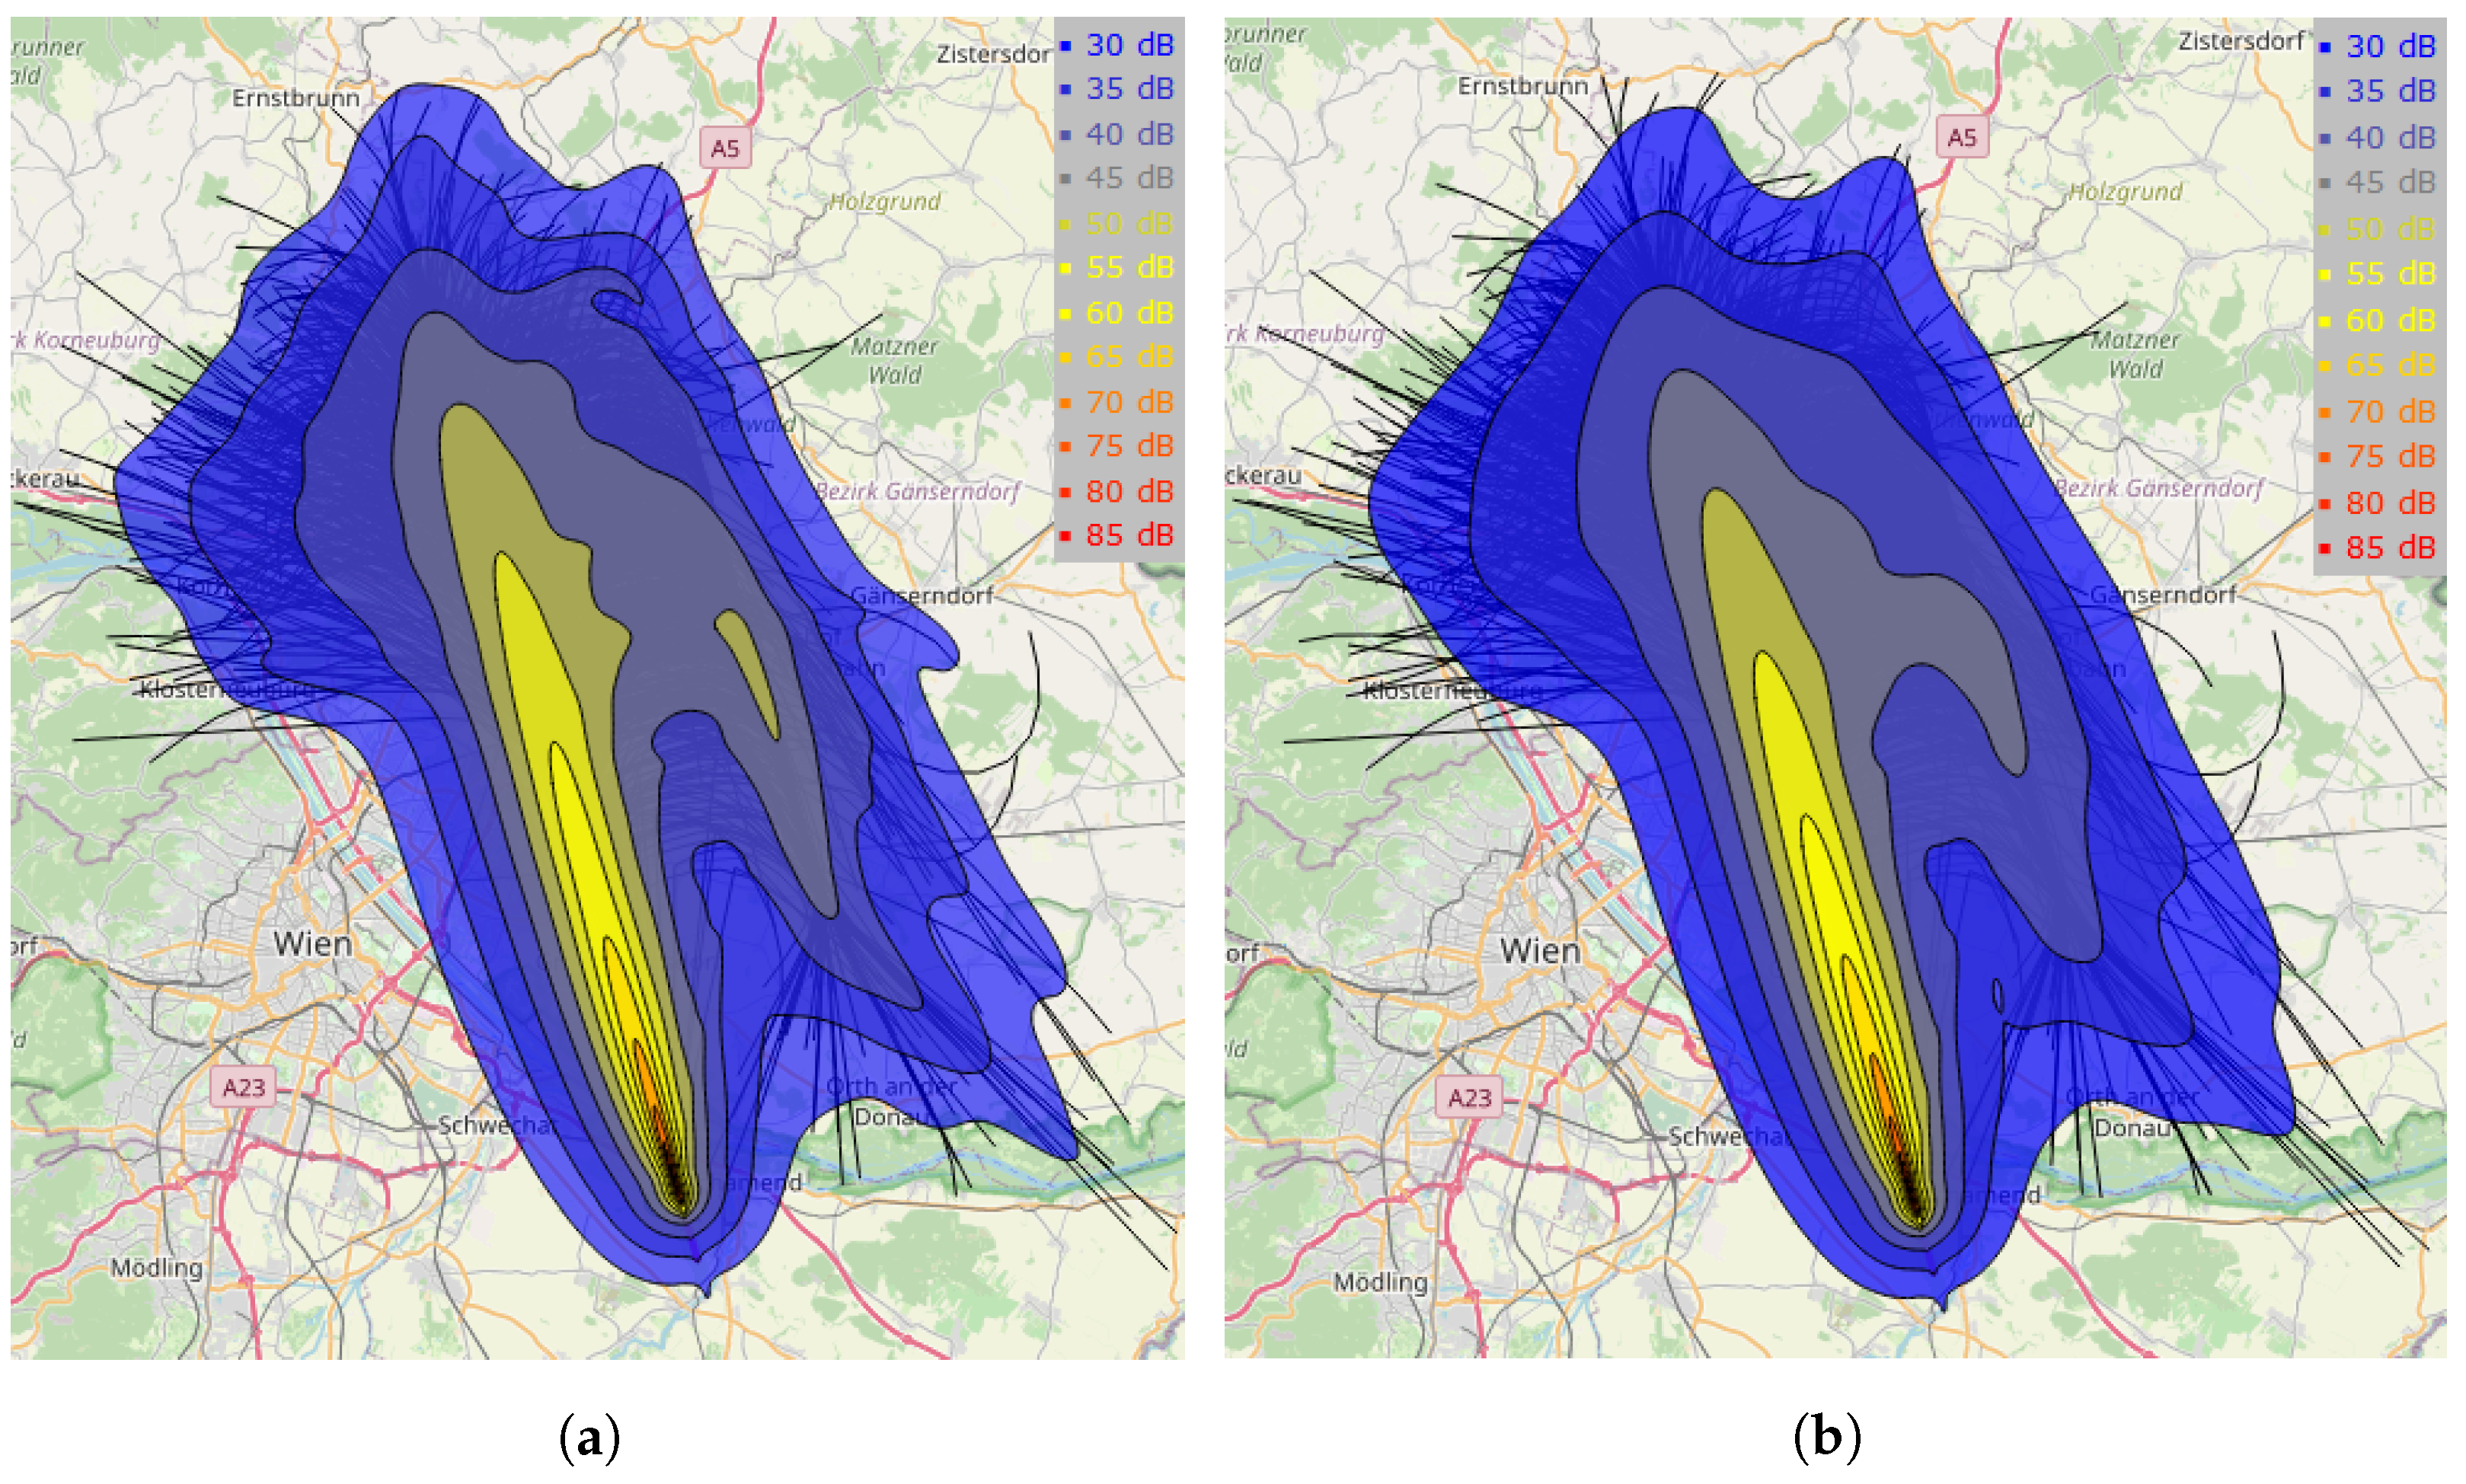
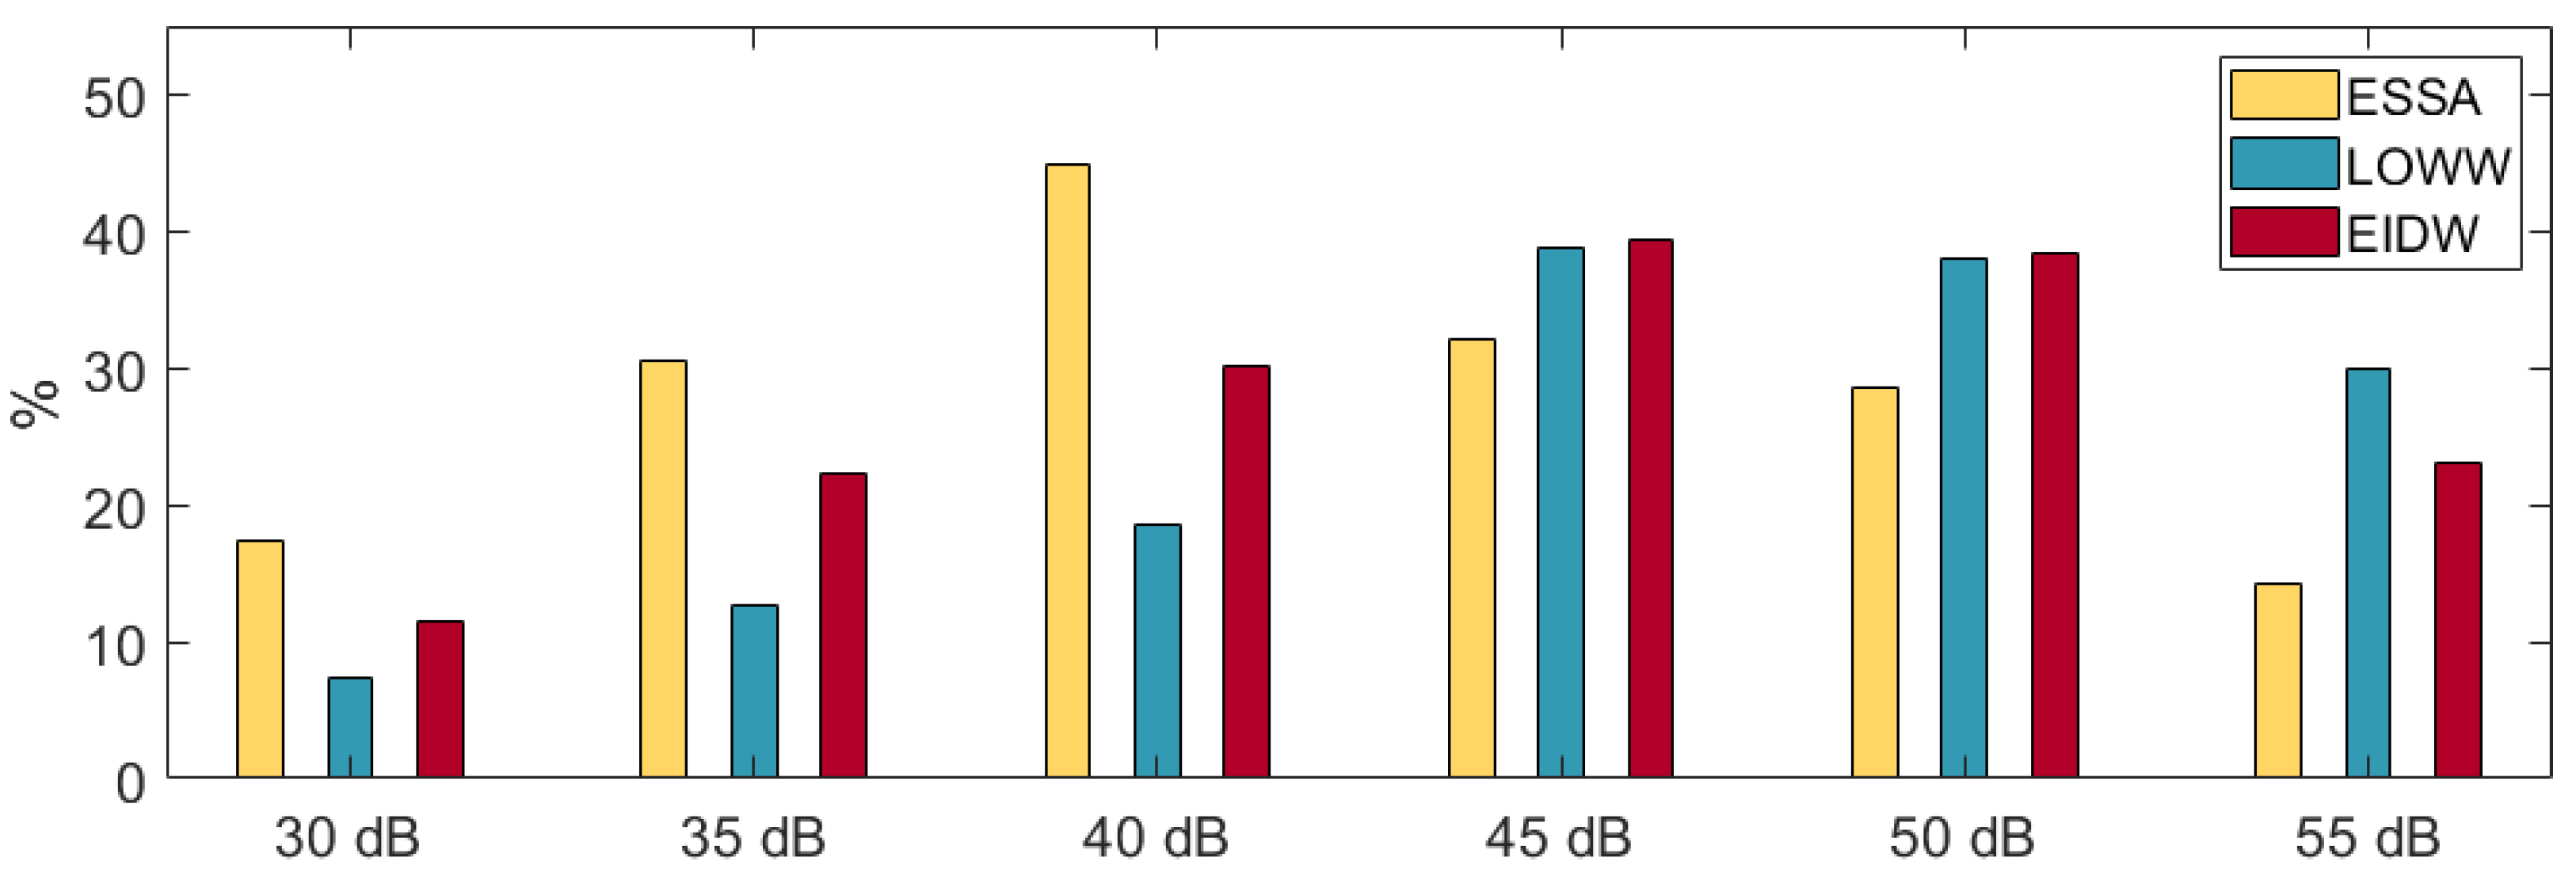
5.1. Noise
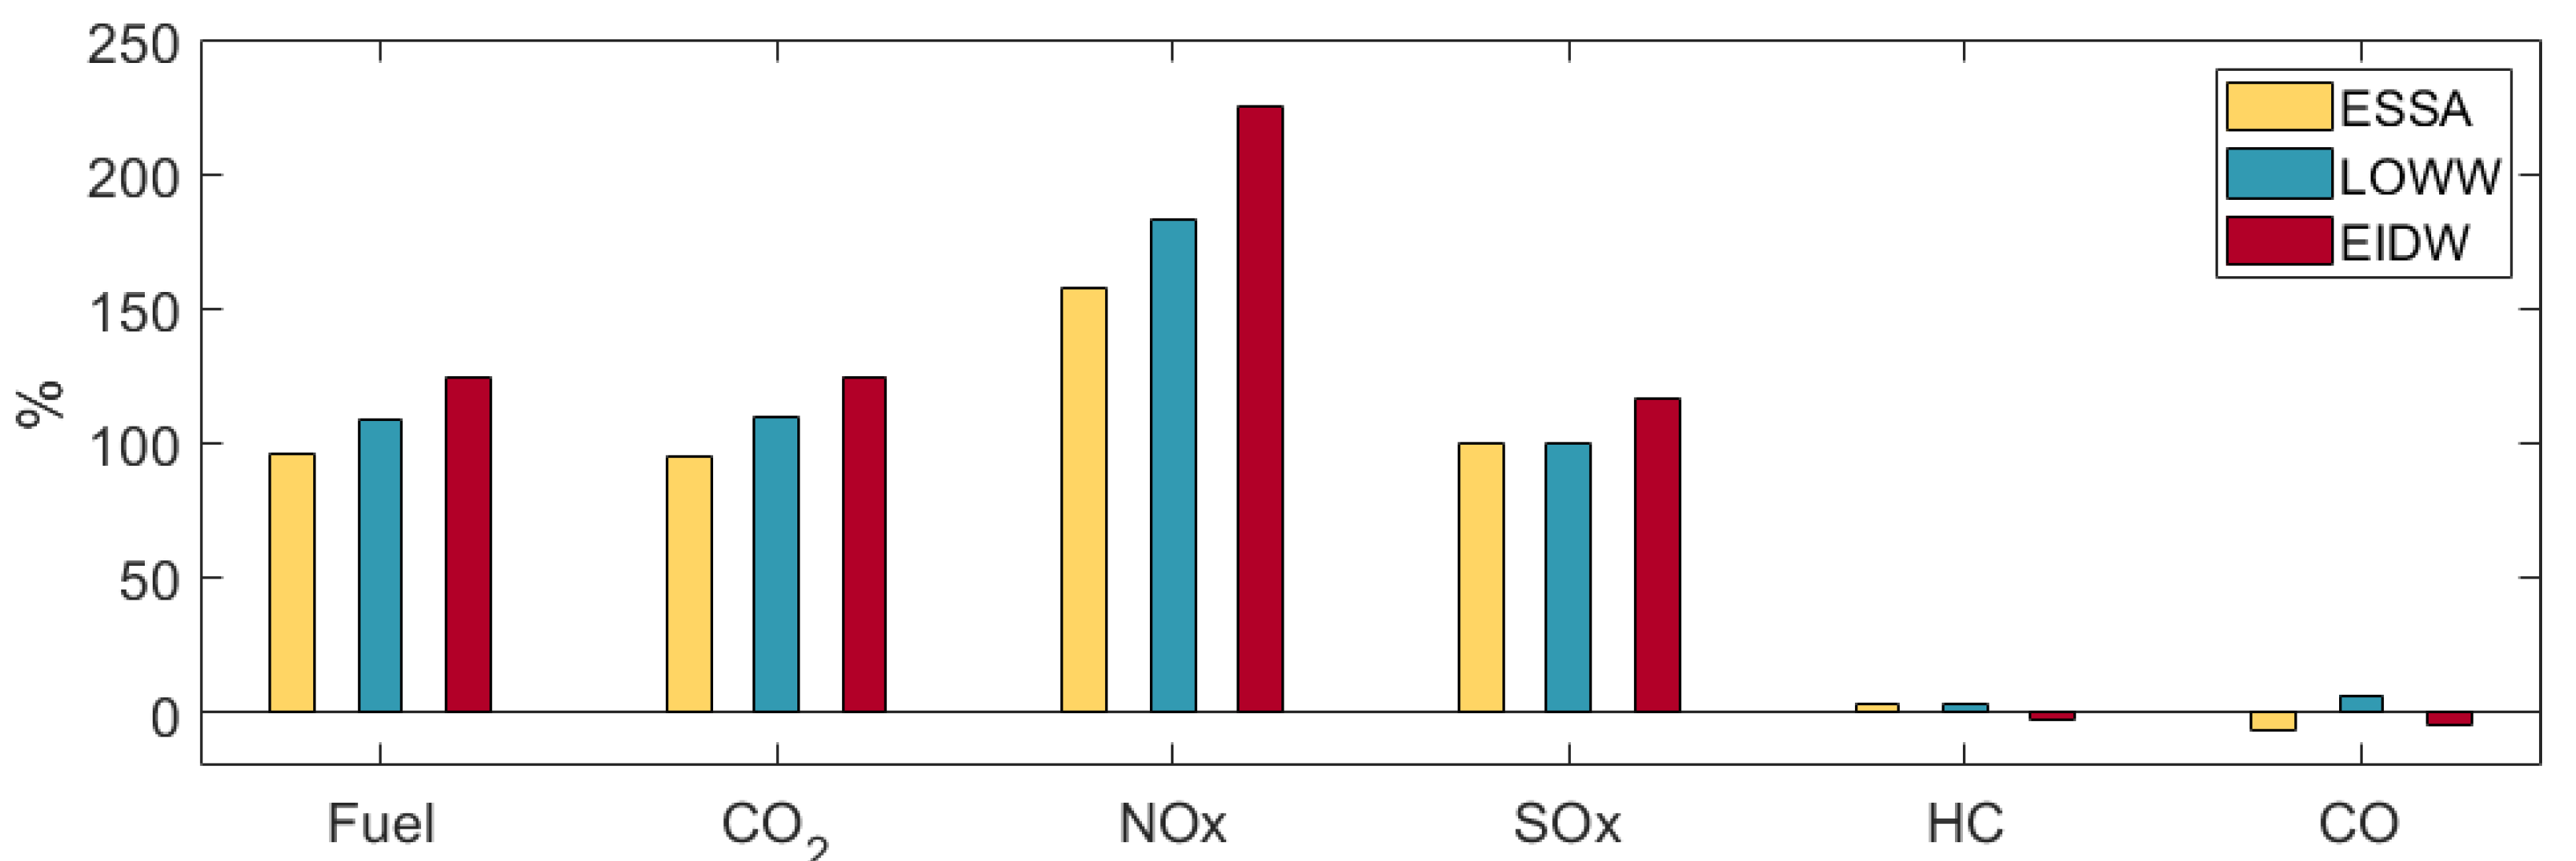
5.2. Fuel and Emissions
6. Conclusions
Author Contributions
Funding
Institutional Review Board Statement
Informed Consent Statement
Data Availability Statement
Conflicts of Interest
References
- EASA. Available online: https://www.easa.europa.eu/eco/eaer/topics/adapting-changing-climate/noise (accessed on 31 October 2022).
- European Commission Eurobarometer Survey on Climate Change. Available online: https://climate.ec.europa.eu/citizens/citizen-support-climate-action_en#ref-2021-survey (accessed on 31 October 2022).
- WHO. Environmental Noise Guidelines for the European Region; WHO: Geneva, Switzerland, 2018. [Google Scholar]
- Sun, J.; Basora, L.; Olive, X.; Strohmeier, M.; Schäfer, M.; Martinovic, I.; Lenders, V. OpenSky Report 2022: Evaluating Aviation Emissions Using Crowdsourced Open Flight Data. In Proceedings of the DASC, Delft, Netherlands, 10–11 November 2022. [Google Scholar]
- Ganic, E.; Oosten, N.; Meliveo, L.; Jeram, S.; Louf, T.; Ramasco, J. Dynamic noise maps for Ljubljana airport. In Proceedings of the SIDs, Virtual Conference, 7–10 December 2020. [Google Scholar]
- Hardell, H.; Lemetti, A.; Polishchuk, T.; Smetanová, L. Evaluation of the Sequencing and Merging Procedures at Three European Airports Using Opensky Data. Eng. Proc. 2022, 13, 13. [Google Scholar]
- Hardell, H.; Lemetti, A.; Polishchuk, T.; Smetanova, L.; Zeghal, K. Towards a Comprehensive Characterization of the Arrival Operations in the Terminal Area. In Proceedings of the SIDs, Virtual Conference, 7–9 December 2021. [Google Scholar]
- EUROCONTROL. Point Merge Implementation: A Quick Guide; EUROCONTROL Innovation Hub: Brétigny, France, 2020. [Google Scholar]
- Swedish AIP. Available online: https://aro.lfv.se/Editorial/View/IAIP?folderId=79 (accessed on 31 October 2022).
- Austrian AIP. Available online: https://eaip.austrocontrol.at (accessed on 31 October 2022).
- Irish AIP. Available online: http://iaip.iaa.ie/iaip/aip_directory.htm (accessed on 31 October 2022).
- Opensky Network. Available online: https://opensky-network.org/ (accessed on 11 February 2022).
- EUROCONTROL. User Manual for the Base of Aricraft Data (BADA) Family 4; EUROCONTROL Innovation Hub: Brétigny, France, 2014. [Google Scholar]
- Copernicus Climate Change Service (C3S) Data Store, European Centre for Medium-Range Weather Forecasts (ECMWF). Available online: https://cds.climate.copernicus.eu (accessed on 11 February 2022).
- EUROCONTROL. IMPACT. Available online: https://www.eurocontrol.int/platform/integrated-aircraft-noise-and-emissions-modelling-platform (accessed on 31 October 2022).
- ECAC.CEAC Doc 29, 4th ed.; Volume 2: Technical Guide; European Civil Aviation Conference: Neuilly-sur-Seine, France, 2016.
- Hardell, H.; Polishchuk, T.; Smetanova. Automatic Traffic Scheduling in TMA with Point Merge to Enable Greener Descents. In Proceedings of the ICRAT, Tampa, FL, USA, 19–23 June 2022. [Google Scholar]
- NASA. Aircraft Particle Emissions eXperiment (APEX), NASA/TM—2006-214382; NASA Ames Research, NTRS: Mountain View, CA, USA, 2006. [Google Scholar]
- Sáez, R.; Polishchuk, T.; Schmidt, C.; Hardell, H.; Smetanová, L.; Polishchuk, V.; Prats, X. Automated Sequencing and Merging with Dynamic Aircraft Arrival Routes and Speed Management for Continuous Descent Operations. Transp. Res. Part C Emerg. Technol. 2021, 132, 103402. [Google Scholar] [CrossRef]


| Time | Penalty | ESSA | LOWW | EIDW | |
|---|---|---|---|---|---|
| Day | 07:00–19:00 | 0 dB | 71.3% | 74.1% | 88.6% |
| Evening | 19:00–23:00 | 5 dB | 24.8% | 23.8% | 5.6% |
| Night | 23:00–07:00 | 10 dB | 3.9% | 2.1% | 5.8% |
| ESSA Actual | ESSA CDO | LOWW Actual | LOWW CDO | EIDW Actual | EIDW CDO | |
|---|---|---|---|---|---|---|
| 30 dB | 1010 | 860 | 1090 | 1015 | 1660 | 1490 |
| 35 dB | 705 | 540 | 800 | 710 | 1235 | 1010 |
| 40 dB | 420 | 290 | 545 | 460 | 800 | 615 |
| 45 dB | 185 | 140 | 326 | 235 | 425 | 305 |
| 50 dB | 90 | 70 | 145 | 105 | 180 | 130 |
| 55 dB | 40 | 35 | 65 | 50 | 80 | 65 |
| ESSA Actual | ESSA CDO | LOWW Actual | LOWW CDO | EIDW Actual | EIDW CDO | |
|---|---|---|---|---|---|---|
| Fuel | 214 | 109 | 240 | 115 | 309 | 138 |
| CO | 675 | 346 | 760 | 363 | 977 | 435 |
| NOx | 1.26 | 0.49 | 1.50 | 0.53 | 2.08 | 0.64 |
| SOx | 0.18 | 0.09 | 0.20 | 0.10 | 0.26 | 0.12 |
| HC | 0.34 | 0.33 | 0.33 | 0.32 | 0.39 | 0.40 |
| CO | 6.73 | 7.25 | 4.01 | 3.77 | 7.74 | 8.17 |
Disclaimer/Publisher’s Note: The statements, opinions and data contained in all publications are solely those of the individual author(s) and contributor(s) and not of MDPI and/or the editor(s). MDPI and/or the editor(s) disclaim responsibility for any injury to people or property resulting from any ideas, methods, instructions or products referred to in the content. |
© 2022 by the authors. Licensee MDPI, Basel, Switzerland. This article is an open access article distributed under the terms and conditions of the Creative Commons Attribution (CC BY) license (https://creativecommons.org/licenses/by/4.0/).
Share and Cite
Hardell, H.; Polishchuk, T. Evaluation of the Noise Benefits from Performing CDO in TMA Using OpenSky Data. Eng. Proc. 2022, 28, 15. https://doi.org/10.3390/engproc2022028015
Hardell H, Polishchuk T. Evaluation of the Noise Benefits from Performing CDO in TMA Using OpenSky Data. Engineering Proceedings. 2022; 28(1):15. https://doi.org/10.3390/engproc2022028015
Chicago/Turabian StyleHardell, Henrik, and Tatiana Polishchuk. 2022. "Evaluation of the Noise Benefits from Performing CDO in TMA Using OpenSky Data" Engineering Proceedings 28, no. 1: 15. https://doi.org/10.3390/engproc2022028015
APA StyleHardell, H., & Polishchuk, T. (2022). Evaluation of the Noise Benefits from Performing CDO in TMA Using OpenSky Data. Engineering Proceedings, 28(1), 15. https://doi.org/10.3390/engproc2022028015