Proceeding Paper

Terminal Manoeuvre Area Effects on Aircraft Engine Dust Ingestion †

Department of Mechanical, Aerospace and Civil Engineering, The University of Manchester, Manchester M13 9PL, UK
*
Author to whom correspondence should be addressed.
Presented at the 10th OpenSky Symposium, Delft, The Netherlands, 10–11 November 2022.
Eng. Proc. 2022, 28(1), 11; https://doi.org/10.3390/engproc2022028011
Published: 20 December 2022
(This article belongs to the Proceedings of The 10th OpenSky Symposium)

Abstract

:
Aircraft manufacturers and airlines invest large amounts of money into making air travel more sustainable to reduce the effects of global warming. Extending the in-service life of aeroengines through route optimisation is one method to contribute to the sustainability of aviation. Atmospheric dust ingestion leads to premature failure of engine components, increased fuel burn due to loss of efficiency, and shortened maintenance intervals. A methodology that takes a fleet-based approach to quantify the dust exposure experienced by aircraft, primarily operated within the Persian Gulf, has been developed to investigate opportunities for mitigating engine damage by atmospheric dust. The variations in dust loading experienced by a Middle Eastern Low-Cost Carrier’s (LCC) fleet were analysed by combining the Copernicus Atmospheric Monitoring Services (CAMS) dust reanalysis dataset with the OpenSky Network’s open-source trajectory data pool. It is found that runway orientation and patterns of traffic arrival have a direct bearing on the amount of dust encountered by aircraft engines.

1. Introduction

Over the past 30 years, there has been a significant increase in the number of aircraft and airlines operating in dusty regions, most prominently within the Persian Gulf. This has in part been driven by the growth of Gulf states low-cost carriers (LCC), who have rapidly expanded their fleets over the last ten years. The operating bases for these airlines are designated as ‘non-benign’ due to the large amount of atmospheric dust that exists within the atmosphere that surrounds these airports [1]. Therefore, for aircraft that are operating within the region, it is likely that within a year-long period, many aircraft will ingest large quantities of ambient dust and encounter several dust storms. This exposure creates a maintenance burden for both operators and engine Original Equipment Manufacturers (OEMs), who are required to conduct compressor washes, and component repairs and overhauls, at an increased frequency due to the effects of fouling, erosion, deposition, and physico-chemical attack by in situ formed mineral glass deposits.
A dust storm is defined as an event where visibility is reduced to 1 km or less as a result of blowing dust [2]. This is of key importance for defining a dust day. A ‘dust day’ is an event in which either one or both of these conditions are satisfied:
  • Dust or Sand storm is observed at least once in the 24-h period.
  • 25% of the daily observations of visibility indicate suspended dust.
Since the turn of the 21st century, there has been a general increase in the number of dust days occurring within the Persian Gulf within a single year [3]. This is likely a result of human activity, through drivers such as vegetation loss and global warming. This increase in frequency will continue to increase interactions between atmospheric dust and the aeroengines of aircraft operating within the region. Particle separators and other physical barriers to dust ingestion are not an option for large turbofan engines due to the huge drag and pressure loss penalty, which leads OEMs toward other mitigation strategies such as environmental barrier coatings to ameliorate the rate of chemical attack by mineral dusts. Optimisation of these solutions requires a thorough understanding of the composition and concentration of the dust entering the engine.
The use of weather reanalysis models for dust ingestion into aeroengines has been studied in previous works [1], in which the authors simulated generic flight profiles on a great-circle and passed the aircraft position through a modelled atmospheric dust concentration field. However, this approach is unable to capture the nuances of realistic operational constraints that may present opportunities for new dust-induced engine degradation mitigation strategies. The aim of the current work is to exploit the OpenSky database to capture the variability of dust exposure levels due to movement type (departure or arrival), runway orientation (north-west or south-east), and altitude profile (climb versus approach and hold). We analyse the entire fleet of a low-cost carrier (LCC) based at Dubai International Airport (ICAO: OMDB, IATA: DXB) in the month of March 2019, with a fleet comprised of Boeing 737-800 (NG) and 737 Max 8 aircraft. March is selected as it is known to be a month of high dust storm activity and has been studied in our previous work, albeit in 2017 and 2018.

2. Materials and Methods

The prediction of dust mass ingested into an aeroengine is dependent upon two key contributing factors: (1) trajectory data and (2) weather reanalysis models. An overview of the process is provided in Figure 1.
The Aircraft Specific and Fleet data have been obtained from FlightRadar24 (https://www.flightradar24.com/), (accessed on 27 July 2022) data sources. We obtained the Aircraft Registrations and Hexcodes, which allowed us to identify the aircraft of interest within the study. A flight list was generated for the 61 aircraft within the LCC’s fleet which contained: callsign, departure and arrival airports. In many cases, the departure/arrival airports were blank fields. Departure and arrival airport were identified by analysing the beginning and end lat-lon coordinates for each trajectory, and cross referencing with an airport database. An airport was assigned if the initial/final data points lay within a 10 nm radius of a given airport. This was further restricted by ensuring that the final deviation in aircraft altitude was not greater than 2000 feet between a known airport elevation and the aircraft’s initial/final data point. For each flight within the flight list, we then make a retrieval request to the open-sky impala shell [4] to obtain the ADS-B trajectory data. After retrieval, the data is passed through multiple filtering techniques to remove the spurious data points. A flight is deemed valid for analysis if at least one phase of the flight has a data fraction of 90%, the anomalous data points have been removed and a known departure/arrival airport has been assigned. For each flight, we then pass the trajectory data through the CAMS reanalysis model to assign the dust mass ingested for each time point. We repeat this process for each identified flight to allow for analysis on a case-by-case basis or at a holistic fleet-based level.

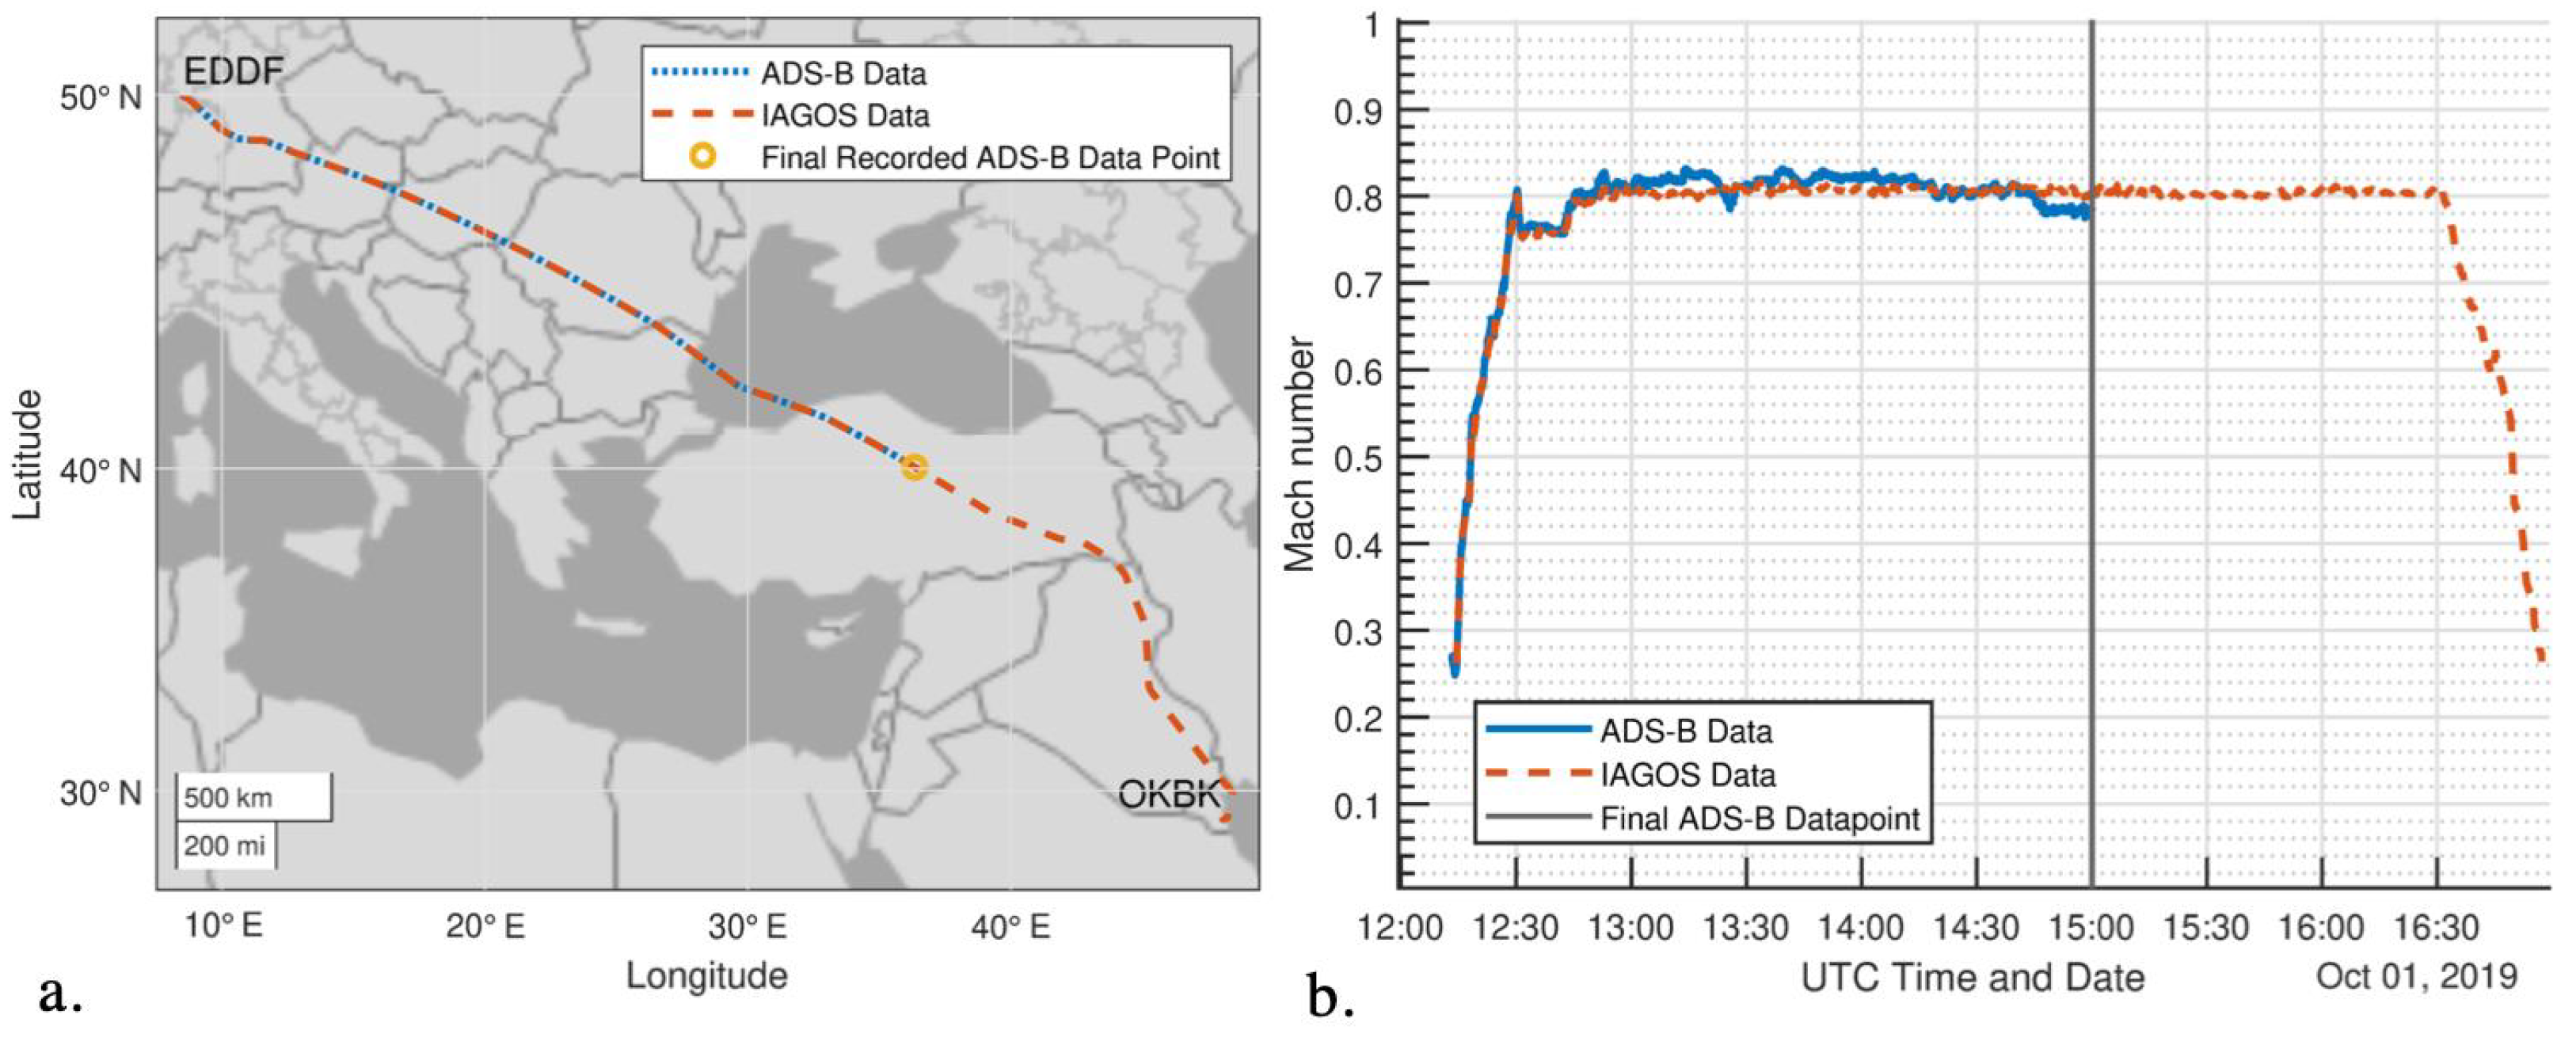
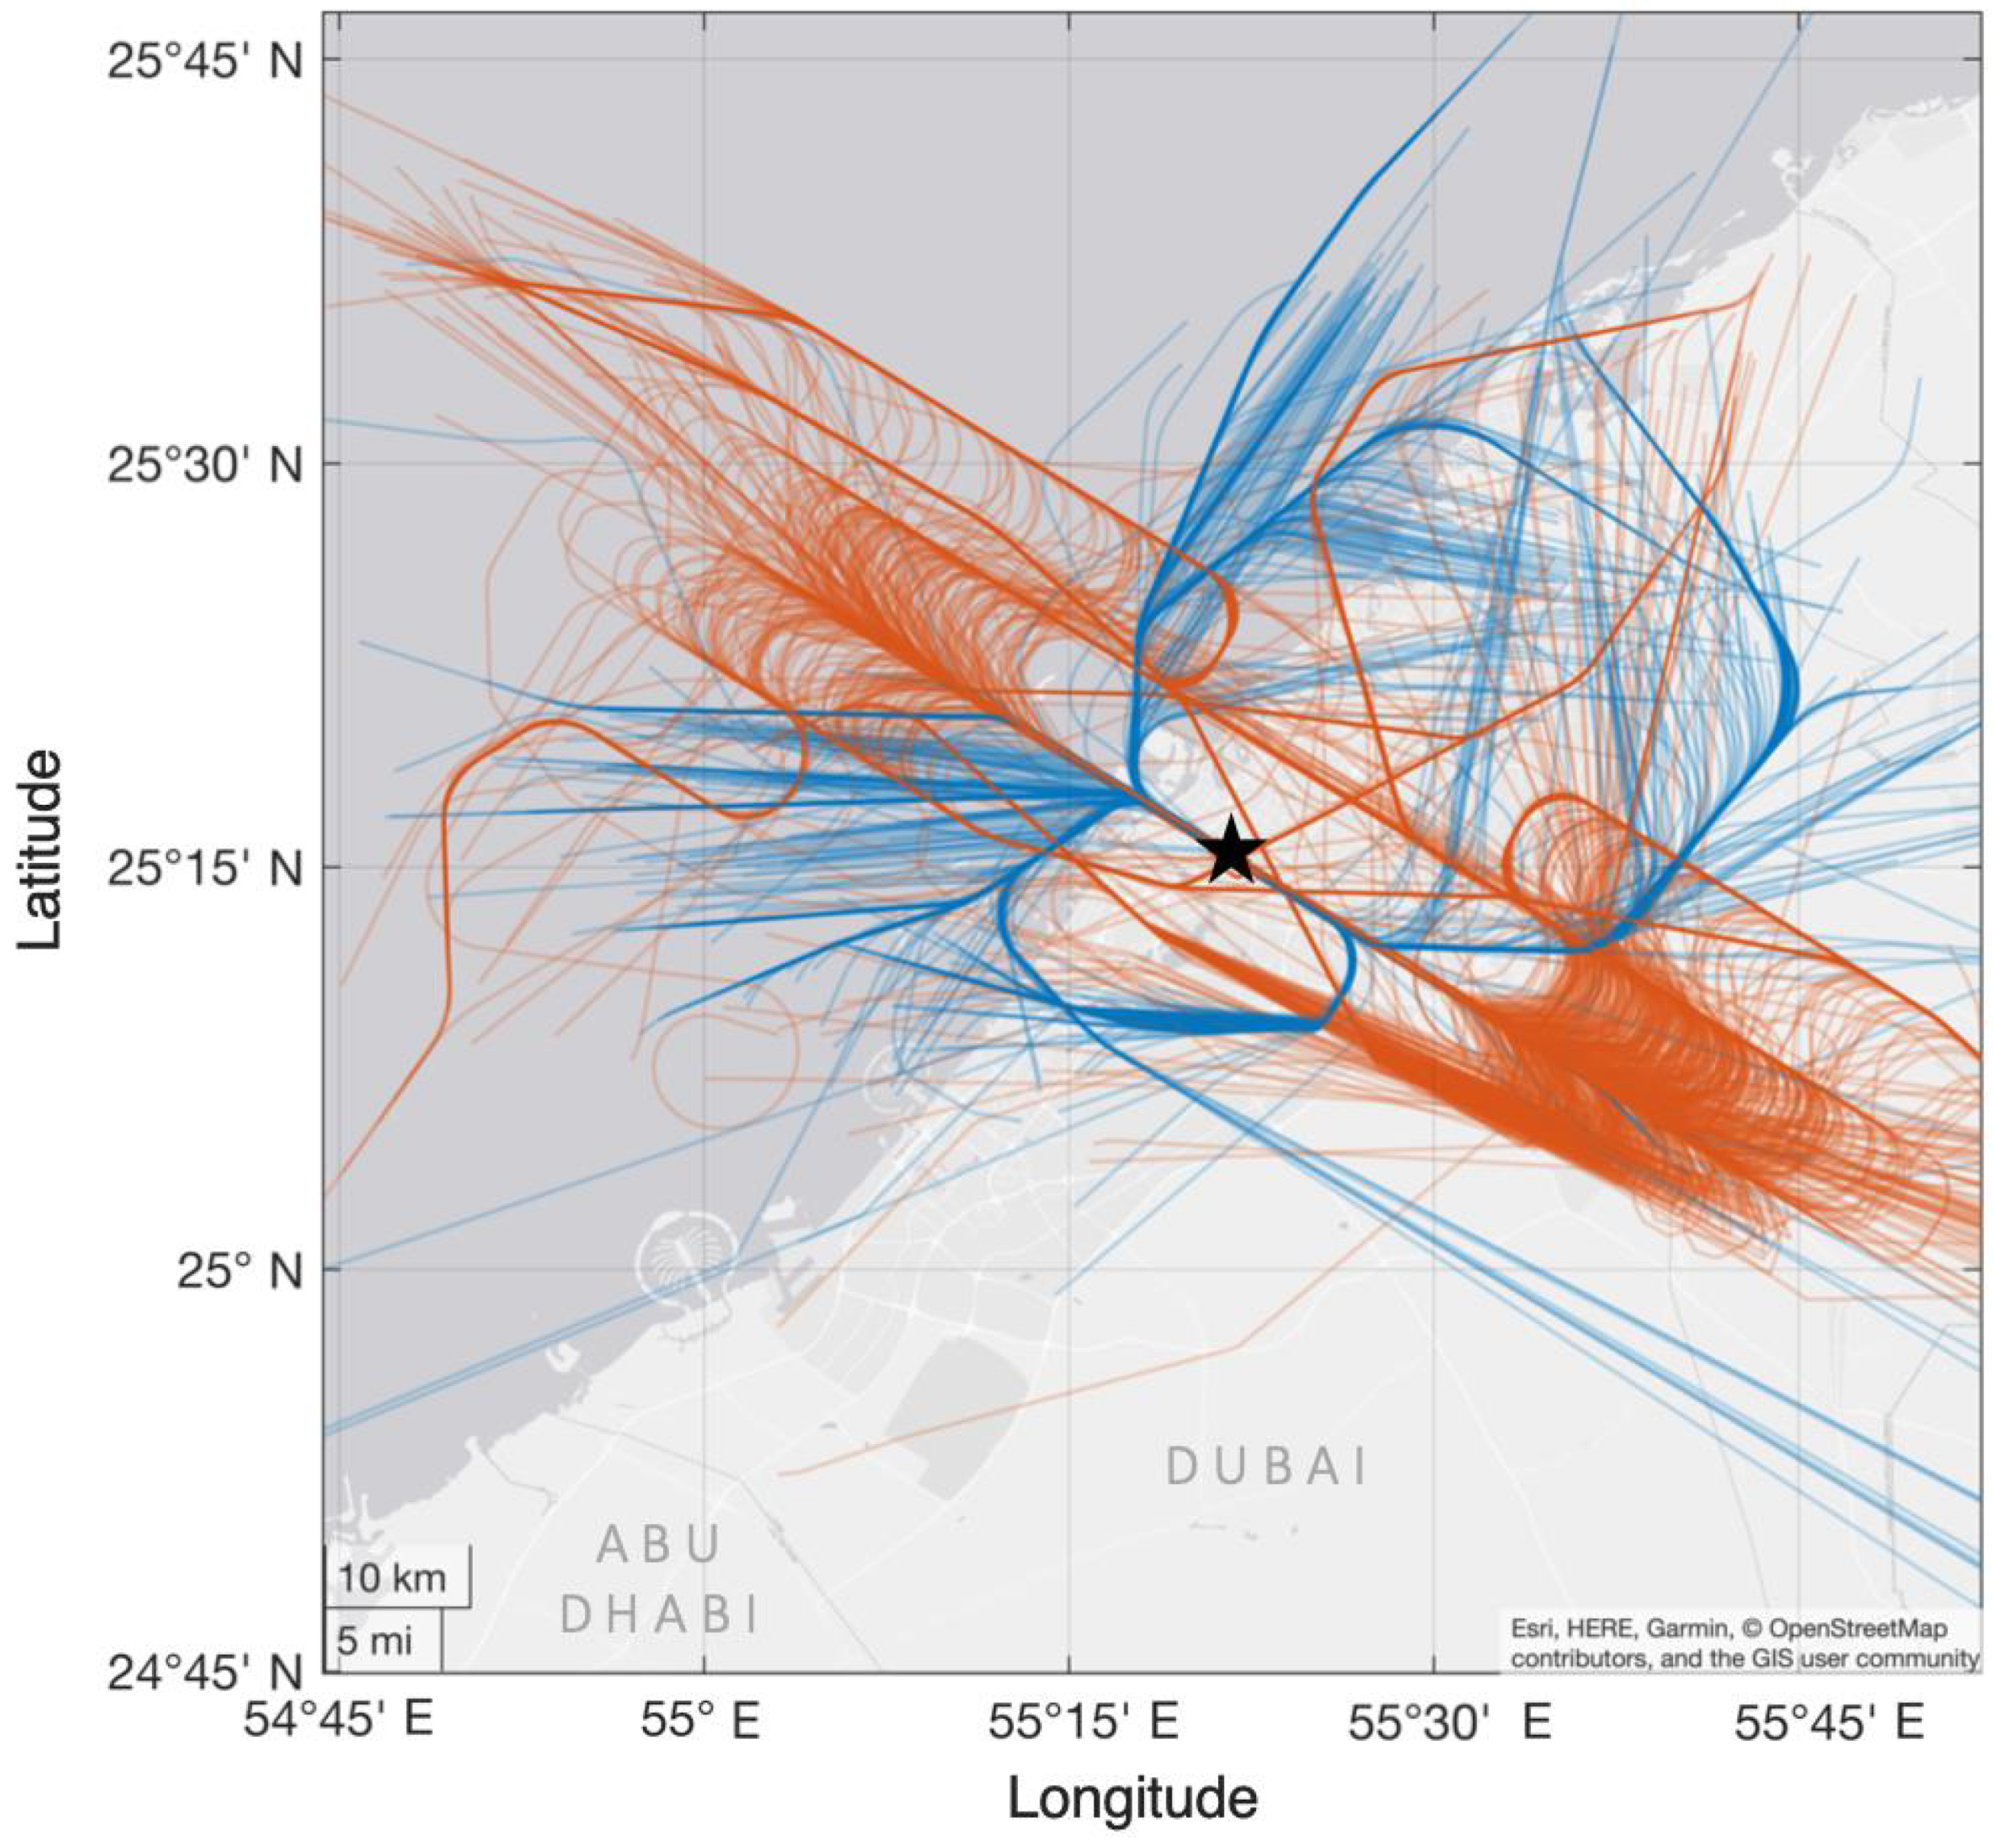
2.1. Trajectory and Fleet Data

Trajectory data is available from a number of different sources; the OpenSky Network (OSN) [4] was selected for this study. The data stored consists primarily of ADS-B, although there are regions and flights from 1 January 2020 onward, where full or partial Mode-S coverage exists. The ADS-B data is the more basic format and contains fewer properties than the full Mode-S data from the network. ADS-B data has a matrix of data with the following properties contained:
  • International Civil Aviation Organization 24 bit identifier for aircraft (Hexcode)
  • Latitude
  • Longitude
  • Ground Speed (GS)
  • Altitude (Barometric)
When analysing a fleet-based approach, there are several considerations that have been identified, such that a detailed analysis was conducted. One consideration within this process is the selection of an airline such that the ‘hub’ airport is located near an airport with good ADS-B coverage, especially within the limitations of a desertic region. Dubai International Airport (IATA: DXB, ICAO: OMDB) was selected as the largest airport within the region where suitable ADS-B coverage exists. An LCC was selected as the focus of the study within the Persian Gulf due to the airline conducting intergulf short (1–2 h) flights alongside longer flights to destinations outside the region including Europe, India and Northern Africa. The LCC’s fleet is detailed in Table 1.
A list of the flights observed within the OSN for the LCC’s fleet in 2019 has been compiled. This includes both arrivals and departures for the year-long period. For all flights within this list, the data is further augmented with an airport database to assign and validate the departure and arrival airports initially stated, alongside the assignment for flights where the initial airports are unavailable. There are approximately 60,000 flights identified that have been operated in the year-long period. We analyse solely the month of March 2019, as this will allow comparisons to be made to the work conducted in previous studies [1]. It is important to note that more than 60,000 flights may have been operated by the LCC in 2019; however only those identified within the OSN database are included here.
As is the case with many trajectory-based studies, ‘Raw Data’ must be filtered to allow for an accurate simulation of the aircraft’s flight. Within the traffic software developed by Olive [5], there are many filtering methods that can be applied to remove inconsistencies within the properties that have been obtained from the raw ADS-B data requests. One such property that requires the use of the filtering algorithm is the altitude ( z ) . Within the raw data files, sporadic jumps occur in the data set. These occur for many reasons, including mis-calibrated sensors and incorrect processing causing the signal to be misinterpreted. The required filtering is highly dependent upon the property contained within the raw data set. ADS-B requires less filtering than the Mode-S data due to the limited parameters available in comparison to Mode-S. The altitude parameters within the barometric and geometric reference frames appear to hold the most sporadic deviations within the sampled ‘raw’ ADS-B files. We hence conducted a study into the raw data files obtained, and we identified the following parameters that could be used to allow for a filtering algorithm to be created. They are as follows:
  • d z d t exceeds known aircraft limits
  • | z g e o z b a r o | 2000 feet
  • ADS-B consecutive data point time gap > 5 min
Due to the lack of ADS-B receivers within the Gulf regions, and to allow for the largest possible data set to be made available, an algorithm to detect the phases of an aircraft’s flight has been created. This allows for the climb, cruise and descent phases of a flight to be identified within an ADS-B trajectory file. Given that most of the atmospheric dust is in abundance below 10,000 feet, any flights that had a segment that existed between 0 and 10,000 feet in any of the flight regimes have been analysed within this contribution. This is to ensure that after filtering, the largest possible data set has been captured. Given the nature of the flights that are conducted within this region, a large sample set is likely to capture a larger variation in the flights flown.

2.2. Weather Reanalysis Model

The dust concentration and wind data are obtained from the CAMS weather reanalysis data set. The concentration data is given in a four-dimensional matrix containing: time ( t ) , longitude ( λ ) , latitude ( ϕ ) and altitude ( z ) . The CAMS system is based upon the use of 40 km square grids with a temporal resolution of 3 h for reanalysis-based studies. The use of single-level (through the whole atmosphere using spectrometers) and multilevel analysis is available. For the multilevel analysis, 60 discrete pressure levels exist from International Standard Atmosphere (ISA) standard barometric pressure (1013 hPa) to 0.1 hPa. The dust-based data are contained within 3 discrete bins that capture the size of the particles within the atmosphere:
  • 0.030–0.550 μ m
  • 0.550–0.900 μ m
  • 0.900–20.000 μ m
If aircraft positional data with time are known, the flight trajectory is superimposed into the four-dimensional reanalysis solution domain, containing the modelled fluid temperature, pressure, u- and v-component of wind, and dust mixing ratio. Calculating the local air density in each cell allows the local dust concentration as mass per unit volume to be calculated at each point along the flight trajectory.

3. Theory & Calculations

3.1. Dust Exposure Dose

The term dose was first developed as a comparative measure for aircraft engine exposure to volcanic ash plumes, in research that followed the Eyjafjallajökull eruption of 2010. Clarkson, R. J. et al. define it as the ash concentration ash multiplied the duration of exposure and use units of g s m 3 [6]. When multiplied by the engine volume flow rate, it allows a simple calculation of the total dust mass ingested in a given exposure period. Clarkson, R. J. et al. showed consistency in the engine damage extent as a function of dose level and established an advisory volcanic ash exposure limit of 14.4 g s m 3 as a result of their analysis. Bojdo, N. et al. later applied the methodology to generic commercial flight operations during dust storms and calculated a peak dose of 0.47 g s m 3 during March 2018 [1]. The dose is calculated as follows:
δ 12 = i = 1 n c v ( x , t ) d t g s m 3
For their analysis, Bojdo, N. et al. [1] used generic climb-out and approach flight profiles along a great circle and as such were not able to capture and investigate variability of dust mass ingestion to realistic aircraft movements. Using i = 1 to n in Equation (1) as the discrete concentration data points for the analysis over a whole aircraft trajectory the dose can, theoretically, be calculated.
In the case of trajectories obtained from OpenSky, we set an altitude limit for our observations. This reduces the likelihood of miscalculating dose as a result of spurious altitude readings that are not picked up by our pre-existing filters. It is also unlikely that concentration levels will remain significant at altitudes greater than 10,000 feet.

3.2. Verification Study

To provide confidence in the accuracy of the ADS-B derived positional data, we first verify the flight track with open access data from the In-service Global Observing System (IAGOS) [7]. IAGOS is comprised of a fleet of nine commercial aircraft fitted with atmospheric observation instruments, providing validation and input data relating to humidity, cloud particles and aerosols to weather modellers and researchers around the world. An IAGOS flight flown by an Airbus A330-343 with registration D-AIKO has been selected for the analysis. This aircraft operated a flight between its base airport of Frankfurt (EDDF) and Kuwait (OKBK) at 12:00z on 1 October 2019. FDR data is available for the full flight and ADS-B data is available for the initial 3-h period of the flight, this includes the departure from Frankfurt up until the aircraft loses the ADS-B signal over eastern Turkey. The aircraft does not return to ADS-B or Mode-S surveillance within the Persian Gulf and this highlights a fundamental limitation when analysing the fleets of other carriers based at airports with no coverage within this desert region. Kuwait (KWI) is a clear example of an airport within the region, among many, which does not have ADS-B coverage and hence fleet analysis would be restricted by aircraft based at this airport.
Figure 2 presents the FDR and ADS-B trajectory map comparing the two data sources up until the ADS-B data source ceases to continue. It can be observed that there is a strong correlation between the latitudinal and longitudinal position data obtained from ADS-B and FDR data for the initial 3.5 h of the flight. After this point due to the lack of available ADS-B data, no further comparisons can be drawn. We define the horizontal positional error (HPE) as:
ψ H P E = λ d i f f 2 + ϕ d i f f 2
where ψ H P E is the horizontal positional error ( ), λ d i f f is the longitudinal error ( ) & ϕ d i f f is the latitudinal error ( ). In both the horizontal ( ϕ , λ ) and vertical (z) planes, one anomalous result is a cause for concern. This occurs at 13:30z where the horizontal positional error ( ψ H P E ) deviates by 0.6 and the vertical deviation is 200 feet. Due to the coupling of a peak horizontal and vertical positional error, which both have a maximum value at the same time, we can postulate that this deviation is most likely occurring due to latency of the ADS-B receiver and incorrect data encoding [8]. Examining this worst-case horizontal positional error of 0.6 , and accounting for the resolution of the CAMS grid-cells (0.75 by 0.75 ), one can deduce that in the worst case, an aircraft will only be displaced into the neighbouring grid-cell and in most cases will remain within the correct grid cell and hence analysis of dust ingestion is possible. The percentage difference in the worst case is 0.46%, indicating a clear correlation between the FDR and ADS-B data, and hence use of ADS-B data alone is deemed valid for further examination.

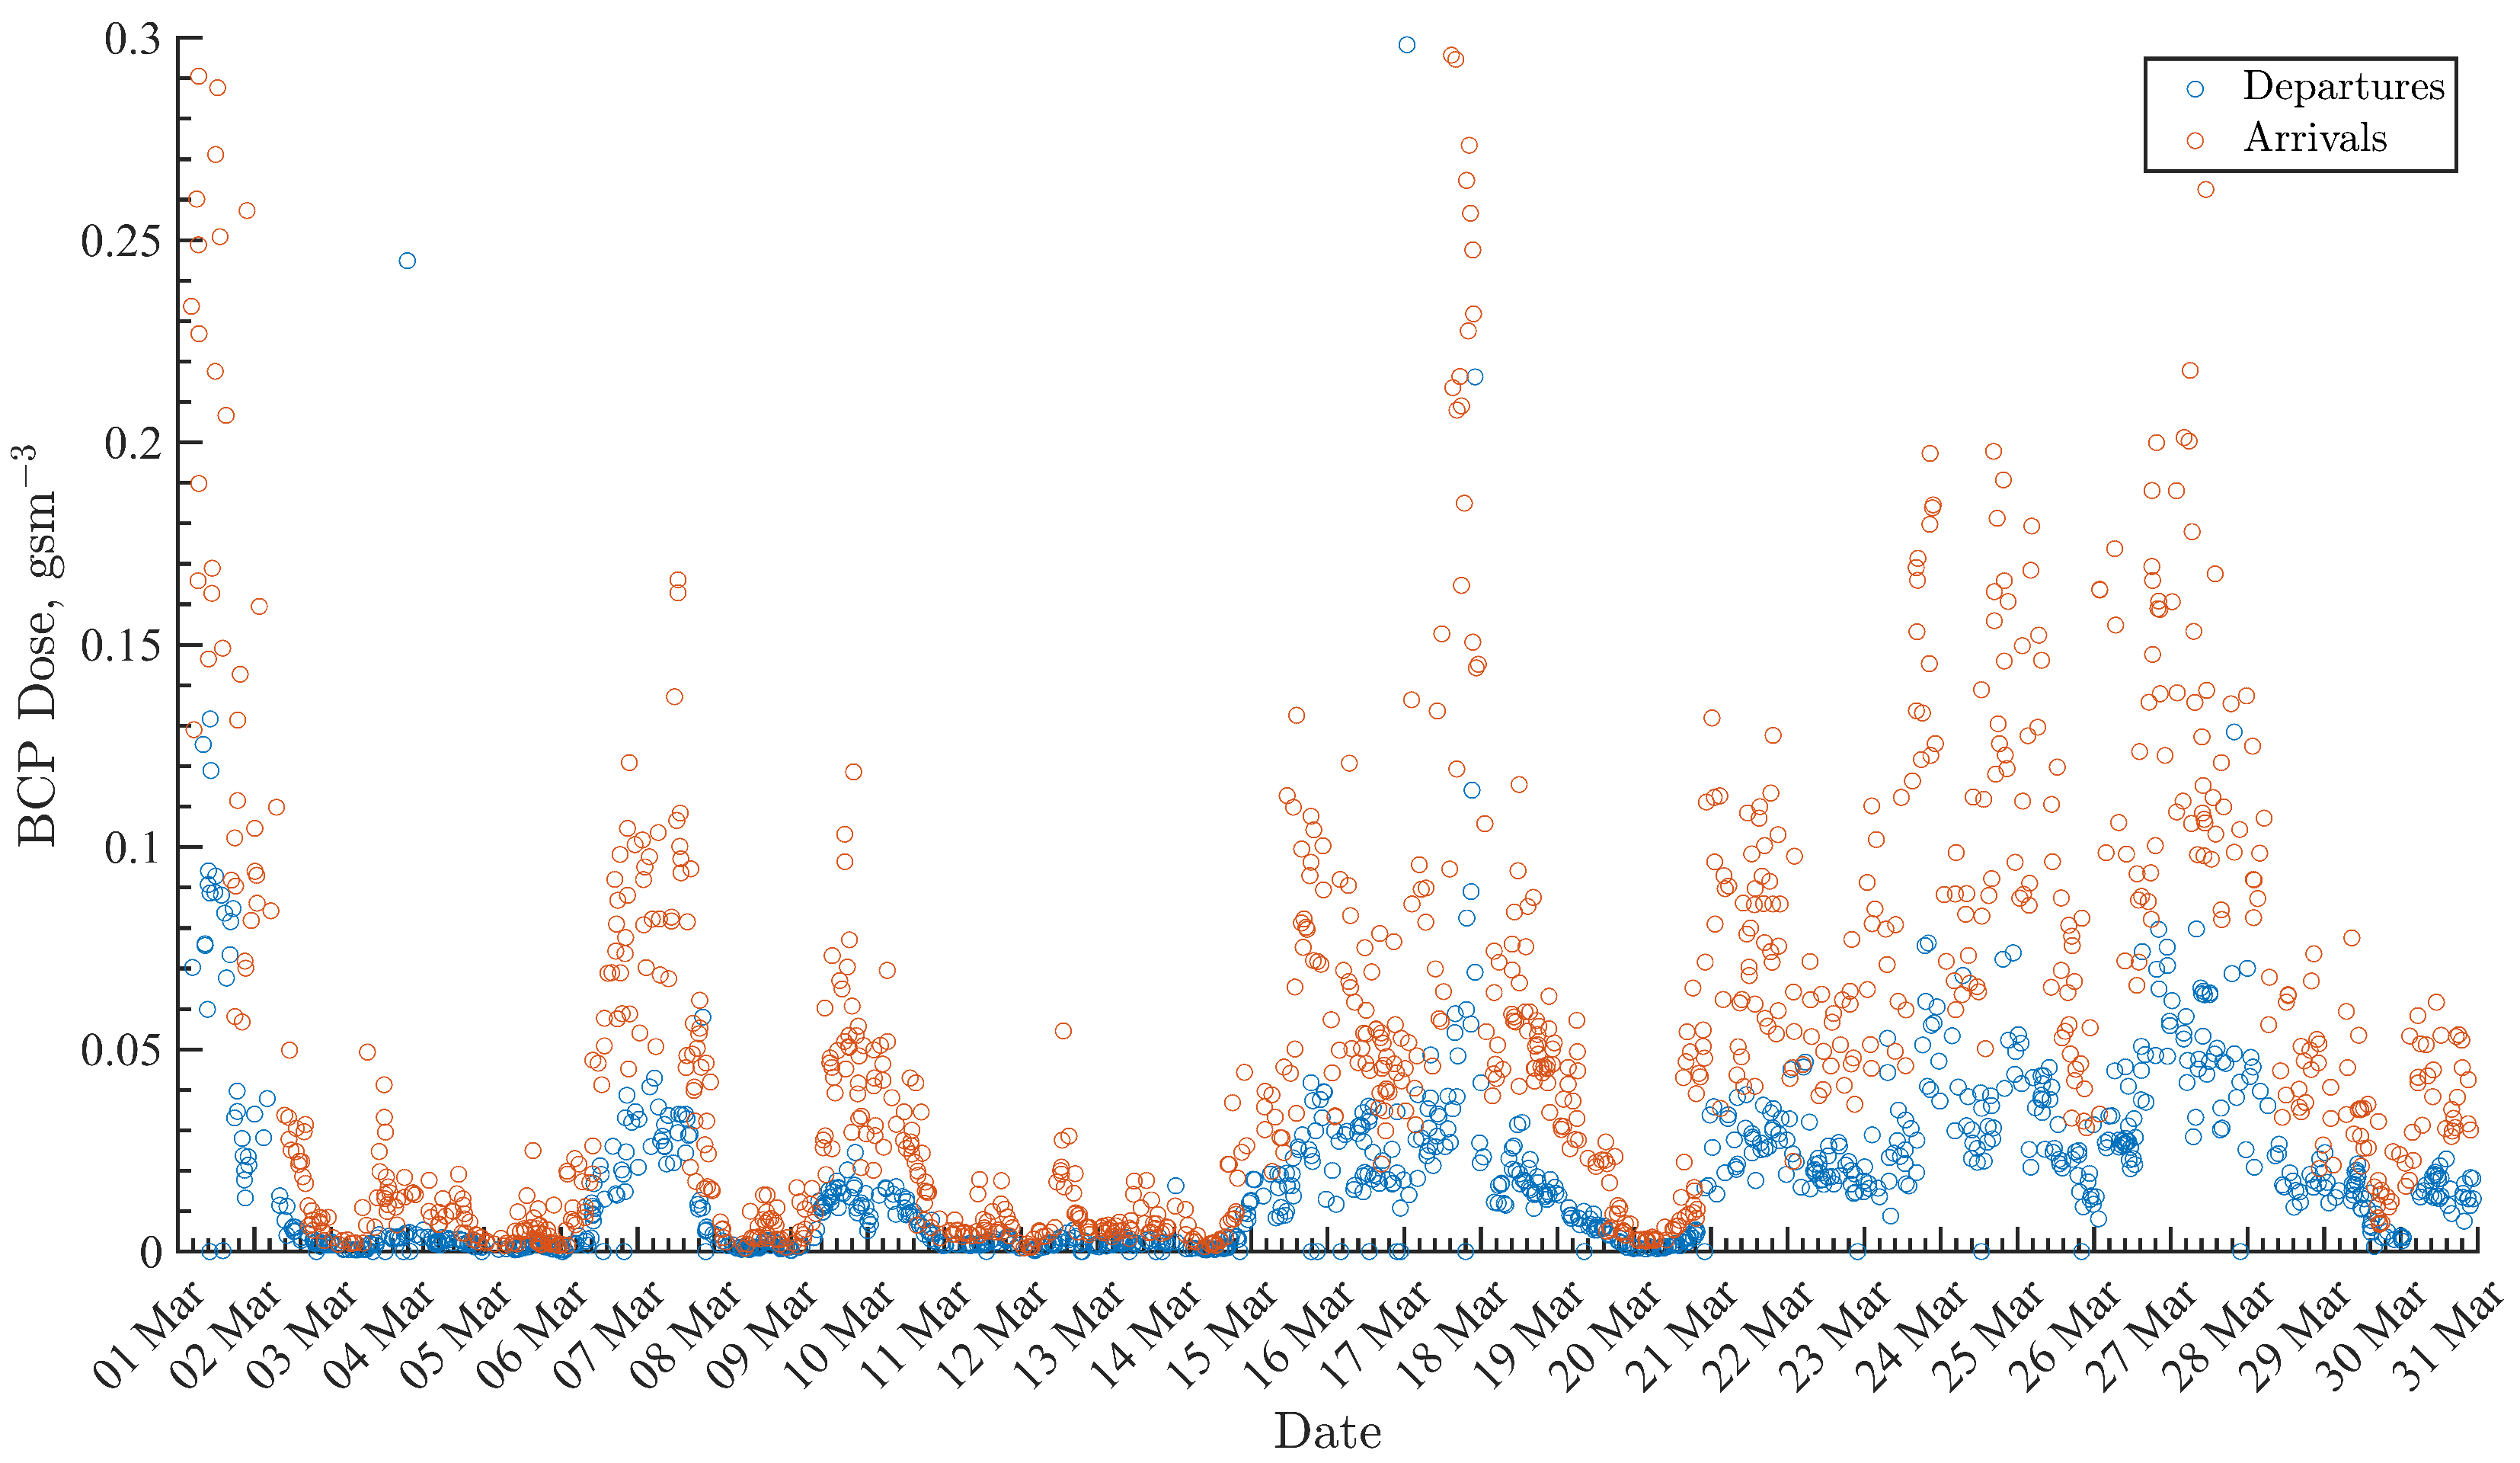
3.3. Spurious Dose Filter

During a preliminary inspection of the dose records of each flight, it became evident that additional filtering to remove spurious data points would be required. For example, one outlying departure dose of >2.4 g s m 3 was recorded on 22:48z on 23 March 2019, and occurred almost entirely at an altitude of 8000–9000 feet. This transpired to be a positional error in the trajectory, as characterised by a fixed altitude of 8150 feet for several minutes followed by a jump to 35,000 feet. This escaped our existing erroneous position filter due to the duration of the rogue segment; an update will be made in future that can be applied during trajectory retrieval, as opposed to during post-processing.
In the present work, the erroneous flights were removed from analysis by setting a ‘reasonable dose limit’, above which a recorded dose could only be considered spurious. For example, consider a minimum descent rate of 1500 feet/min, typical of commercial airliners, which translates to a maximum 40 s of flight time per 1000 feet altitude change. To experience a dose of 2 g s m 3 in 40 s, the aircraft would have to be flying through a concentration of 50 mgm 3 . This is highly improbable dust concentration—around two orders of magnitude greater than background dust concentrations in the Middle East, and one order greater than that in a sandstorm [9]. Furthermore, as the size of a single CAMS grid cell is greater than 13,000 feet, it is unlikely that the elevated dose level is due to the aircraft momentarily entering a cell of high dust concentration as it climbs through 1000 feet of altitude.
To set a reasonable dose limit, we break the atmosphere into bins of 1000 feet interval and calculate the mean dose, μ . If the mean dose within a single altitude bin exceeds a value of ( μ + σ ) , where μ is the mean dose of all retrieved flights, and σ is the standard deviation, then the flight is discarded. For the 2258 flights under consideration, 12 were identified as having spurious dose levels. A further 19 were removed due to lacking an origin and destination airport, which would cast uncertainty on the direction of flight.

4. Results and Discussion

4.1. Fleet Analysis

Within the fleet-based analysis that we have conducted for the Low-Cost Carrier’s fleet in March 2019, we initially identified 5919 flights within the OpenSky database. After applying the filtering algorithm for both the departure/arrival airports alongside the flight phases validation algorithm, 2258 flights were flagged as usable. The postprocess filtering reduced this further, leaving around 70 movements per day for analysis. All flights analysed have at least a climb/descent phase with a data fraction of at least 90% enabling further simulations to be conducted. The initial and terminal movements of the flights are shown in Figure 3.

4.2. Mean Dose Levels

The total dust dose per flight is shown in the scatter plot in Figure 4. The temporal trend in dose levels is consistent for both departures and arrivals, showing distinct peaks on 1st, 7th, 10th, 16th, 18th, 21st–22nd, 24th–28th March. Given the month, these are most likely periods of dust storm activity, in which large clouds of dust blow in, usually from the north across the Arabian peninsula. The peak dose level on 18th March is similar in magnitude to the peak dose simulated at a similar time of year in the work of Bojdo et al. [1]. The dose on arrival appears to exceed the dose during departures at the same time by approximately three times, as shown also in Table 2. This is due to the slower approach speed, and additional time spent in holding patterns (see zig-zag shaped arrival trajectories in Figure 3), that do not affect departures. This finding is afforded by the use of real trajectories as opposed to great circle approximations; in future work, we will investigate the difference in dose between hold and nonhold pattern approaches.
It is worth pointing out that the dose approach does not account for engine state: during a departure, and to some extent a hold pattern (e.g., turn power), the engine is running at a higher thrust setting than in the final approach. The volume of particulate-laden air processed by the engine per unit of time, and the core temperature of the engine, will therefore also be higher, thereby subjecting the internal components to a greater risk of dust-induced degradation.

4.3. Effect of Runway Direction

Table 2 also shows the effect of runway orientation on dose, which was determined by analysing the direction of the flight track at 1000 feet above the ground just following departure, or just prior to arrival. A height of 1000 feet is chosen as a suitable point in the flight in order to avoid taxiing movements, although 4.7% of runway directions were not correctly resolved by this method, as there are two runway orientations at Dubai International: 12 L/R and 30 L/R. The majority of flights (68.1%) arrive or depart on a heading of 120 degrees, and curiously, the dust dose is over twice as high as when the movements depart or arrive in this direction. Further work is required to understand the reason of this, although the change in wind direction that is often the cause of runway direction change may also produce a change in the nature of the blown dust as it is transported from a different source region.

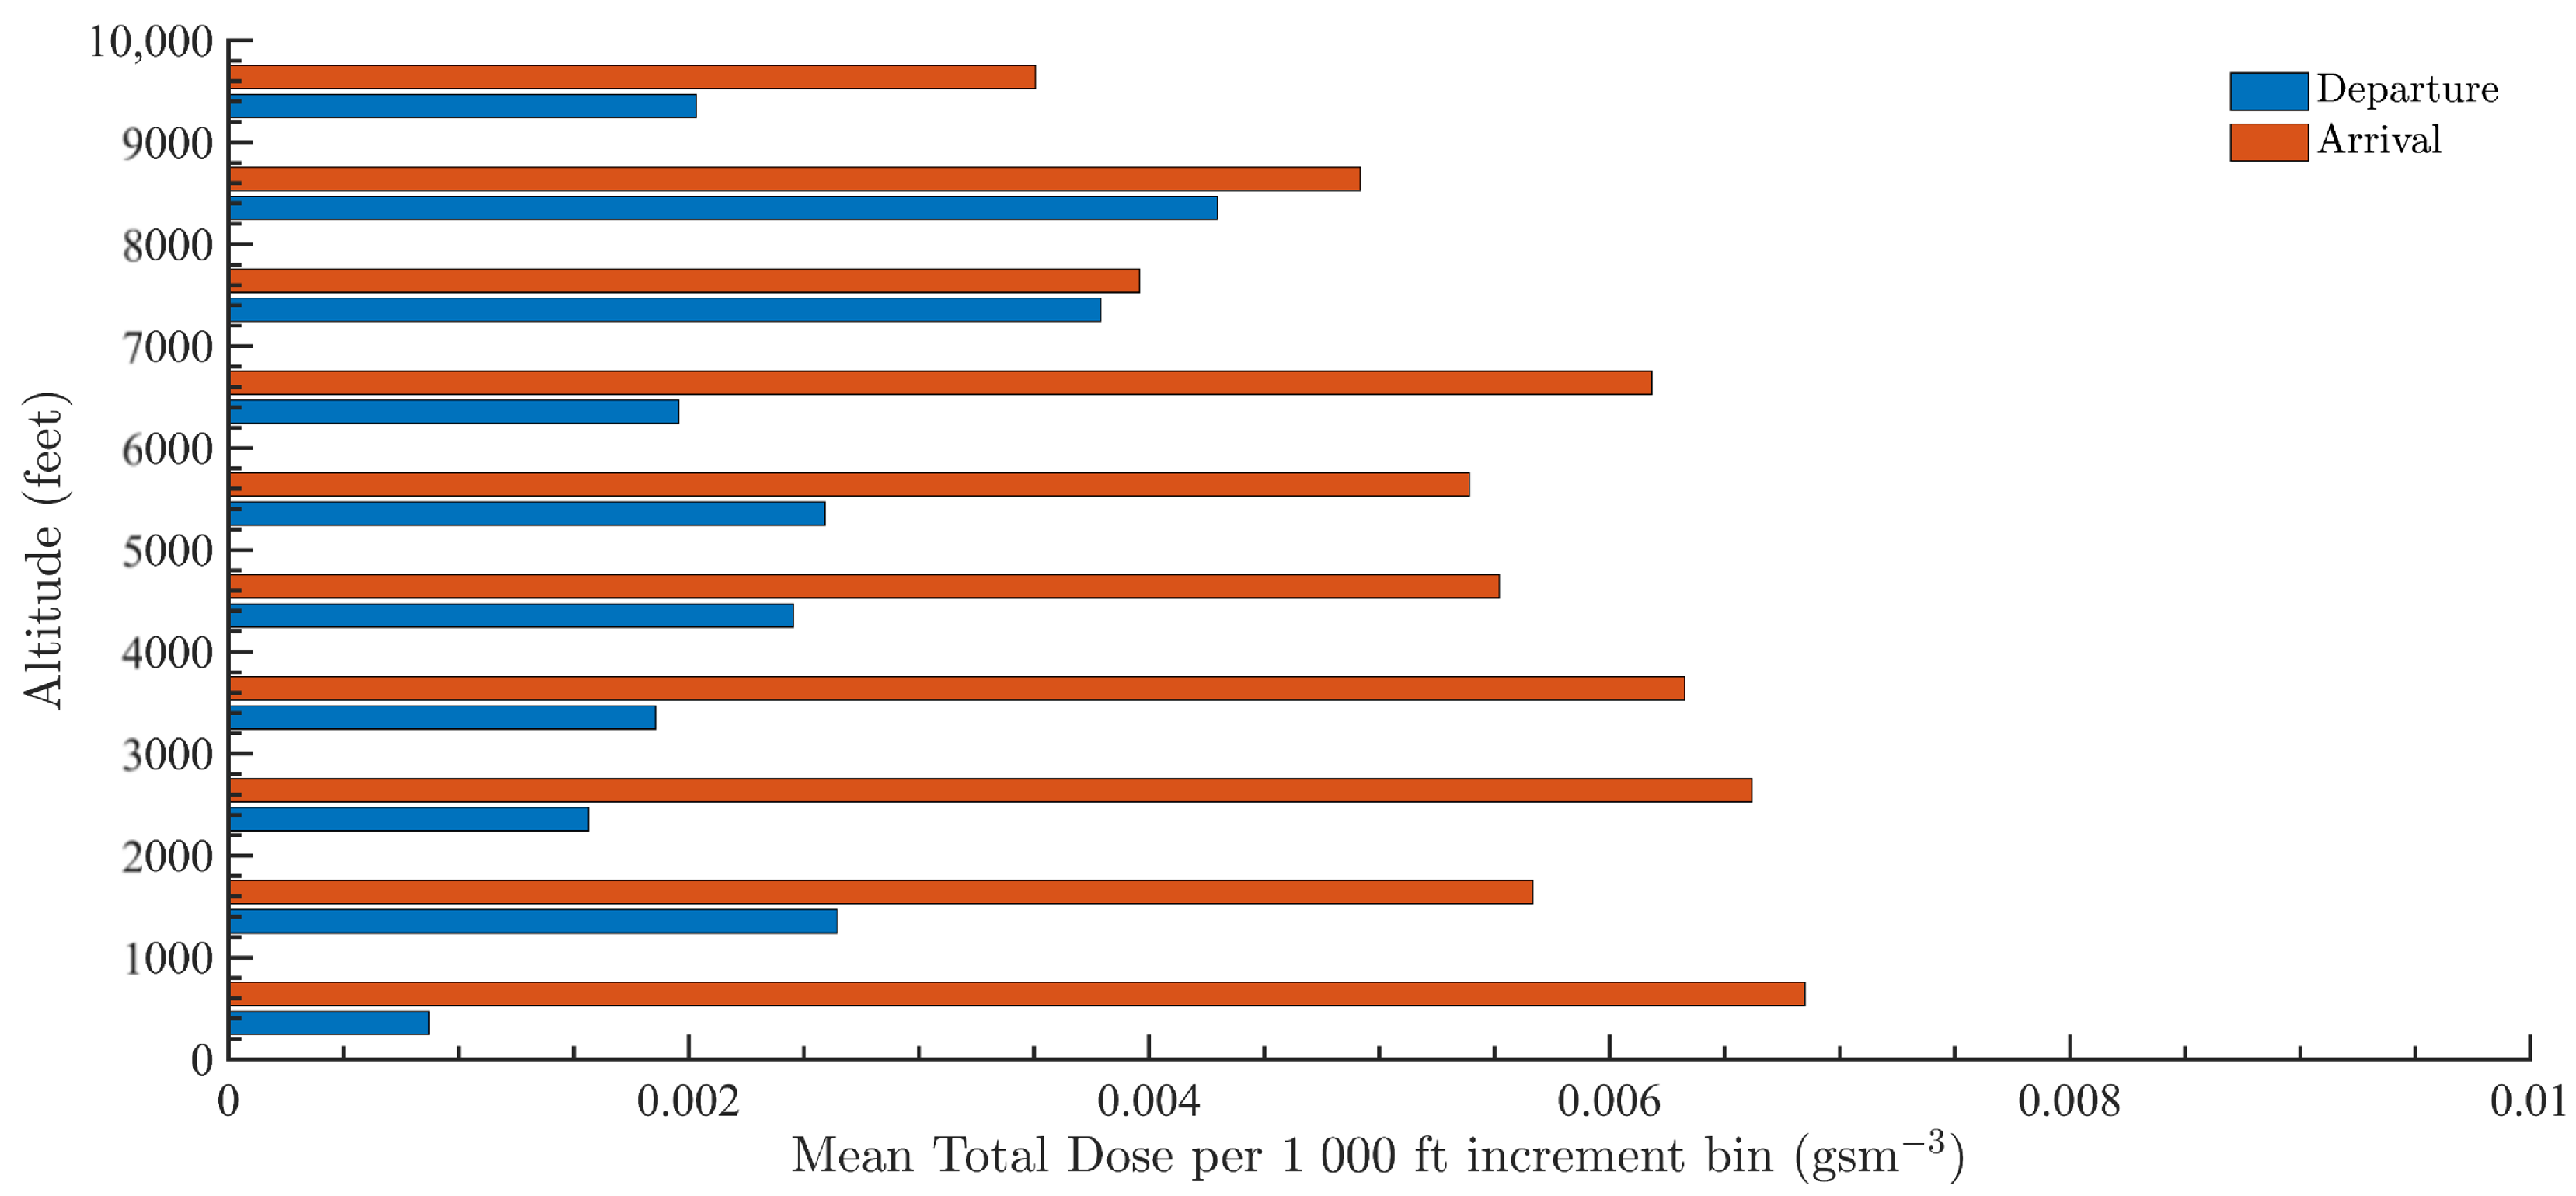
4.4. Altitudinal Variation in Dose

We can also use the record of real trajectories to investigate the difference in dose with altitude, between arrivals and departures. Figure 5 shows the difference in dose at 1000 feet intervals. The mean departure dose record is most likely simply a reflection of the mean dust concentration profile in March 2019, given that the aircraft climbs directly out from the airport. The dose is seen to generally increase with altitude up to 6000 feet, before reducing. If the data had so been included, the results suggest that dust may have been present above 10,000 feet, too. Further work is required to ascertain whether this profile is typical all year round, or is characteristic of months of high dust storm activity. Again, it is interesting to note that peak dose is not at the lowest altitude.
The mean dose profile during approach emphasises the large difference in magnitude and illustrates a gradually increasing dose level with decreasing altitude. At certain flight levels, such as 6000–7000 feet, there is a jump in dose level. Further analysis is required to ascertain whether this is a result of the altitude of holding patterns, as inbound aircraft await a landing slot.

5. Conclusions

The OpenSky database provides an opportunity to investigate the influence of real operational constraints on aircraft engine susceptibility to dust ingestion. Trajectory retrievals of fleet of a Dubai-based low-cost carrier illustrate that variations in dust exposure level, expressed by dose, depend on several factors beyond simply the local concentration of dust. The dose encountered by a low-cost carrier’s fleet of aircraft in March 2019, between sea-level and 10,000 feet, revealed that arrival dose exceeds departure dose by three times, most likely as a result of aircraft requiring to queue in holding patterns. For the airport of interest, Dubai International Airport, it was found that when movements operated on the less frequent runway direction of 300 degrees, mean dose was reduced by more than half. These findings were possible thanks to the availability of the open source flight trajectory data, which also caters for inspection of anomalous results, case-by-case investigations, and fleetwide studies. However, currently, there are inherent limitations in the conclusions one may draw in this region due to patchy ADS-B receiver coverage.

Author Contributions

Conceptualization, N.B. and A.F.; methodology, D.R. and B.P.; software, D.R. and B.P.; validation, N.B.; formal analysis, N.B.; data creation, D.R.; writing—original draft preparation, D.R.; writing—review and editing, N.B. and A.F.; visualization, N.B. and D.R.; supervision, B.P.; funding acquisition, N.B. All authors have read and agreed to the published version of the manuscript.

Funding

The verification dataset was attained through a short Engineering and Physical Sciences Research Council Impact Acceleration Account, grant number EP/R511626/1.

Data Availability Statement

The In-Aircraft Global Observing System (IAGOS) dataset, which was used to verify the flight track and dust presence data, is maintained at https://iagos.aeris-data.fr/, accessed 5 November 2022.

Acknowledgments

The authors wish to acknowledge Martin Gallagher and Gary Lloyd for their contribution of the IAGOS Backscatter Cloud Probe instrument dataset.

Conflicts of Interest

The authors declare no conflict of interest.

Abbreviations

The following abbreviations are used in this manuscript:
ADS-BAutomatic Dependent Surveillance-Broadcast
ECMWFEuropean Centre for Medium-Range Weather Forecasts
CAMSCopernicus Atmosphere Monitoring Service
FDRFlight Data Recorder
GSGroundspeed
IAGOSIn-service Aircraft Global Observing System
IATAInternational Air Transport Association
ICAOInternational Civil Aviation Organization
LCCLow-cost Carrier
OSNOpen-Sky Network
SSRSecondary Surveillance Radar
TASTrue Airspeed

References

  1. Bojdo, N.; Filippone, A.; Parkes, B.; Clarkson, R. Aircraft engine dust ingestion following sand storms. Aerosp. Sci. Technol. 2020, 106, 106072. [Google Scholar] [CrossRef]
  2. Lancaster, N. SEDIMENTARY PROCESSES|Aeolian Processes. In Encyclopedia of Geology; Academic Press: Cambridge, MA, USA, 2005; p. 616. [Google Scholar] [CrossRef]
  3. Notaro, M.; Yu, Y.; Kalashnikova, O.V. Regime shift in Arabian dust activity, triggered by persistent Fertile Crescent drought. J. Geophys. Res. Atmos. 2015, 120, 10229–10249. [Google Scholar] [CrossRef]
  4. Schäfer, M.; Strohmeier, M.; Lenders, V.; Martinovic, I.; Wilhelm, M. Bringing up OpenSky: A large-scale ADS-B sensor network for research. In Proceedings of the 13th International Symposium on Information Processing in Sensor Networks (Part of CPS Week), Berlin, Germany, 15–17 April 2014; IPSN 2014. pp. 83–94. [Google Scholar] [CrossRef]
  5. Olive, X. Traffic, a toolbox for processing and analysing air traffic data. J. Open Source Softw. 2019, 4, 1518. [Google Scholar] [CrossRef] [Green Version]
  6. Clarkson, R.J.; Majewicz, E.J.; Mack, P. A re-evaluation of the 2010 quantitative understanding of the effects volcanic ash has on gas turbine engines. Proc. Inst. Mech. Eng. Part G J. Aerosp. Eng. 2016, 230, 2274–2291. [Google Scholar] [CrossRef]
  7. Petzold, A.; Thouret, V.; Gerbig, C.; Zahn, A.; Brenninkmeijer, C.A.M.; Gallagher, M.; Hermann, M.; Pontaud, M.; Ziereis, H.; Boulanger, D.; et al. Global-scale atmosphere monitoring by in-service aircraft—Current achievements and future prospects of the European Research Infrastructure IAGOS. Tellus B Chem. Phys. Meteorol. 2015, 67, 28452. [Google Scholar] [CrossRef] [Green Version]
  8. Ali, B.S.; Schuster, W.; Ochieng, W.Y. Evaluation of the Capability of Automatic Dependent Surveillance Broadcast to Meet the Requirements of Future Airborne Surveillance Applications. J. Navig. 2017, 70, 49–66. [Google Scholar] [CrossRef] [Green Version]
  9. Shao, Y.; Yang, Y.; Wang, J.; Song, Z.; Leslie, L.; Dong, C.; Zhang, Z.; Lin, Z.; Yutaka, K.; Yabuki, S.; et al. Northeast Asian dust storms: Real-time numerical prediction and validation. J. Geophys. Res. Atmos. 2003, 108, 2003JD003667. [Google Scholar] [CrossRef]
Figure 1. Process Overview.
Engproc 28 00011 g001
Figure 2. ADS-B (red) and FDR IAGOS data (blue) plots showing: (a) (left)) flight trajectory for test flight from Frankfurt (ICAO: EDDF) to Kuwait (ICAO: OKBK); and (b) (right) variation in Mach number from TAS approximation.
Engproc 28 00011 g002
Figure 3. Map showing all 2258 flights successfully analysed for the purpose of this study. Departures are shown in blue, arrivals in orange; Dubai International Airport shown as black star symbol.
Engproc 28 00011 g003
Figure 4. Scatter plot showing variation in dust dose of all valid flights. Departures are shown in blue, arrivals in orange.
Engproc 28 00011 g004
Figure 5. Horizontal bar chart showing variation in dust dose as a function of altitude. Departures are shown in blue, arrivals in orange.
Engproc 28 00011 g005
Table 1. LCC aircraft fleet list in 2019.
Aircraft TypeICAO Type CodeIATA Type CodeNumber in Fleet (2019)
Boeing 737-800 (WL) 1B73873H51
Boeing 737 Max 8B38M7M810
1 (WL): Winglets.
Table 2. Mean dust exposure dose during approach into, and climb-out, from Dubai International Airport.
Category% Total FlightsMean Dose, g s m 3 Std. Dev., g s m 3
Arrivals50.9%0.05480.0550
Departures49.1%0.01700.0178
Runway 12 L/R68.1%0.06060.0539
Runway 30 L/R27.2%0.02740.0382
Unclassified4.7%
Overall100%0.03960.0765
Disclaimer/Publisher’s Note: The statements, opinions and data contained in all publications are solely those of the individual author(s) and contributor(s) and not of MDPI and/or the editor(s). MDPI and/or the editor(s) disclaim responsibility for any injury to people or property resulting from any ideas, methods, instructions or products referred to in the content.

