1. Introduction
The bluntleaf dock/broad-leaved dock (
Rumex obtusifolius) is an easily established, highly persistent perennial, endemic to Austria and commonly encountered all over Europe. Its taproot can penetrate compacted, waterlogged and oxygen-poor soil layers to a depth of 2.60 m. It is considered a pest in agriculture, both in field and pasture, because of its rapid growth, ability to vegetatively propagate from leftover roots and its extensive taproot system. The most important management strategy is to prevent dock plants from establishing. Cultural controls include removal of existing plants to prevent seeding, proper crop rotation and land management to reduce (re-)establishment [
1]. With the need to reduce pesticide usage and to farm sustainably, non-chemical control mechanisms become more prominent. However, there is no single cultural method that controls
R. obtusifolius effectively [
1,
2].
The objective of this study was to train a convolutional neural network (CNN) to achieve a high recognition rate of R. obtusifolius plants at different developmental stages and their position in a conventional pasture using a conventional RGB camera. This technology should aid the targeted control of R. obtusifolius through non-chemical methods.
2. Methods
2.1. Study Site and Data Acquisition
The study was conducted in spring of 2021 in Upper Austria. Images of wild growing
R. obtusifolius plants in local pastures were obtained and a custom-made dataset for the identification of
R. obtusifolius was created. You Only Look Once (YOLO) [
3,
4], a free of charge object detection and localization network, was used to create the CNN [
5]. To increase robustness of the convolutional neuronal network (CNN) images and videos were taken with different devices (UAV, cell phone cameras) and from different angles and developmental stages. The shooting height of the UAV (DJI Phantom) camera was from 8 to 15 m from the ground. A total of 2500 images containing
R. obtusifolius plants were acquired, including 500 cell phone images, and 2000 UAV images. These images were processed and made available to a learning algorithm. The resulting data source and the associated weights were provided to a recognition system.
2.2. Data Pre-Processing and Annotation
The images obtained were processed for further evaluation. Briefly, the images and videos were divided into classes to make the subsequent annotation process easier and faster. By pre-selecting classes, the downstream process improved because of elimination of the need to switch between classifications.
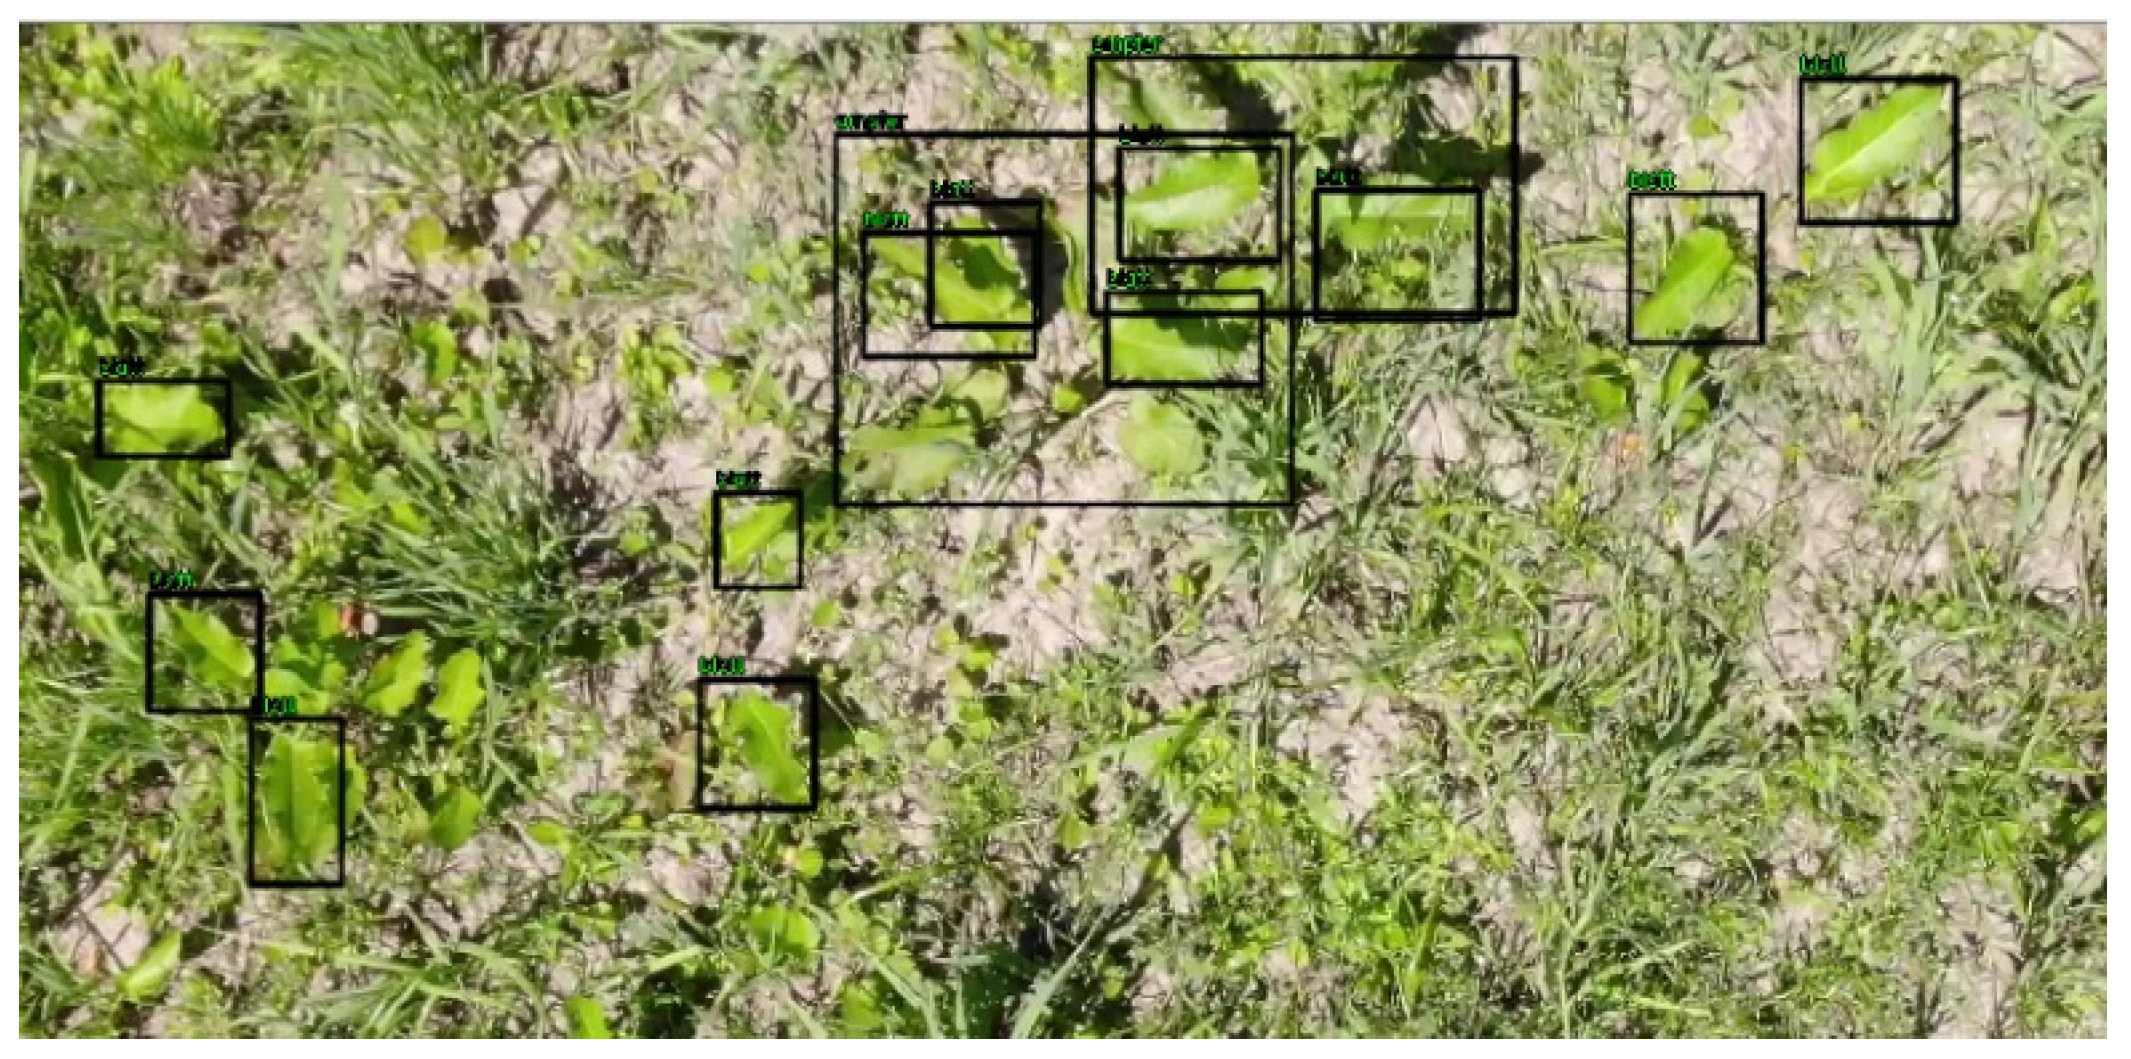
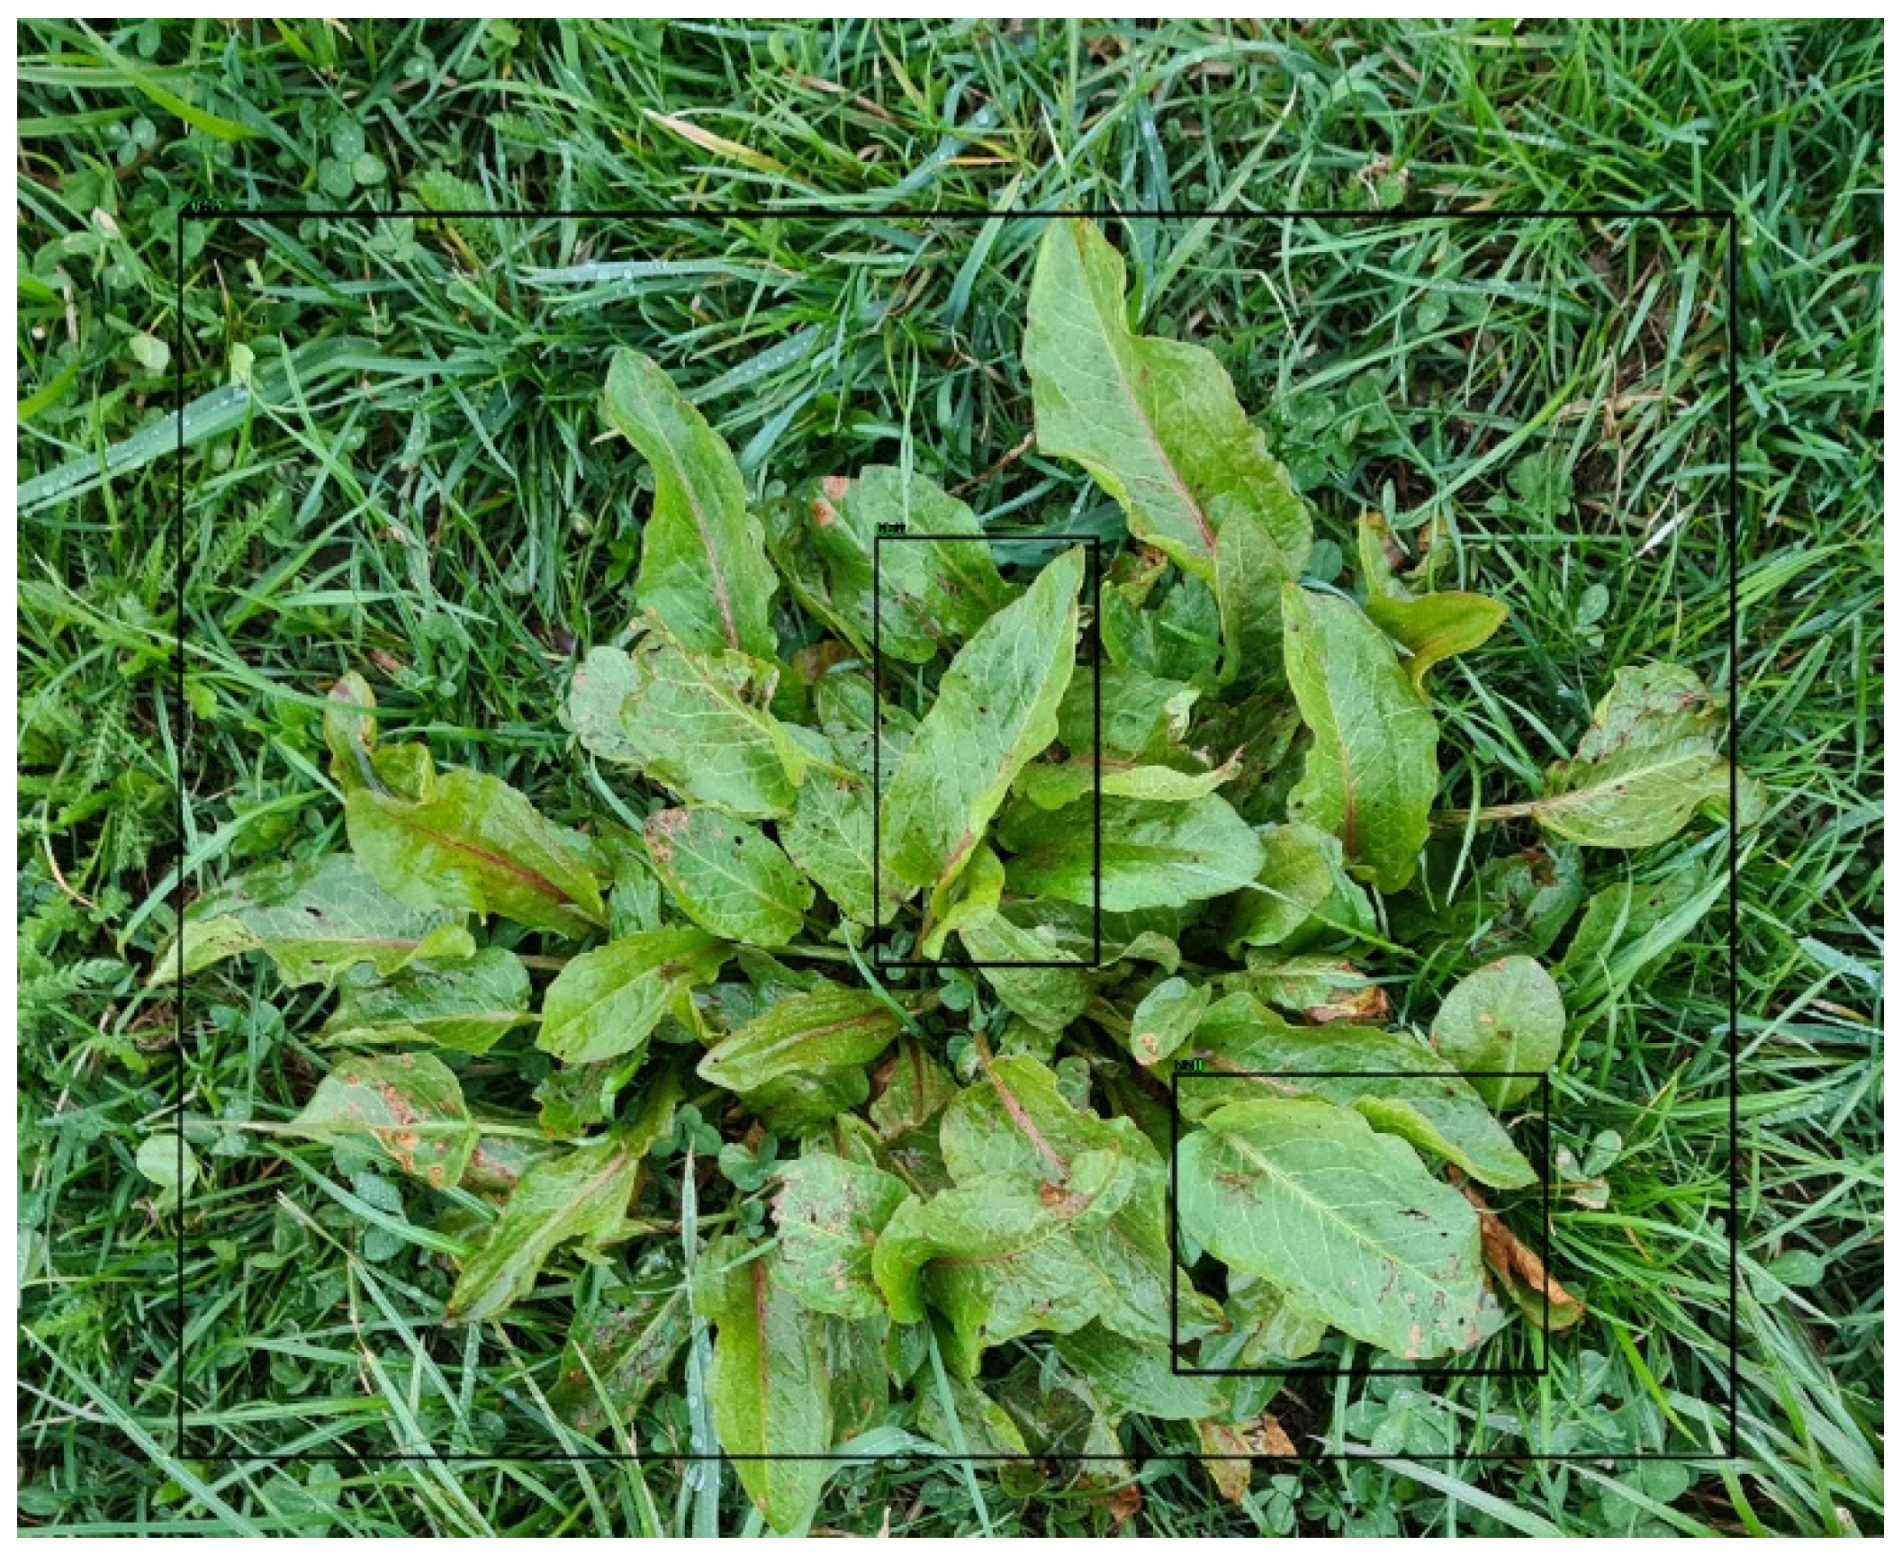
Post pre-selection, the manual labeling of the individual images was conducted. Here DarkLabel (2022 GitHub, Inc., San Francisco, CA, USA) was used and the output was saved into an XML file using the VOC format. Bounding boxes were drawn around the plant or individual leaves and labelled. For each of the labeled images, an additional text file was also generated that contained the annotated bounding boxes’ coordinates. Examples can be seen in
Figure 1 (plants) and
Figure 2 (leaves).
2.3. Deep Learning Approach and Model Training
After annotation and labelling was completed, training of the CNN started using YOLO. Since the images alone do not form a usable neural network that can be applied, the images must be sorted into classes. This step is important to inform the training which leaves belong to which plant in the image. The classification cannot be generalized because each application has its own needs and priorities. The actual learning process took several hours. It is important that the “loss” function shows a trend towards zero.
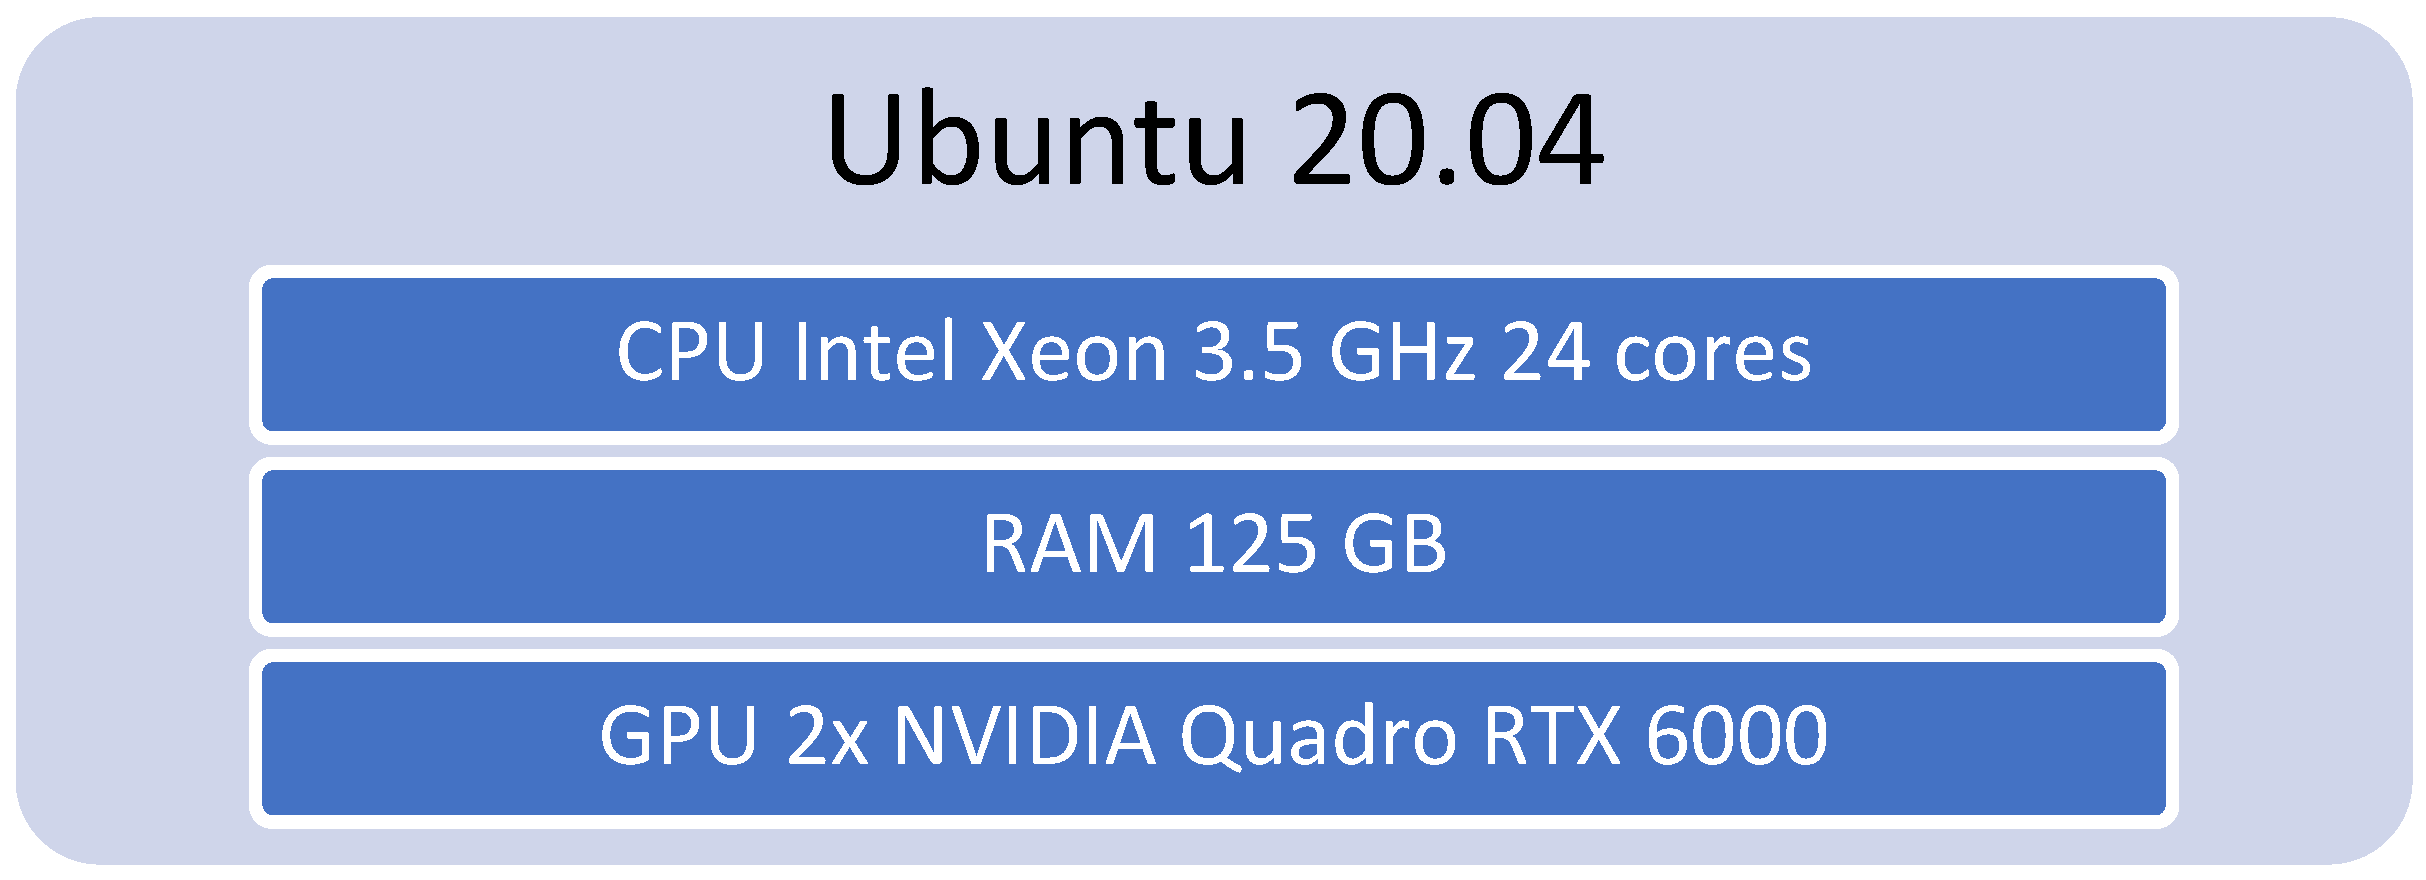
Figure 3 shows the hardware and software architecture. We used Linux as the basic system for the training. In addition, we used two GPUs from NVIDIA for training.
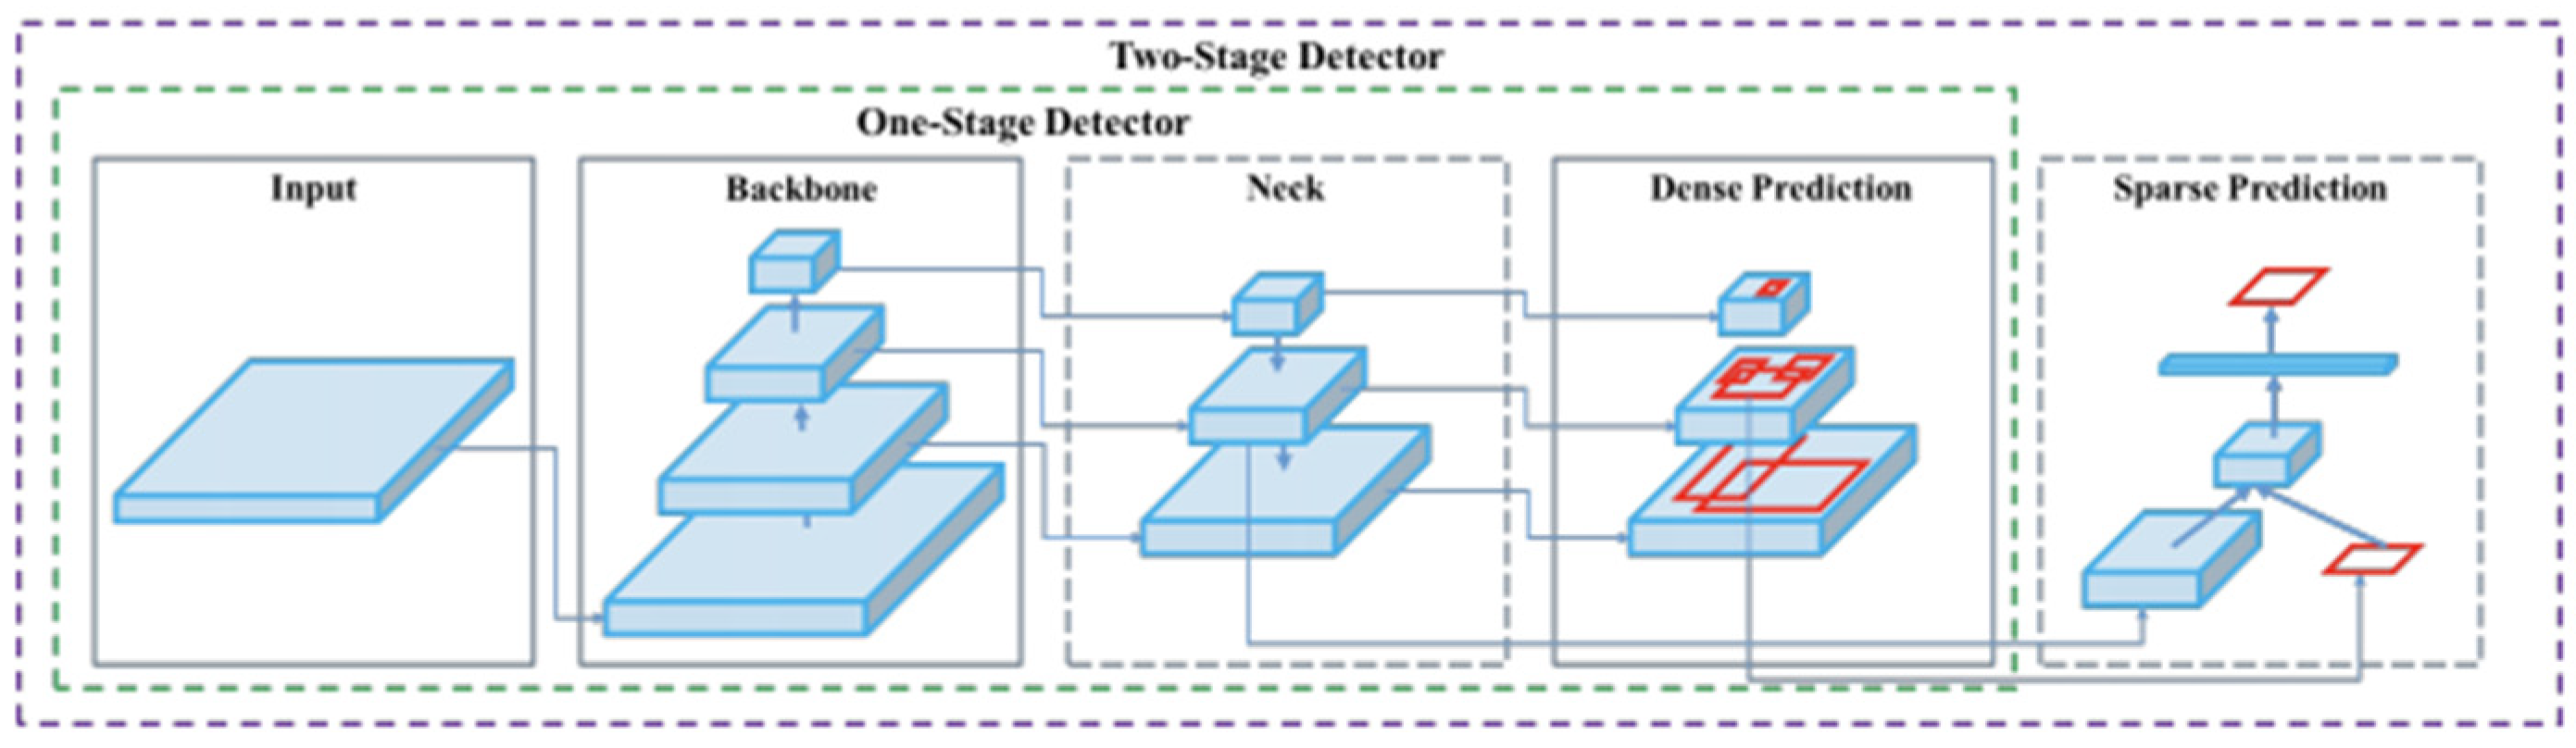
Figure 4 displays the architecture from the basic training system YOLOV4.
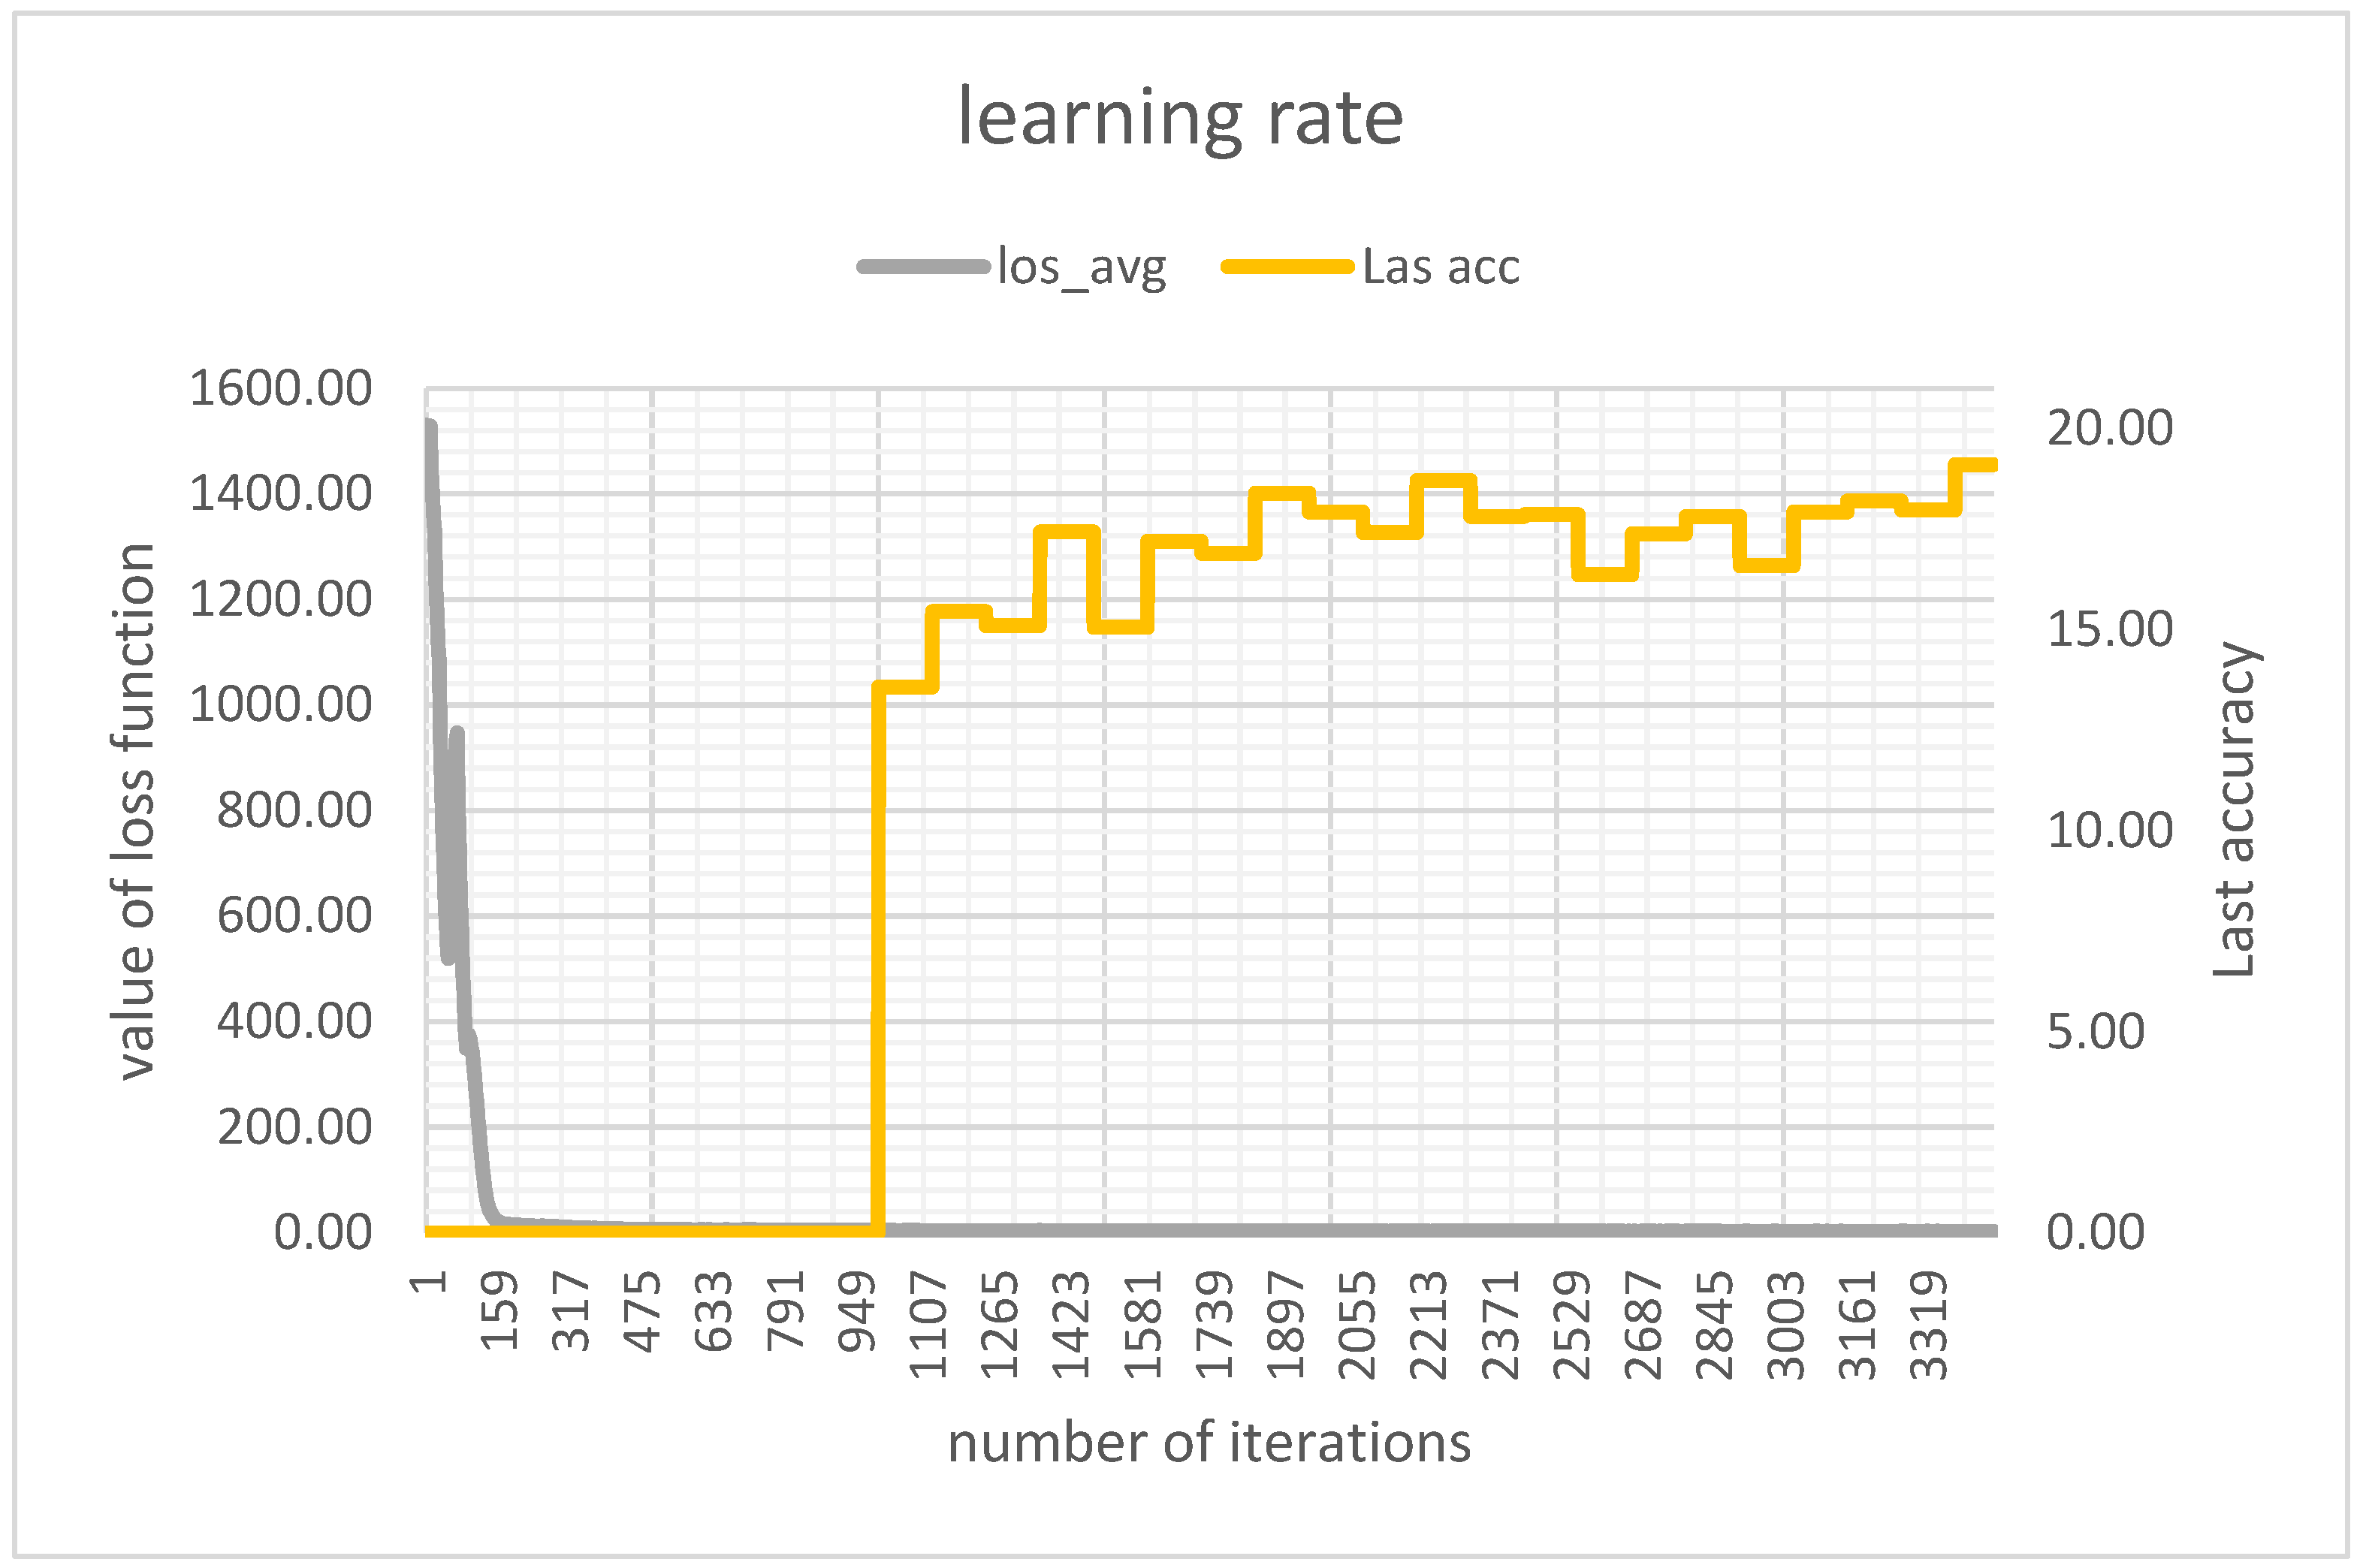
Figure 5 displays the learning rate and the process. With each iteration, weights are created, which make it possible to continue calculating with these values in further trainings. Additionally, with those weights, the use of additional GPUs becomes possible.
The yellow line shows the accuracy, and the gray line shows the learning rate. The screen displays a view step showing the iterations over the learning process.
3. Results
3.1. Data Acquisition
After the training was completed, the verification process was conducted. Therefore about 10 videos and 200 images were generated. The videos were converted into single images. In total, about 2500 images were available for the training.
3.2. Model Training
Results of the first training and subsequent test in the laboratory showed that the first training worked successfully with only a few images.
In the second training, the amount of data was multiplied to ensure better recognition of the plant. After the second training phase was finished, the next run of tests was conducted. The test images showed almost perfect results. A test run was started with a video created by a drone. The video with the plants was loaded into the system for testing, and it turned out that the result of the recognition was quite good, but the individual images worked better.
3.3. First Test after the First Training
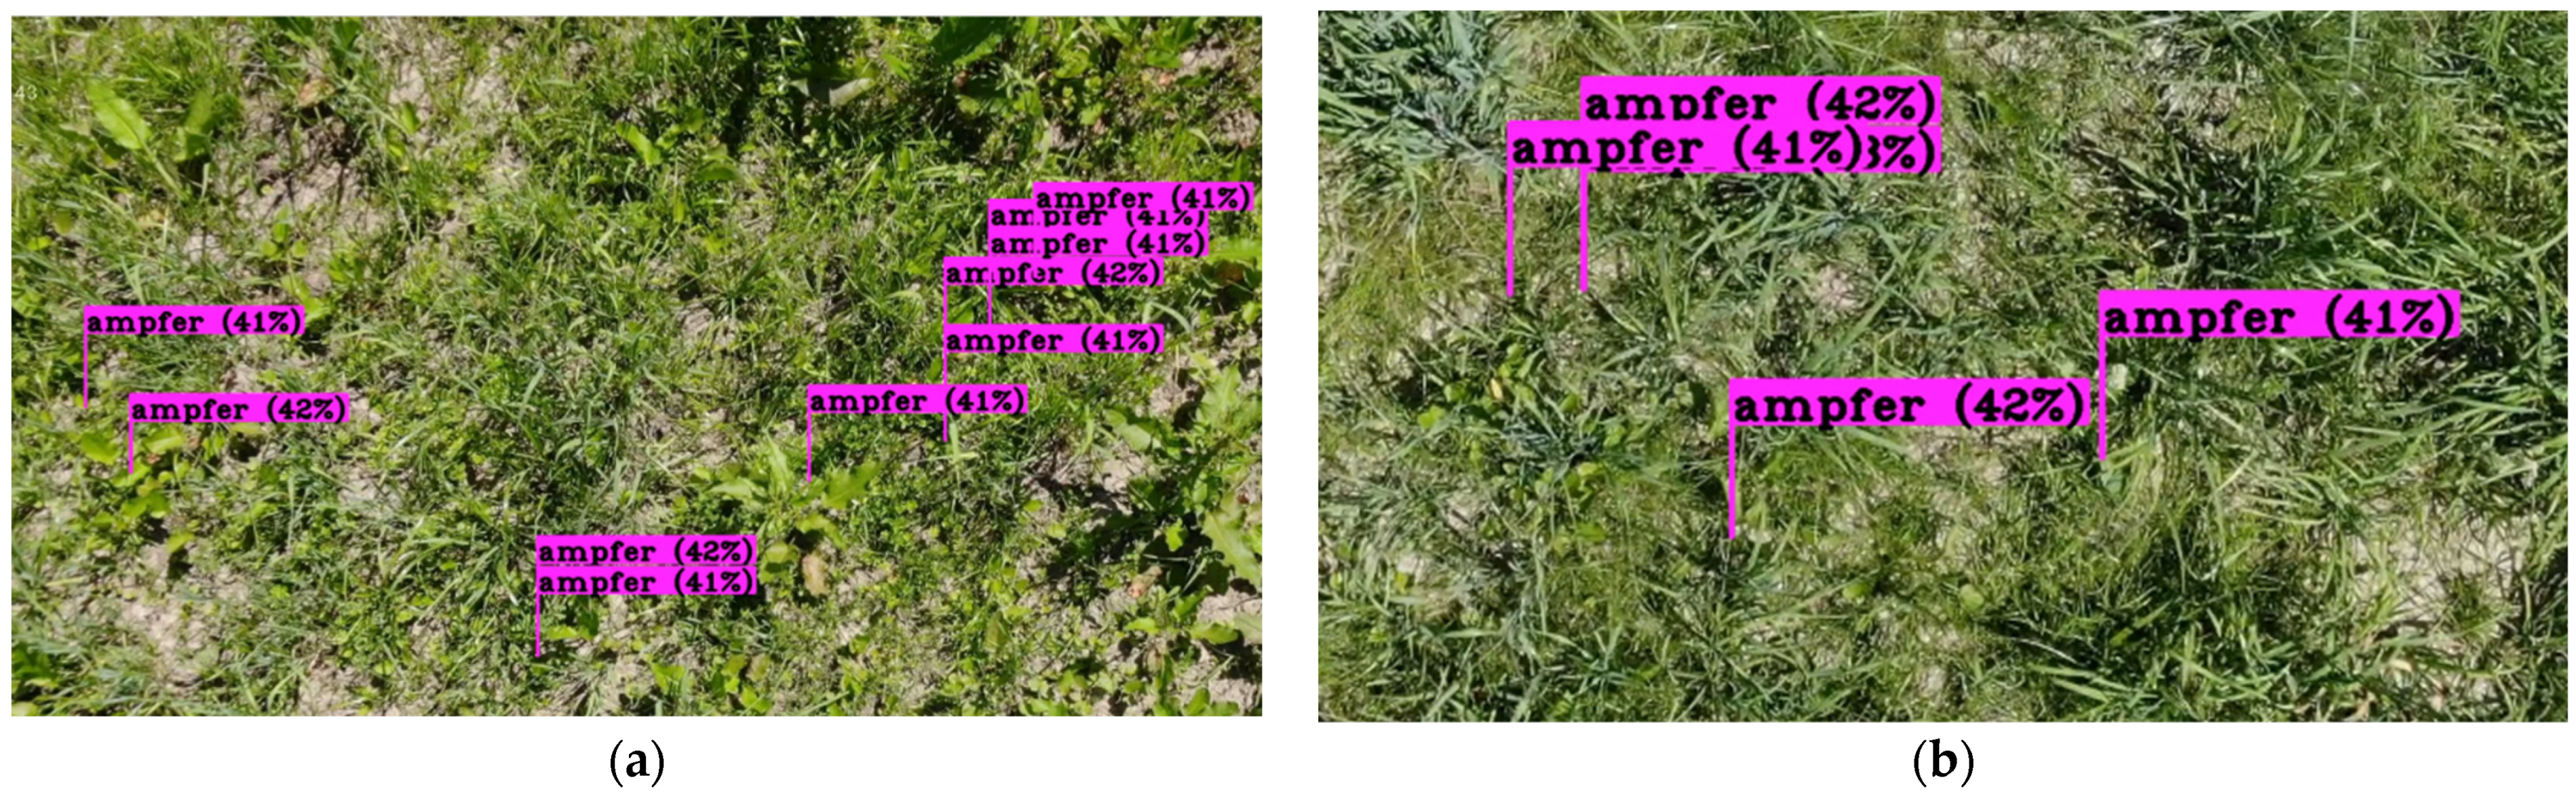
After the training and the creation of the weights, the testing phase began. For the first tests, existing recordings as well as new recordings were used. The results after the first training were very promising.
Figure 6a,b show the results. The figures are different in perspective and area.
3.4. First Test after the Second Training
For the second run, additional images and videos were recorded and processed (
n = 1500 images). The new and old images were re-evaluated. In addition, new classes were defined to allow a better detailing of the information. Due to the adjusted conditions, the training was repeated, after which another test series was started.
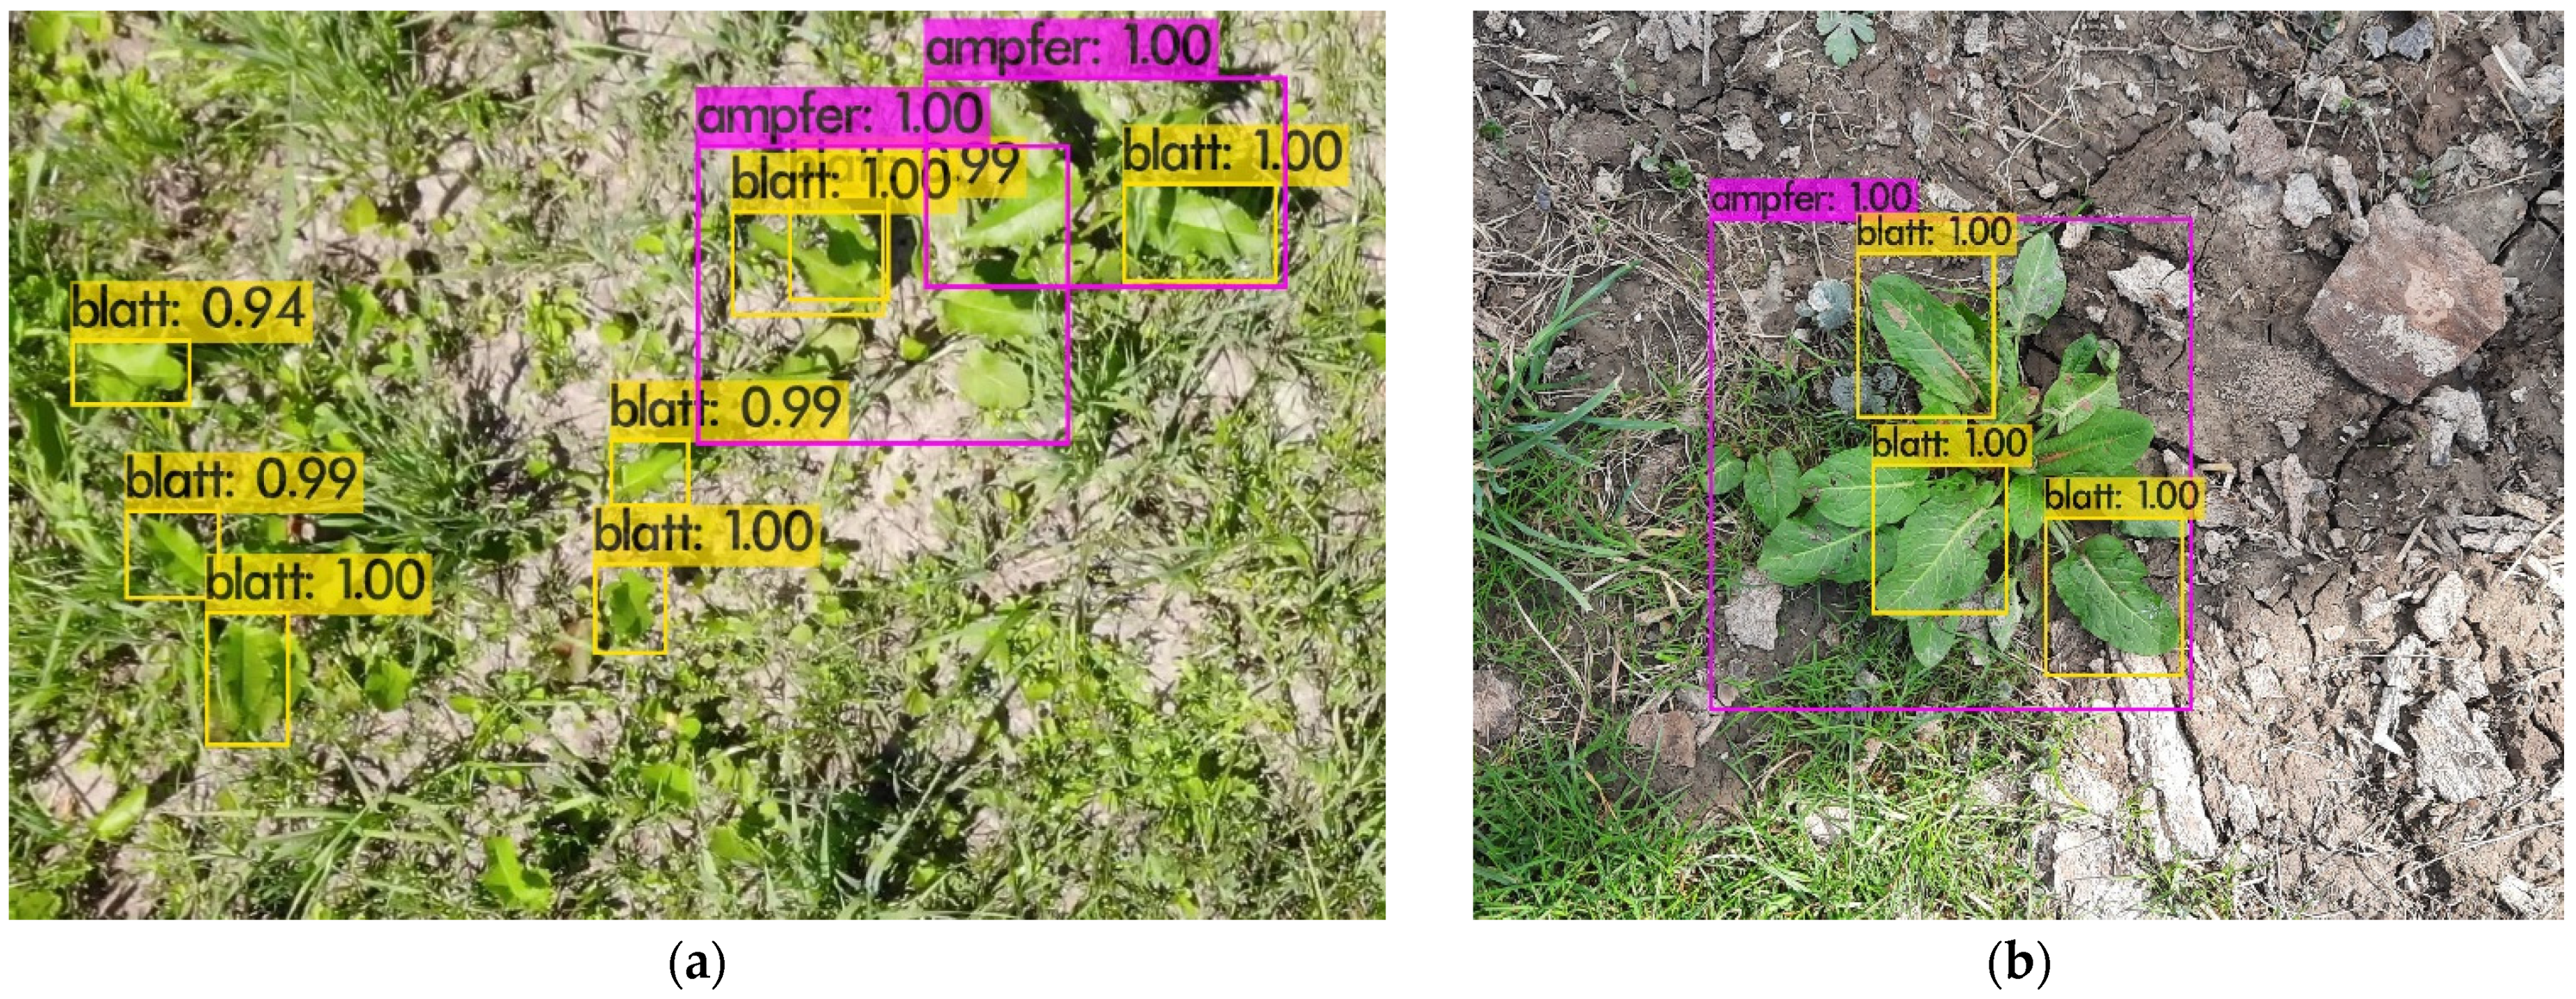
Figure 7a,b show the results. In
Figure 7b, both individual leaves and whole plants were recognized.
3.5. First Test after the Second Training
Training was conducted in two phases. In phase one, whole plant recognition was trained. In phase two, whole plant and leaf recognition was trained. Plant and leaf detection are shown in
Table 1.
4. Conclusions
The results after two trainings are very promising. Due to the decision to create our own dataset, further training is necessary to achieve perfect detection.
For the first training, we used a series of images for testing. For the second training, we used additional new material as well as existing material. After the second training was completed, tests were carried out again. Problems arose in one test scenario, the close-up images created by a drone. The problem was that the turbulence coming from the rotor blades changed the direction of the leaf of the plant. The plant leaf was twisted by the wind and therefore could no longer be identified. For future CNN training, care must be taken that leaves are recorded under various environmental conditions (e.g., windy days) to reflect natural conditions on a given day in a pasture. Further, the drone has to fly higher so there is less turbulence. For later studies, the goal is for a drone to fly autonomously over a given area and send its position to a monitoring system and to extend the CNN to multiple problematic weeds such as datura (Datura stramonium).
Table 2a and b display a short confusion matrix from the whole Rumex plant and the Rumex leaf.
Table 2c shows a short overview of the learning rate, which was about 75% of the training.
Author Contributions
Conceptualization, G.R.S., J.S., C.P.; methodology, G.R.S.; software, G.R.S.; validation, G.R.S.; investigation, G.R.S.; resources, C.P.; data curation, G.R.S.; writing—original draft preparation, G.R.S.; writing—review and editing, G.R.S., C.P.; visualization, G.R.S.; supervision, G.R.S.; project administration, G.R.S.; funding acquisition, C.P. All authors have read and agreed to the published version of the manuscript.
Funding
This research received no external funding.
Institutional Review Board Statement
Not applicable.
Informed Consent Statement
Not applicable.
Data Availability Statement
The raw data are not publicly available due to ongoing research.
Conflicts of Interest
The authors declare no conflict of interest.
References
- Zaller, J. Ecology and Non-Chemical Control of Rumex Crispus and R. obtusifolius (Polygonaceae): A Review. Weed Res. 2004, 44, 414–432. [Google Scholar] [CrossRef]
- Van Evert, F.; Cockburn, M.; Beniers, J.; Latsch, R. Weekly Defoliation Controls, but Does Not Kill Broad-Leaved Dock (Rumex obtusifolius). Weed Res. 2020, 60, 161–170. [Google Scholar] [CrossRef]
- Bochkovskiy, A.; Wang, C.-Y.; Liao, H.-Y.M. YOLOv4: Optimal Speed and Accuracy of Object Detection 2020. arXiv 2020, arXiv:200410934. [Google Scholar]
- Redmon, J.; Divvala, S.; Girshick, R.; Farhadi, A. You Only Look Once: Unified, Real-Time Object Detection. In Proceedings of the 2016 IEEE Conference on Computer Vision and Pattern Recognition, Las Vegas, NV, USA, 27–30 June 2016; pp. 779–788. [Google Scholar]
- Indolia, S.; Goswami, A.K.; Mishra, S.P.; Asopa, P. Conceptual Understanding of Convolutional Neural Network—A Deep Learning Approach. Procedia Comput. Sci. 2018, 132, 679–688. [Google Scholar] [CrossRef]
| Disclaimer/Publisher’s Note: The statements, opinions and data contained in all publications are solely those of the individual author(s) and contributor(s) and not of MDPI and/or the editor(s). MDPI and/or the editor(s) disclaim responsibility for any injury to people or property resulting from any ideas, methods, instructions or products referred to in the content. |
© 2023 by the authors. Licensee MDPI, Basel, Switzerland. This article is an open access article distributed under the terms and conditions of the Creative Commons Attribution (CC BY) license (https://creativecommons.org/licenses/by/4.0/).


