Proceeding Paper

Assessment and Monitoring of Optically Active Water Quality Parameters on Wetland Ecosystems Based on Remote Sensing Approach: A Case Study on Harike and Keshopur Wetland over Punjab Region, India †

1
Geology, Water Resources and Geoinformatics Division, Punjab Remote Sensing Centre, Ludhiana 141004, India
2
Department of Botany, Faculty of Science, The Maharaja Sayajirao University of Baroda, Vadodara 390002, India
*
Author to whom correspondence should be addressed.
Presented at the 9th International Electronic Conference on Sensors and Applications, 1–15 November 2022; Available online: https://ecsa-9.sciforum.net/.
Eng. Proc. 2022, 27(1), 84; https://doi.org/10.3390/ecsa-9-13361
Published: 1 November 2022

Abstract

:
Wetlands play a vital role in sustainable ecological development. They hold balanced environment conditions, filter the surface and sub-surface water, and moderate the local weather condition. The current study is mainly focused on assessment and monitoring of optically active water quality parameters on wetland ecosystems over the Harike and Keshopur wetlands in Punjab region, India. Sentinel-2 multispectral imager (MSI) product have been analyzed in two phases: Pre-monsoon and Post-monsoon during period from 2018 to 2021 to extract spatial and temporal variations of water quality parameters. A normalized difference water index (NDWI) has been utilized to extract the water and non-water pixels, and the semi-analytical inversion model is used to retrieve the optically water quality parameters. The images of derived chlorophyll concentrations and total suspended matter have been found ranging from 0 to 36 mg/m3 and 0 to 156 mg/m3. This study revealed that the semi-analytical model is very helpful to identify the small scale changes in optically active constituents through using multispectral imagery. Water quality parameters monitoring is an important indicator to measure the productivity and eutrophication of the river water system. This research will help in understanding the water cycle and water conditions, and is paramount to researchers, scientists, and policy makers for sustainable management. The current study also concluded that the significant reduction of highly biodiversity wetland area is required to conserve.

1. Introduction

Wetlands are among the complex, most productive ecosystems and are found at the interface between terrestrial ecosystems and waters. Wetlands play a role in the ecological systems which cover 6% of the Earth’s surface (~1280 million ha) and contain about 12% of the global carbon pool [1,2,3,4,5,6,7]. Wetlands are a major feature of the landscape in almost all parts of the Earth [7] and act as critical habitats for a variety of plants, fish, shellfish, and other forms of wildlife [8]. Despite their vital function, many wetlands are under threat and being destroyed worldwide due to climate change [7,9,10]. The climate change impacts on wetland ecosystems not only causes a loss of biodiversity but also a loss of sources of economic benefits. It may present a great challenge to conserve wetlands and will make future efforts to restore and manage wetlands more complex [11,12]. The major consequences of climate change are increased temperatures, changes in precipitation patterns, changes in quantity and quality of their water supply, increased flooding, land-use changes and emissions of greenhouses gases [4,13]. Climate change together with anthropogenic activities has changed wetland ecosystems more rapidly and extensively and has converted to industrial, agricultural, and residential use. Wetlands in India are distributed in different geographical regions and area coverage is about 58.2 million hectares (ha) which accounts for nearly 4.7% of the total geographical area and is important as repositories of aquatic biodiversity [7,14]. India lies in the tropical region, and tropical wetlands are considered highly vulnerable to climate change, as degradation seems to progress faster in wetlands than in other ecosystems. Punjab is rich in water resources, being endowed with network of rivers, canals, reservoirs, lakes, ponds, etc. that can meet a variety of water requirements of the state. The wetlands over the Punjab state (India) are unstable and climate changes are causing deterioration. The National Wetland Atlas (2011) mapped 1381 wetlands in Punjab state which covered 86,283 ha which accounted for 1.71% of the total geographical area of the region [15]. Many wetlands are under threat from developmental activities and population pressure. The decreasing water flow in perennial rivers, less rainfall in monsoon season, increasing temperature, increased soil erosion, etc. are main climate change factors that are responsible for wetland degradation over Punjab region. The largest source of water pollution in India is untreated sewage industrial effluents and injudicious use of fertilizers containing heavy metals [16] which are directly released in the water bodies to contaminant river waters with toxic elements [17]. Such threats not only affect water quality, but also human health, economic development, and social prosperity [18]. The main wetlands in the Punjab region which include the Ramsar site are Harike wetland (notified in 1990), Ropar wetland (2002), Kanjli wetland (2002), Keshopur-Miani community reserve (2020), Beas conservation reserve (2020), and Nangal wildlife sanctuary (2020). The Ramsar Convention is one of the global intergovernmental treaties which addresses the conservation and wise use of wetlands [11]. Earth observation satellites have the potential to complement conventional approaches, and a number of remote-sensing sensors and models have been utilized widely for monitoring river water surrounding the wetlands at local to global scales [19,20,21]. Sustainable use of river water involves regular efforts in field monitoring programs, decision making, and management tools [22]. This research is mainly focused on assessment and monitoring of optically active water quality parameters on wetland ecosystems over Harike and Keshopur in the Punjab region, India. Optical active water quality parameters retrieval using satellite images is now a practical way to detect such changes in the water quality and can measure the productivity and eutrophication of the river water system. It provides insights into trophic state changes, growth and spread of aquatic vegetation, the impact of natural and anthropogenic sources of pollution, and improves the water quality. This study will help study the environmental aspect and protection of the biodiversity of wetland ecosystems for future sustainability.

2. Materials and Methods

2.1. Study Area

The Punjab state extends from the latitudes 29°32′38.4″ N to 32°30′39.6″ N and longitudes 73°52′51.6″ E to 76°56′34.8″ E and occupies 50,362 sq. km. The entire state is a vast fertile alluvial plain formed by sediments transported by the major tributaries of the Indus. The three perennial rivers namely: Beas, Satluj, and Ravi, along with their tributaries, drain the state. The longest river of Punjab, the Satluj River, is a major source of water supply for irrigation, drinking, washing, bathing, etc. which originates from Manasarover Lake in Tibet, enters Punjab near Nangal, moves on to the plains, and reaches at Harike wetland before crossing over to Pakistan [23,24]. Punjab generates huge amounts of waste and such waste is disposed of into streams and rivers [25], and the same contaminated water is used for irrigation and other purposes [26]. This study mainly concerns the 2 major sites: the Harike wetland located between latitudes of 31°05′15″ to 31°40′15″ N and longitudes 74°55′30″ to 75°07′30″ E (area coverage 222 km2), and the Keshopur wetland located between latitude of 32°04′23″ to 32°06′33″ N and longitude of 75°21′6″ to 75°24′26″ E (area coverage 7.1 km2) (Figure 1). The Keshopur community reserve is a dynamic freshwater ecosystem. It sees 4500 birds every year, but 2016, it saw around 25,000 birds.

2.2. Data

This study used European Space Agency (ESA) Sentinel-2 multispectral imager data for the study of spatial and temporal pattern of optically active water quality parameters viz. chlorophyll concentration and total suspended matters during period from 2018 to 2021 over Harike and Keshopur wetlands for both seasons (Pre- and Post-monsoon). All of the Sentinel-2 datasets (2018–2021)for both seasons are downloaded from the website of Sentinel Open Access Hub (https://scihub.copernicus.eu/, accessed on 10 December 2021). The Sentinel-2 images were taken during the Pre-monsoon (April/May) and Post-monsoon (October/November) periods. Sentinel-2 MSI data is available from 2015 and is a significantly better sensor than Landsat sensors for monitoring inland river water quality.

2.3. Methods

Different methods have been developed for the extraction the water surface and vegetation from satellite images. This study used Normalized Difference Vegetation Index (NDVI) and NDWI to delineate the vegetation and water surfaces over both study areas. These are most common indices for mapping and monitoring wetland and water extent. The NDWI and NDVI equation used for Sentinel-2 images is mentioned below: NDWI = B Green B NIR B Green + B NIR and NDVI = B NIR B Red B NIR + B Red . The NDWI and NDVI values lie between −1 to 1. NDWI values greater than 0 represent water areas while values less than or equal to 0 represent non-water areas. Similarly, NDVI values greater than 0 represent vegetation areas while values less than or equal to 0 represent non-vegetation areas. The NDWI is a widely used method to delineate open water features because water bodies appear very distinct in visible and infrared wavelength due to their strong absorbability. The presented study has generated the NDWI of Harike and Keshopur wetlands for the years 2018 to 2021 during Pre- and Post-monsoon season to compute optically active water quality parameters. In this paper, we show NDWI and NDVI for the year of 2021 during both seasons (Figure 2 and Figure 3). The main limitations to study optically active water quality parameters are lack of light penetrations. A physics-based semi-analytical inversion model is used for computing water quality parameters. The water quality is determined by inherent optical properties (IOPs). The processes of light absorption and scattering governed only by water constituents are described by the IOPs. River water constituents have different spectral absorption and scattering characteristics and can change the total r r s drastically. The satellite reflectance is mainly controlled by absorption coefficient, backscattering coefficient, bottom albedo, water depth, Raman emission, fluorescence, the sun angle and output radiance. R r s = f ( a ( λ ) , b b ( λ ) , ρ ( λ ) , H , θ w , θ v , ϕ ) ; All of the collected data have been processed through MATLAB 2018a and ESRI ArcGIS 10.8.2 software for monitoring, mapping, and statistical analysis. This inversion method allows reduction in the amount and frequency of in situ data.

3. Results and Discussion

Sentinel-2 MSI imagery (2018–2021) data used to assess spatial and temporal variations of optically active water quality parameters for both seasons: Pre-monsoon and Post-monsoon seasons over Harike and Keshopur wetlands in the Punjab region (Figure 4 and Figure 5). Chlorophyll concentrations and total suspended matter is a key parameter for describing water quality of river water. Satellite derived water quality information is more representative than conventional approach due to its cost effectiveness, synoptic coverage, and regular revisit cycle in time. Monitoring of such variations is crucial to understand and disentangle the effects, and also to help model future change. Regular monitoring of optically active water quality parameters is possible with physics-based inversion methods. Empirical algorithms are only applicable to the river waters for which they were created and not applicable to other rivers because of optical complex characteristics of river water. Analytical models work equally well for different water bodies and usually perform better than the empirical models. The images of derived chlorophyll concentrations and total suspended matter have been found ranging from 0 to 36 mg/m3 and 0 to 156 mg/m3. The spatial and temporal variations of water quality parameters are associated with climatic variables such as rainfall and high runoff over the study area and the surrounding regions. The maximum, minimum, and average chlorophyll concentrations were found around 36.31, 0.01, and 29.53 mg/m3, respectively, in pre-monsoon season while 32.20, 0.01, and 29.15 mg/m3 were found in Post-monsoon season over the Harike wetland during the period from 2018 to 2021 (Table 1). Similarly, the maximum, minimum, and average chlorophyll concentrations were found around 31.46, 0.02, and 26.74 mg/m3, respectively, in Pre-monsoon season during which20.98, 0.02, and 16.90 mg/m3 were found in the Post-monsoon season over the Keshopur wetland during the period from 2018 to 2021. This study also carried out total suspended matter concentrations and the maximum, minimum, and average total suspended matters (TSM) concentrations were found around 140.01, 0.08, and 100.39 mg/m3, respectively, in Pre-monsoon season while 149.01, 0.02 and 143.09 mg/m3 were found in Post-monsoon season over the Harike wetland during the period from 2018 to 2021.Similarly, the maximum, minimum, and average TSM concentrations were found around 143.89, 0.12, and 106.54 mg/m3, respectively, in Pre-monsoon season during while 60.44, 0.03, and 41.04 mg/m3 were found in Post-monsoon season over the Keshopur wetland during the period from 2018 to 2021. Generated maps provided evidence that the lowest values of Chl-a and TSM were registered in the Post-monsoon period and Pre-monsoon periods over the Harike wetland, while the lowest values of Chl-a and TSM were recorded in Post-monsoon period over the Keshopur wetland. The average concentration of chlorophyll in Pre-monsoon season was observed to be 0.01 times higher than in Post-monsoon season over the Harike wetland, and 0.60 times higher when observed over the Keshopur wetland. Similarly, the average concentration of TSM concentration in Post-monsoon season was observed 0.4 times higher than in the Pre-monsoon season over the Harike wetland, and 1.60 times lower when observed over the Keshopur wetland. TSM concentrations over Keshopur wetlands were found to be reversed in manner. The high concentrations of TSM in Post-monsoon season were mainly occurring due to monsoon rainfall and high runoff over the Harike wetland. The rainfall in the Punjab state and surrounding areas occurs strongly during monsoon season (June to September), and therefore delivers higher loads of suspended materials and dissolved solids into the river. These materials consequently decrease the light penetration in the river water. In contrast, a map generated in Pre-monsoon season showed lowest value of TSM and less dilution mainly due to lower river runoff. Chl-a is one of the important water quality parameters which serve as a proxy variable for algae biomass and provide the basis for photosynthesis. Chl-a concentrations are characterized by strong absorption in the blue (~433 nm) and red (~686 nm) wavelengths, and high reflectance in green (~550 nm) and near-infrared (~715 nm) wavelengths [26,27,28]. TSM transport nutrients and contaminants, reduce light transmission through a water column, and influence entire aquatic ecosystems [29,30]. TSM increase the radiance emergent from the surface water in the visible and near infrared proportions of the electromagnetic spectrum, so it is promising and feasible to detect water pollutants using spectral signatures in the visible and near infrared bands. The wavelength between 700 and 800 nm are most useful for determining TSM [30]. Many researchers have reported that reflectivity in the range of 760 to 1100 nm plays an important role in the characterization of TSM. The spatio-temporal variations of TSM provide the information of ecosystem dynamics. However, retrieving water quality parameters from remote sensing data requires knowledge of its effect on the spectral signal measured by the sensor. In the visible region, most of the irradiance penetrating the water is absorbed by aquatic humus and by phytoplankton pigments. Backscattering caused by suspended particulate matter becomes the main spectral feature, causing an increase in irradiance reflectance. In the near infrared region, absorption by water increase rapidly. However, there is still significant upward irradiance from the water column caused by backscattering from suspended matter.

4. Conclusions

This study reveals that the semi-analytical model is very helpful in identifying the small scale changes in optically active constituents using high-resolution multispectral imagery. It is a realistic approach to understand behavior, measure productivity and conservation of aquatic ecosystems, and eutrophication of the river water system. Empirical models lead to overestimate and underestimate the values from one place to another. Model-based estimation of optically active water quality parameters provides a better understanding of their spatial and temporal distribution. The spatial and temporal variations of water quality parameters are associated with climatic variables, rainfall and high runoff over the study area, and the surrounding reasons. Monitoring and understanding of the water cycle and water conditions is paramount to researchers, scientists, and policy makers for sustainable management. The current study concludes that the significant reduction of highly biodiversity wetland area is required to conserve.

Author Contributions

This research article has been written by three authors: M.A., A.M., B.P. M.A. and A.M. were involving in data downloading, processing and analysis, draft preparation, review and editing. B.P. was involved in supervision, formal analysis and review. All authors have read and agreed to the published version of the manuscript.

Funding

This research received no external funding.

Institutional Review Board Statement

Not applicable.

Informed Consent Statement

Not applicable.

Data Availability Statement

This study has been used European Space Agency (ESA) developed Sentinel Sentinel-2 multispectral imagery that is publicly available at https://scihub.copernicus.eu/.

Acknowledgments

The author would like to thank the National Aeronautics and Space Administration (NASA) and European Space Agency (ESA) for providing high resolution satellite data in public domain. The anonymous reviewers and the editor are thanked for their insightful comments which helped to improve this paper.

Conflicts of Interest

The authors declare no conflict of interest.

References

  1. Carter, T.R. Assessing climate change adaptations: The IPCC guidelines. In Adapting to Climate Change; Springer: New York, NY, USA, 1996; pp. 27–43. [Google Scholar] [CrossRef]
  2. Sahagian, D.; Melack, J.; Birkett, C.; Chanton, J.; Dunne, T.; Estes, J.; Finlayson, M.; Fresco, L.; Gopal, B.; Hess, L.; et al. Global wetland distribution and functional characterizaton: Trace gases and the hydrologic cycle. In Proceedings of the Joint IGBP GAIM-DIS-BAHC-IGAC-LUCC Workshop, IGBP GAIM/IGBP Global Change, Santa Barbara, CA, USA, 16–20 May 1996; p. 45. [Google Scholar]
  3. Finlayson, C.M.; Davidson, N.C. Global Review of Wetland Resources and Priorities for Wetland Inventory; Preface iv Summary Report; Wetlands International: Wageningen, The Netherlands, 1999; p. 15. [Google Scholar]
  4. Ferrati, R.; Canziani, G.A.; Moreno, D.R. Esteros del Ibera: Hydrometeorological and hydrological characterization. Ecol. Model. 2005, 186, 3–15. [Google Scholar] [CrossRef]
  5. Junk, W.J.; An, S.; Finlayson, C.M.; Gopal, B.; Květ, J.; Mitchell, S.A.; Mitsch, W.J.; Robarts, R.D. Current state of knowledge regarding the world’s wetlands and their future under global climate change: A synthesis. Aquat. Sci. 2013, 75, 151–167. [Google Scholar] [CrossRef] [Green Version]
  6. Barros, D.F.; Albernaz, A.L. Possible impacts of climate change on wetlands and its biota in the Brazilian Amazon. Braz. J. Biol. 2014, 74, 810–820. [Google Scholar] [CrossRef] [PubMed]
  7. Singh, S.; Chakraborty, S. Performance of organic substrate amended constructed wetland treating acid mine drainage (AMD) of North-Eastern India. J. Hazard. Mater. 2020, 397, 122719. [Google Scholar] [CrossRef] [PubMed]
  8. Klemas, V. Remote sensing of wetlands: Case studies comparing practical techniques. J. Coast. Res. 2011, 27, 418–427. [Google Scholar]
  9. Sivakumar, R.; Ghosh, S. Wetland spatial dynamics and mitigation study: An integrated remote sensing and GIS approach. Nat. Hazards 2016, 80, 975–995. [Google Scholar] [CrossRef]
  10. Kundapura, S.; Kommoju, R.; Verma, I. Assessment of changes in wetland storage in Gurupura River Basin of Karnataka, India, using remote sensing and GIS techniques. InWater Resources and Environmental Engineering II; Springer: Singapore, 2019; pp. 57–68. [Google Scholar]
  11. Erwin, K.L. Wetlands and global climate change: The role of wetland restoration in a changing world. Wetl. Ecol. Manag. 2009, 17, 71–84. [Google Scholar] [CrossRef]
  12. Hulme, P.E. Adapting to climate change: Is there scope for ecological management in the face of a global threat? J. Appl. Ecol. 2005, 42, 784–794. [Google Scholar] [CrossRef]
  13. Solomon, S. IPCC (2007): Climate change the physical science basis. In Proceedings of the AGU Fall Meeting Abstracts, San Francisco, CA, USA, 10–14 December 2007; Volume 2007, p. U43D-01. [Google Scholar]
  14. Prasad, S.N.; Ramachandra, T.V.; Ahalya, N.; Sengupta, T.; Kumar, A.; Tiwari, A.K.; Vijayan, V.S.; Vijayan, L. Conservation of wetlands of India-a review. Trop. Ecol. 2002, 43, 173–186. [Google Scholar]
  15. Bassi, N.; Kumar, M.D.; Sharma, A.; Pardha-Saradhi, P. Status of wetlands in India: A review of extent, ecosystem benefits, threats and management strategies. J. Hydrol. Reg. Stud. 2014, 2, 1–19. [Google Scholar] [CrossRef] [Green Version]
  16. Sharma, S.; Nagpal, A.K.; Kaur, I. Heavy metal contamination in soil, food crops and associated health risks for residents of Ropar wetland, Punjab, India and its environs. Food Chem. 2018, 255, 15–22. [Google Scholar] [CrossRef] [PubMed]
  17. Li, L.; Geng, S.; Wu, C.; Song, K.; Sun, F.; Visvanathan, C.; Xie, F.; Wang, Q. Microplastics contamination in different trophic state lakes along the middle and lower reaches of Yangtze River Basin. Environ. Pollut. 2019, 254, 112951. [Google Scholar] [CrossRef] [PubMed]
  18. Kumar, M.D.; Shah, Z.; Mukherjee, S.; Mudgerikar, A. Water, human development and economic growth: Some international perspectives. In Proceedings of the IWMI-Tata Water Policy Research Program’s Seventh Annual Partners’ Meet, ICRISAT, Hyderabad, India, 2 April 2008. [Google Scholar]
  19. Palmer, S.C.; Kutser, T.; Hunter, P.D. Remote sensing of inland waters: Challenges, progress and future directions. Remote Sens. Environ. 2015, 157, 1–8. [Google Scholar] [CrossRef] [Green Version]
  20. Garg, V.; Eslamian, S. Monitoring, assessment, and forecasting of drought using remote sensing and the geographical information system. In Handbook of Drought and Water Scarcity; CRC Press: Boca Raton, FL, USA, 2017; pp. 217–252. [Google Scholar]
  21. Bonansea, M.; Ledesma, M.; Rodriguez, C.; Pinotti, L. Using new remote sensing satellites for assessing water quality in a reservoir. Hydrol. Sci. J. 2019, 64, 34–44. [Google Scholar] [CrossRef]
  22. Giardino, C.; Brando, V.E.; Dekker, A.G.; Strömbeck, N.; Candiani, G. Assessment of water quality in Lake Garda (Italy) using Hyperion. Remote Sens. Environ. 2007, 109, 183–195. [Google Scholar] [CrossRef]
  23. Sharma, R.; Patel, S.; Litoria, P.K.; Pateriya, B. Changes in river channel dynamics of the Satluj river, Punjab: Using a geospatial approach. J. Geol. Soc. India 2022, 98, 1283–1289. [Google Scholar] [CrossRef]
  24. Setia, R.; Dhaliwal, S.S.; Kumar, V.; Singh, R.; Kukal, S.S.; Pateriya, B. Impact assessment of metal contamination in surface water of Sutlej River (India) on human health risks. Environ. Pollut. 2020, 265, 114907. [Google Scholar] [CrossRef]
  25. Alamdar, R.; Kumar, V.; Moghtaderi, T.; Naghibi, S.J. Groundwater quality evaluation of Shiraz City, Iran using multivariate and geostatistical techniques. SN Appl. Sci. 2019, 1, 1367. [Google Scholar] [CrossRef] [Green Version]
  26. Gitelson, A. The peak near 700 nm on radiance spectra of algae and water: Relationships of its magnitude and position with chlorophyll concentration. Int. J. Remote Sens. 1992, 13, 3367–3373. [Google Scholar] [CrossRef]
  27. Kirk, J.T. Light and Photosynthesis in Aquatic Ecosystems; Cambridge University Press: Cambridge, UK, 1994. [Google Scholar]
  28. Mobley, C.D. Light and Water: Radiative Transfer in Natural Waters; Academic Press: San Francisco, CA, USA, 1994. [Google Scholar]
  29. Dihkan, M.; Karsli, F.; Guneroglu, A. Mapping total suspended matter concentrations in the Black Sea using Landsat TM multispectral satellite imagery. Fresenius Environ. Bull. 2011, 20, 262–269. [Google Scholar]
  30. Zheng, Z.; Li, Y.; Guo, Y.; Xu, Y.; Liu, G.; Du, C. Landsat-based long-term monitoring of total suspended matter concentration pattern change in the wet season for Dongting Lake, China. Remote Sens. 2015, 7, 13975–13999. [Google Scholar] [CrossRef]
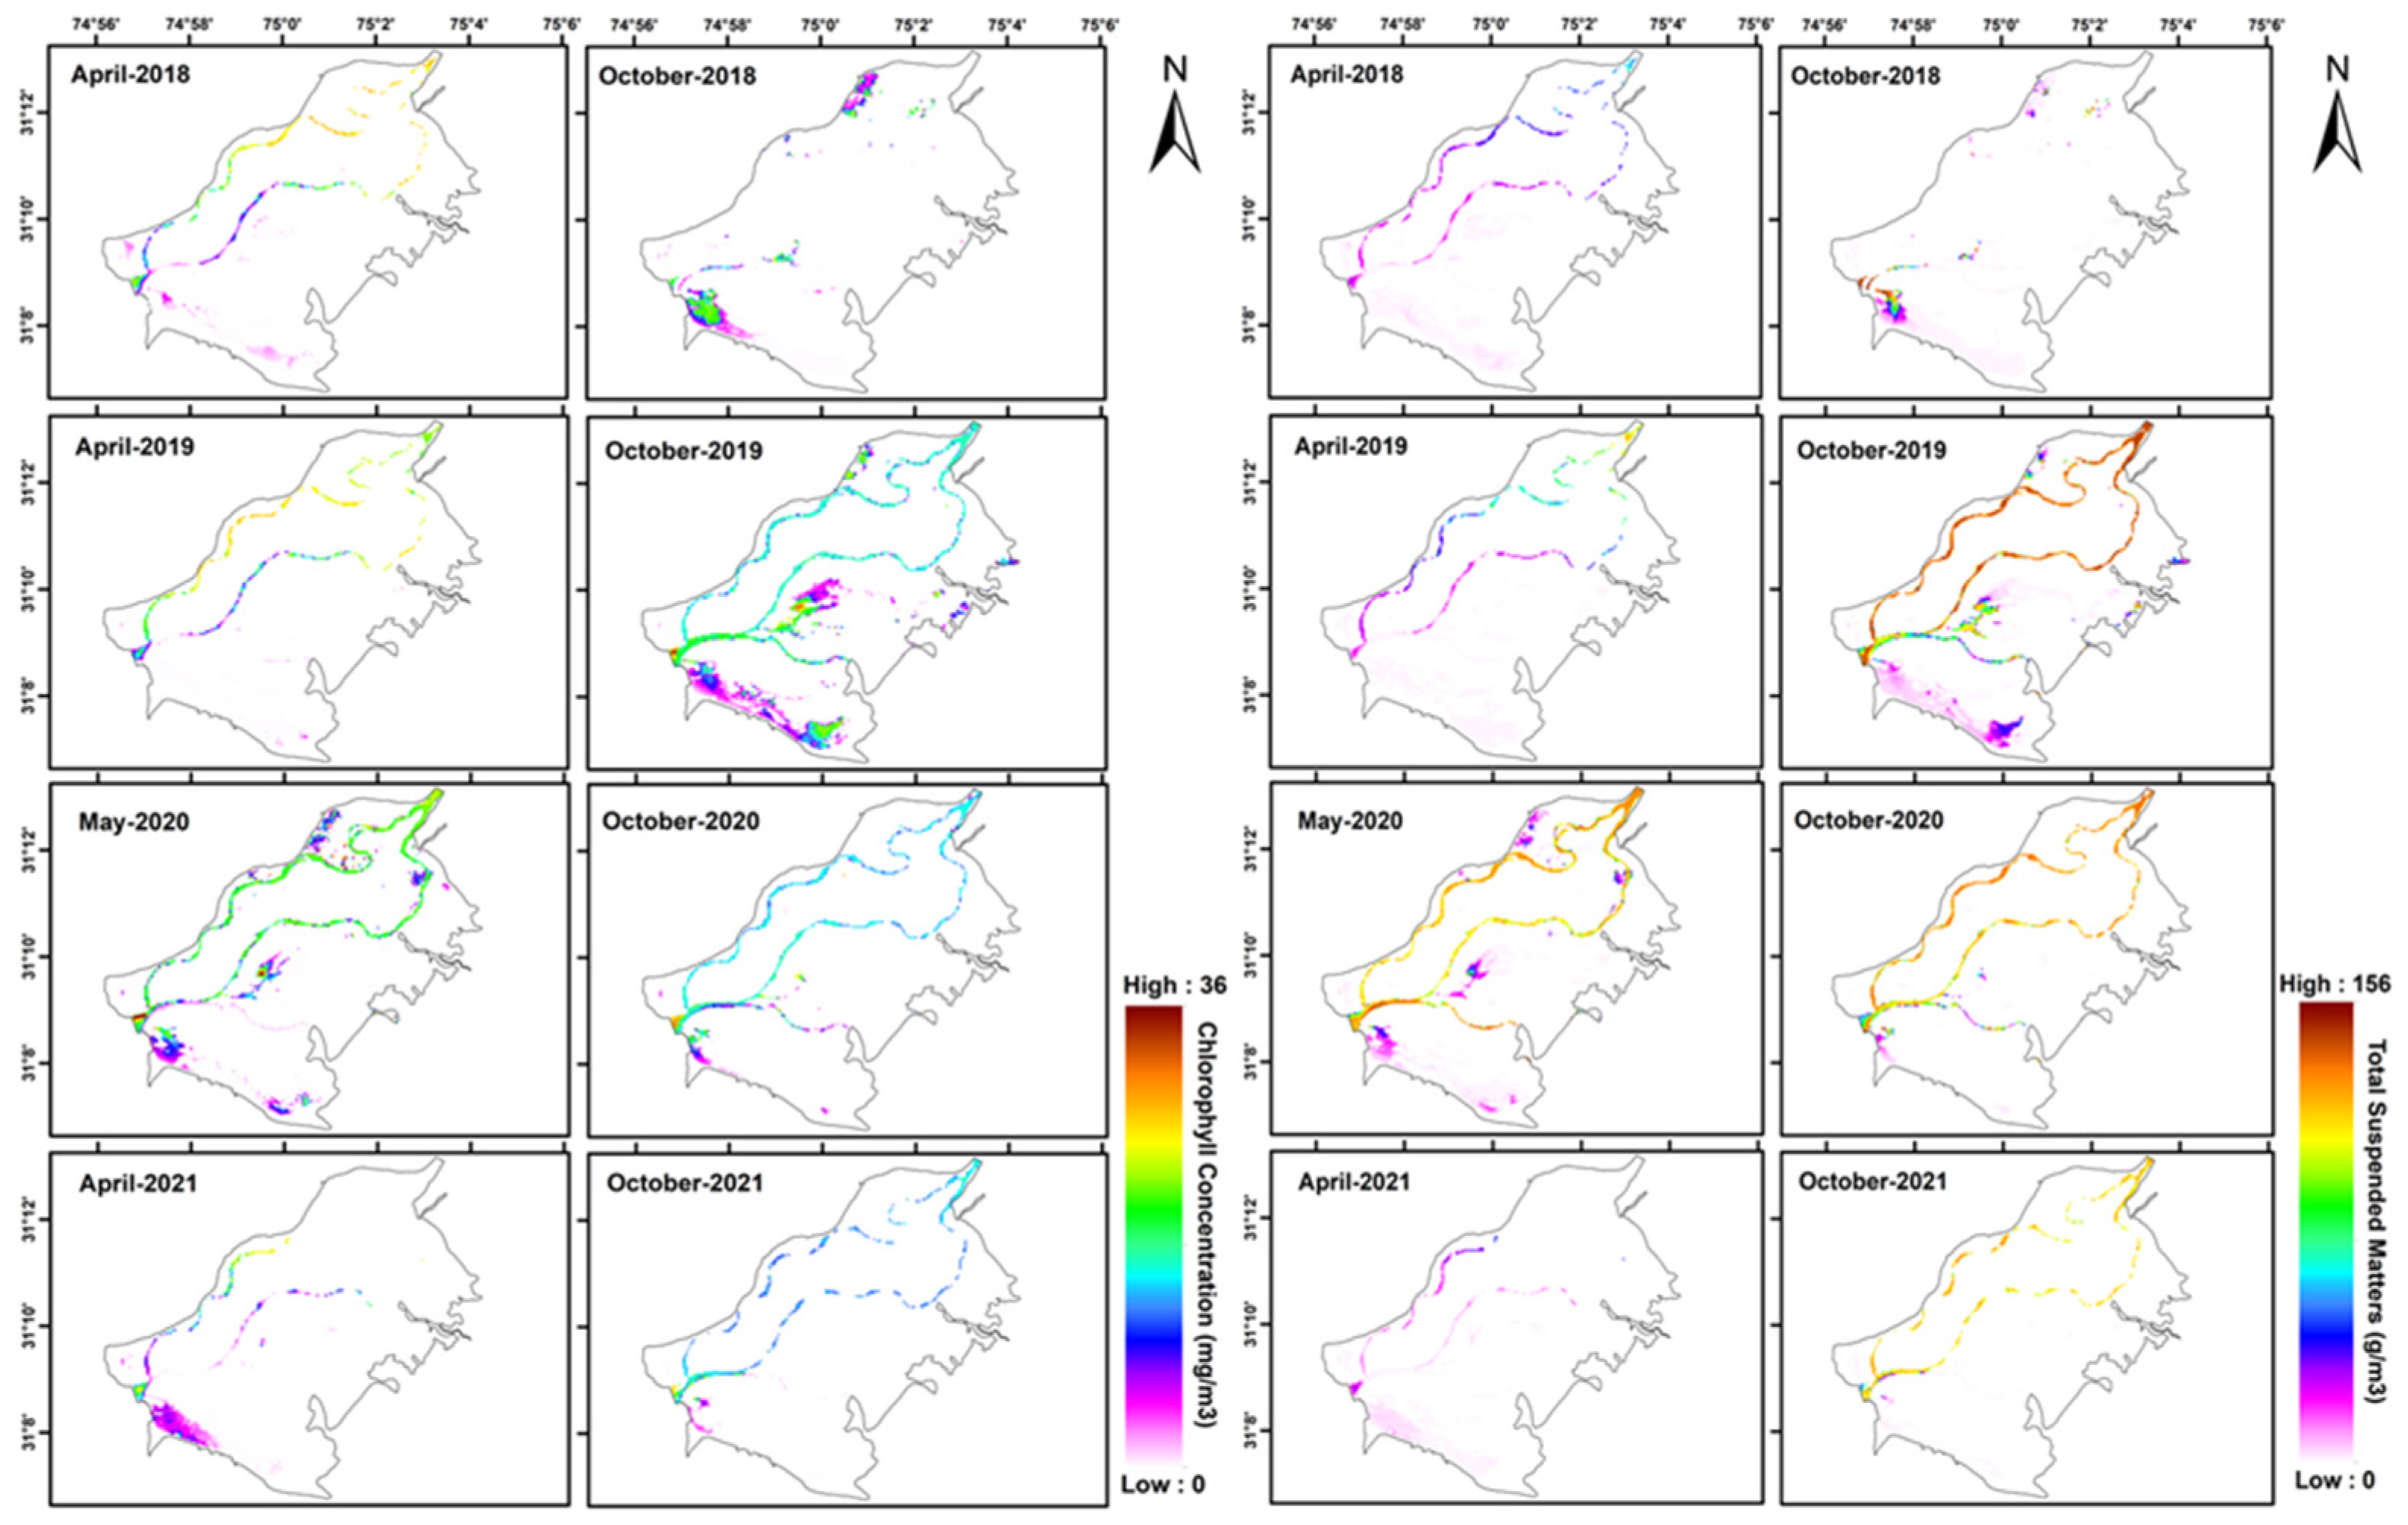
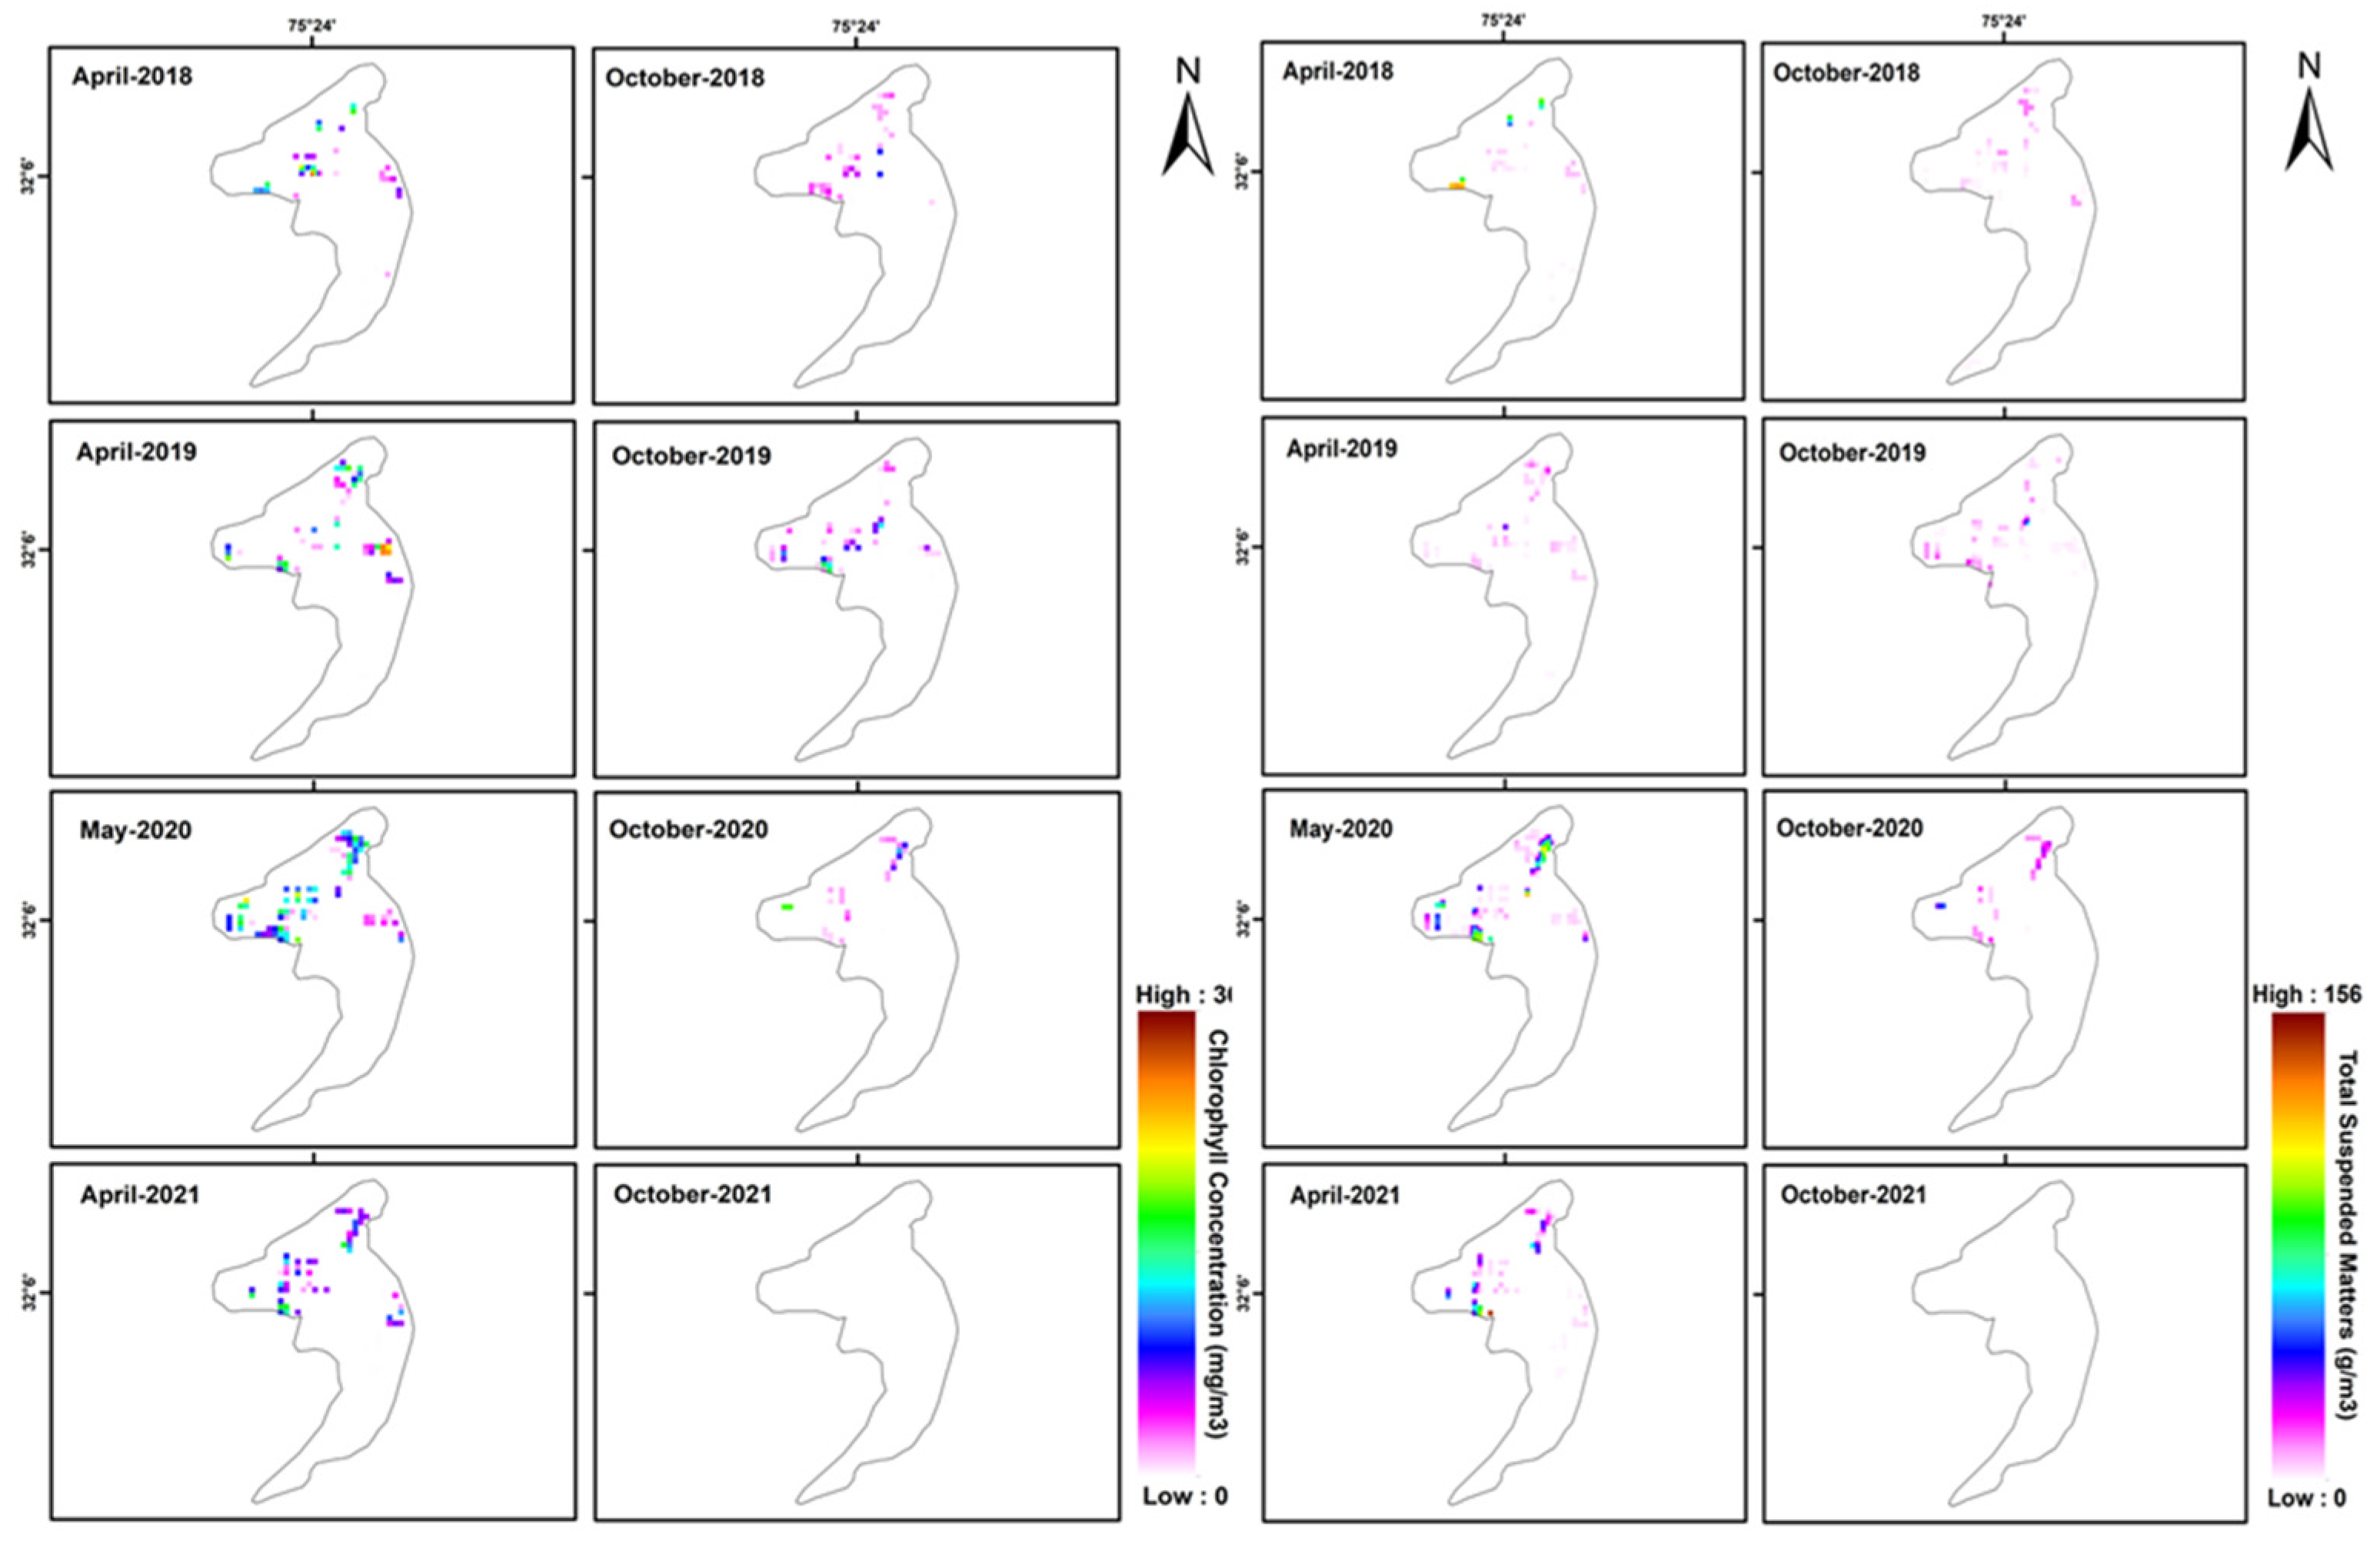
Figure 1. Locations of study where sentionel-2 MSI data acquired during pre- and post-monsoon season.
Engproc 27 00084 g001
Figure 2. Spatial Variations of Normalised Difference Water Index (NDWI) and Normalised Difference Vegetation Index (NDVI) over Harike Wetland for year 2021 during pre- and post-monsoon season.
Engproc 27 00084 g002
Figure 3. Spatial Variations of Normalised Difference Water Index (NDWI) and Normalised Difference Vegetation Index (NDVI) over Keshopur Wetland for year 2021 during pre- and post-monsoon season.
Engproc 27 00084 g003
Figure 4. Spatial and temporal variations of chlorophyll concentration (left side) and total suspended matter (right side) over Harike during Pre- and Post-monsoon season from 2018 to 2021.
Engproc 27 00084 g004
Figure 5. Spatial and temporal variations of chlorophyll concentration (left side) and total suspended matter (right side) over Keshopur during Pre- and Post-monsoon season from 2018 to 2021.
Engproc 27 00084 g005
Table 1. Chlorophyll and total suspended matter range derived from Sentinel-2 satellite data during both seasons (Pre- and Post-monsoon) over Harike and Keshopur wetland.
SeasonsDate of Acquired DataChlorophyll Concentration Range (mg/m3)Total Suspended Matter (g/m3)Chlorophyll Concentration Range (mg/m3)Total Suspended Matter (g/m3)
Harike Keshopur
Pre-Monsoon18-Apr-180.01–28.210.08–77.860.09–31.460.16–126.74
23-Apr-190.01–27.660.08–126.490.03–29.940.12–34.07
22-May-200.01–36.310.08–140.010.06–25.740.27–121.46
12-Apr-210.01–25.920.09–57.190.02–19.830.12–143.89
Post-Monsoon05-Oct-180.01–28.570.03–149.010.01–10.930.03–13.35
10-Oct-190.01–32.200.02–145.540.02–18.780.03–60.44
09-Oct-200.01–29.520.06–141.820.03–20.980.13–49.35
09-Oct-210.02–26.310.03–136.00NilNil
Publisher’s Note: MDPI stays neutral with regard to jurisdictional claims in published maps and institutional affiliations.

