1. Introduction
Traditional manufacturing processes, such as forging, welding, casting and turning, which were marked by the industrial revolution, have brought countless benefits to the world over the years. However, science and practitioners have always been in search of faster processes with a higher level of accuracy, which has paved the way for a new type of process, such as additive manufacturing (AM). As one of the pillars of the fourth industrial revolution, AM has arrived to transform the way products are manufactured.
The most widely used and rapidly growing AM technologies are extrusion deposition processes, such as fused deposition modeling (FDM), fused filament fabrication (FFF) and melt extrusion manufacturing (MEM) [
1]. While the use of AM has been increasing, many challenges, such as an insufficient level of product quality, the robustness of material properties and controllability, impair its more extensive adoption and commercialization [
1,
2].
AM process monitoring is of utmost importance in detecting defects and providing feedback for process control, and is crucial to further understanding the processes, improving process efficiency and quality, and producing parts with the desired quality. Therefore, there is a strong need to develop sensor-based monitoring methods to overcome some of these challenges, as process monitoring has proved its effectiveness in numerous other manufacturing technologies [
1,
2,
3].
Some research works on AM process monitoring based on sensors can be found, which used a filament feed speed sensor, borescope camera, MEMS accelerometer, thermocouple and IR temperature sensor [
4], and an acoustic emission (AE) sensor [
1,
2,
3]. However, the use of an AE sensor is more attractive for monitoring the AM process, since the signals are sensitive to the changes of machine and extruded material dynamics during the fabrication process, and the sensor usually has a wider range of operating frequencies than other dynamic sensors (e.g., accelerometer) [
2].
Therefore, this work conducted a study on the acoustic emission signals in the time-domain—raw and root mean square (RMS) values—regarding their behavior during the manufacture of a single layer part in the FFF process for two infill patterns. No research work was found on the study of the behavior of AE signals, or raw and RMS values, during first layer fabrication for two distinct infill patterns. The contribution of this paper is to provide additional information about the AE signals, regarding FFF process monitoring with the use of an AE sensor, to the research community and engineers in the AM field, and thus assist in a better understanding of the process as well as its optimization.
2. Materials and Methods
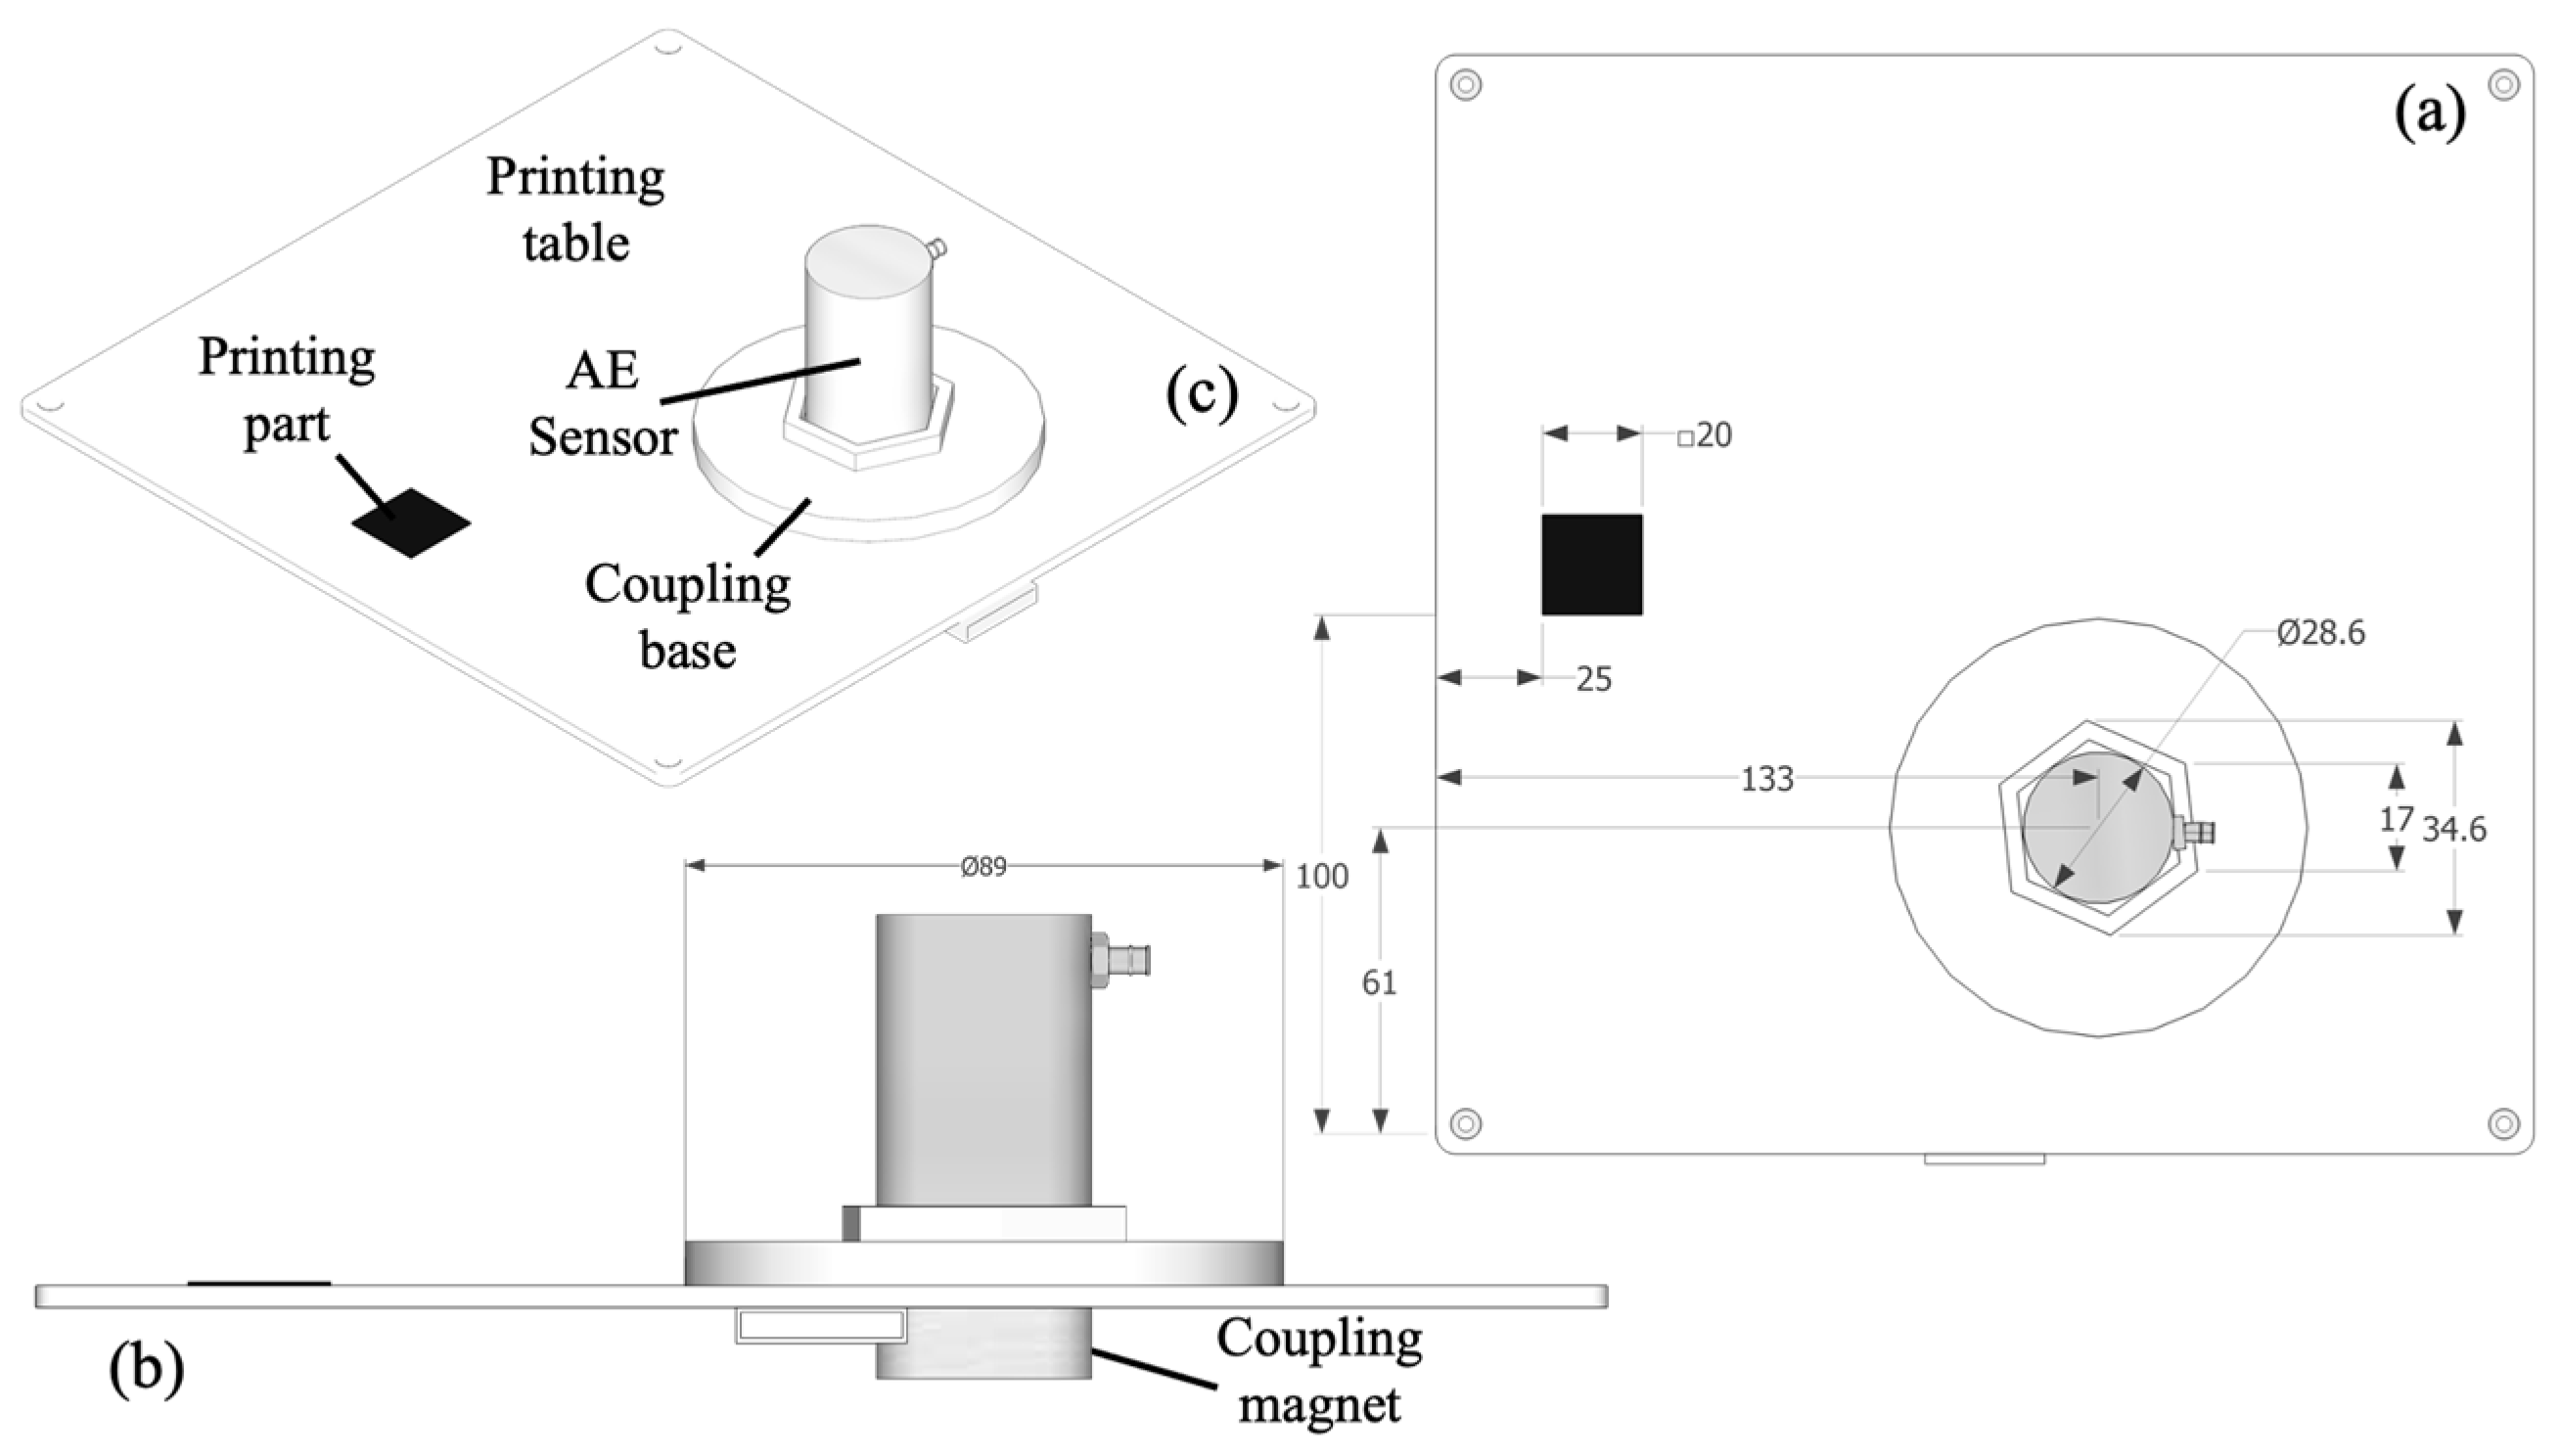
The tests were conducted in a GTMax3D, Graber i3 model Cartesian 3D printer. This model is equipped with a MK2B Dual Power PCB table, as well as an NTC 100k thermistor temperature sensor connected to a 200 × 200 × 3 mm glass plate, and a HotEnd All-Metal GTMax3D model extruder. The following parameters were used: nozzle temperature 190 °C, bed temperature 65 °C, layer height of 300 μm, nozzle diameter of 0.4 mm, fill density of 20%, printing speed of 20 mm/s.
The deposition movement produced by the Graber i3 3D printer is achieved by movement relative to tracks running along the axes. For printing exclusively along the x-axis, only the extruder moves, and for exclusively along the y-axis, only the printing table moves. Consequently, for printing utilizing the x and y axes simultaneously, both the printing extruder and table move.
An AE Physical Acoustics, R.451 model sensor, with a frequency response of 1 Hz to 20 kHz, was fixed by means of a magnetic base at 133 × 61 mm from the lower left corner of the printing table. To allow coupling between the magnetic base and the glass table, a neodymium magnet was positioned under the printing table.
The glass table temperature was controlled by the heating system of the printer via the Repetier-Host software. A square part of 20 × 20 × 0.3 mm was designed in three dimensions using the SketchUp software, which was printed at 25 × 100 mm from the lower left corner of the printing table. The polylactic acid (PLA) was the printing material used with a filament width of 1.75 mm.
Figure 1 shows the square part in the defined printing position, and the AE sensor fixed through the magnetic coupling base to the printing table.
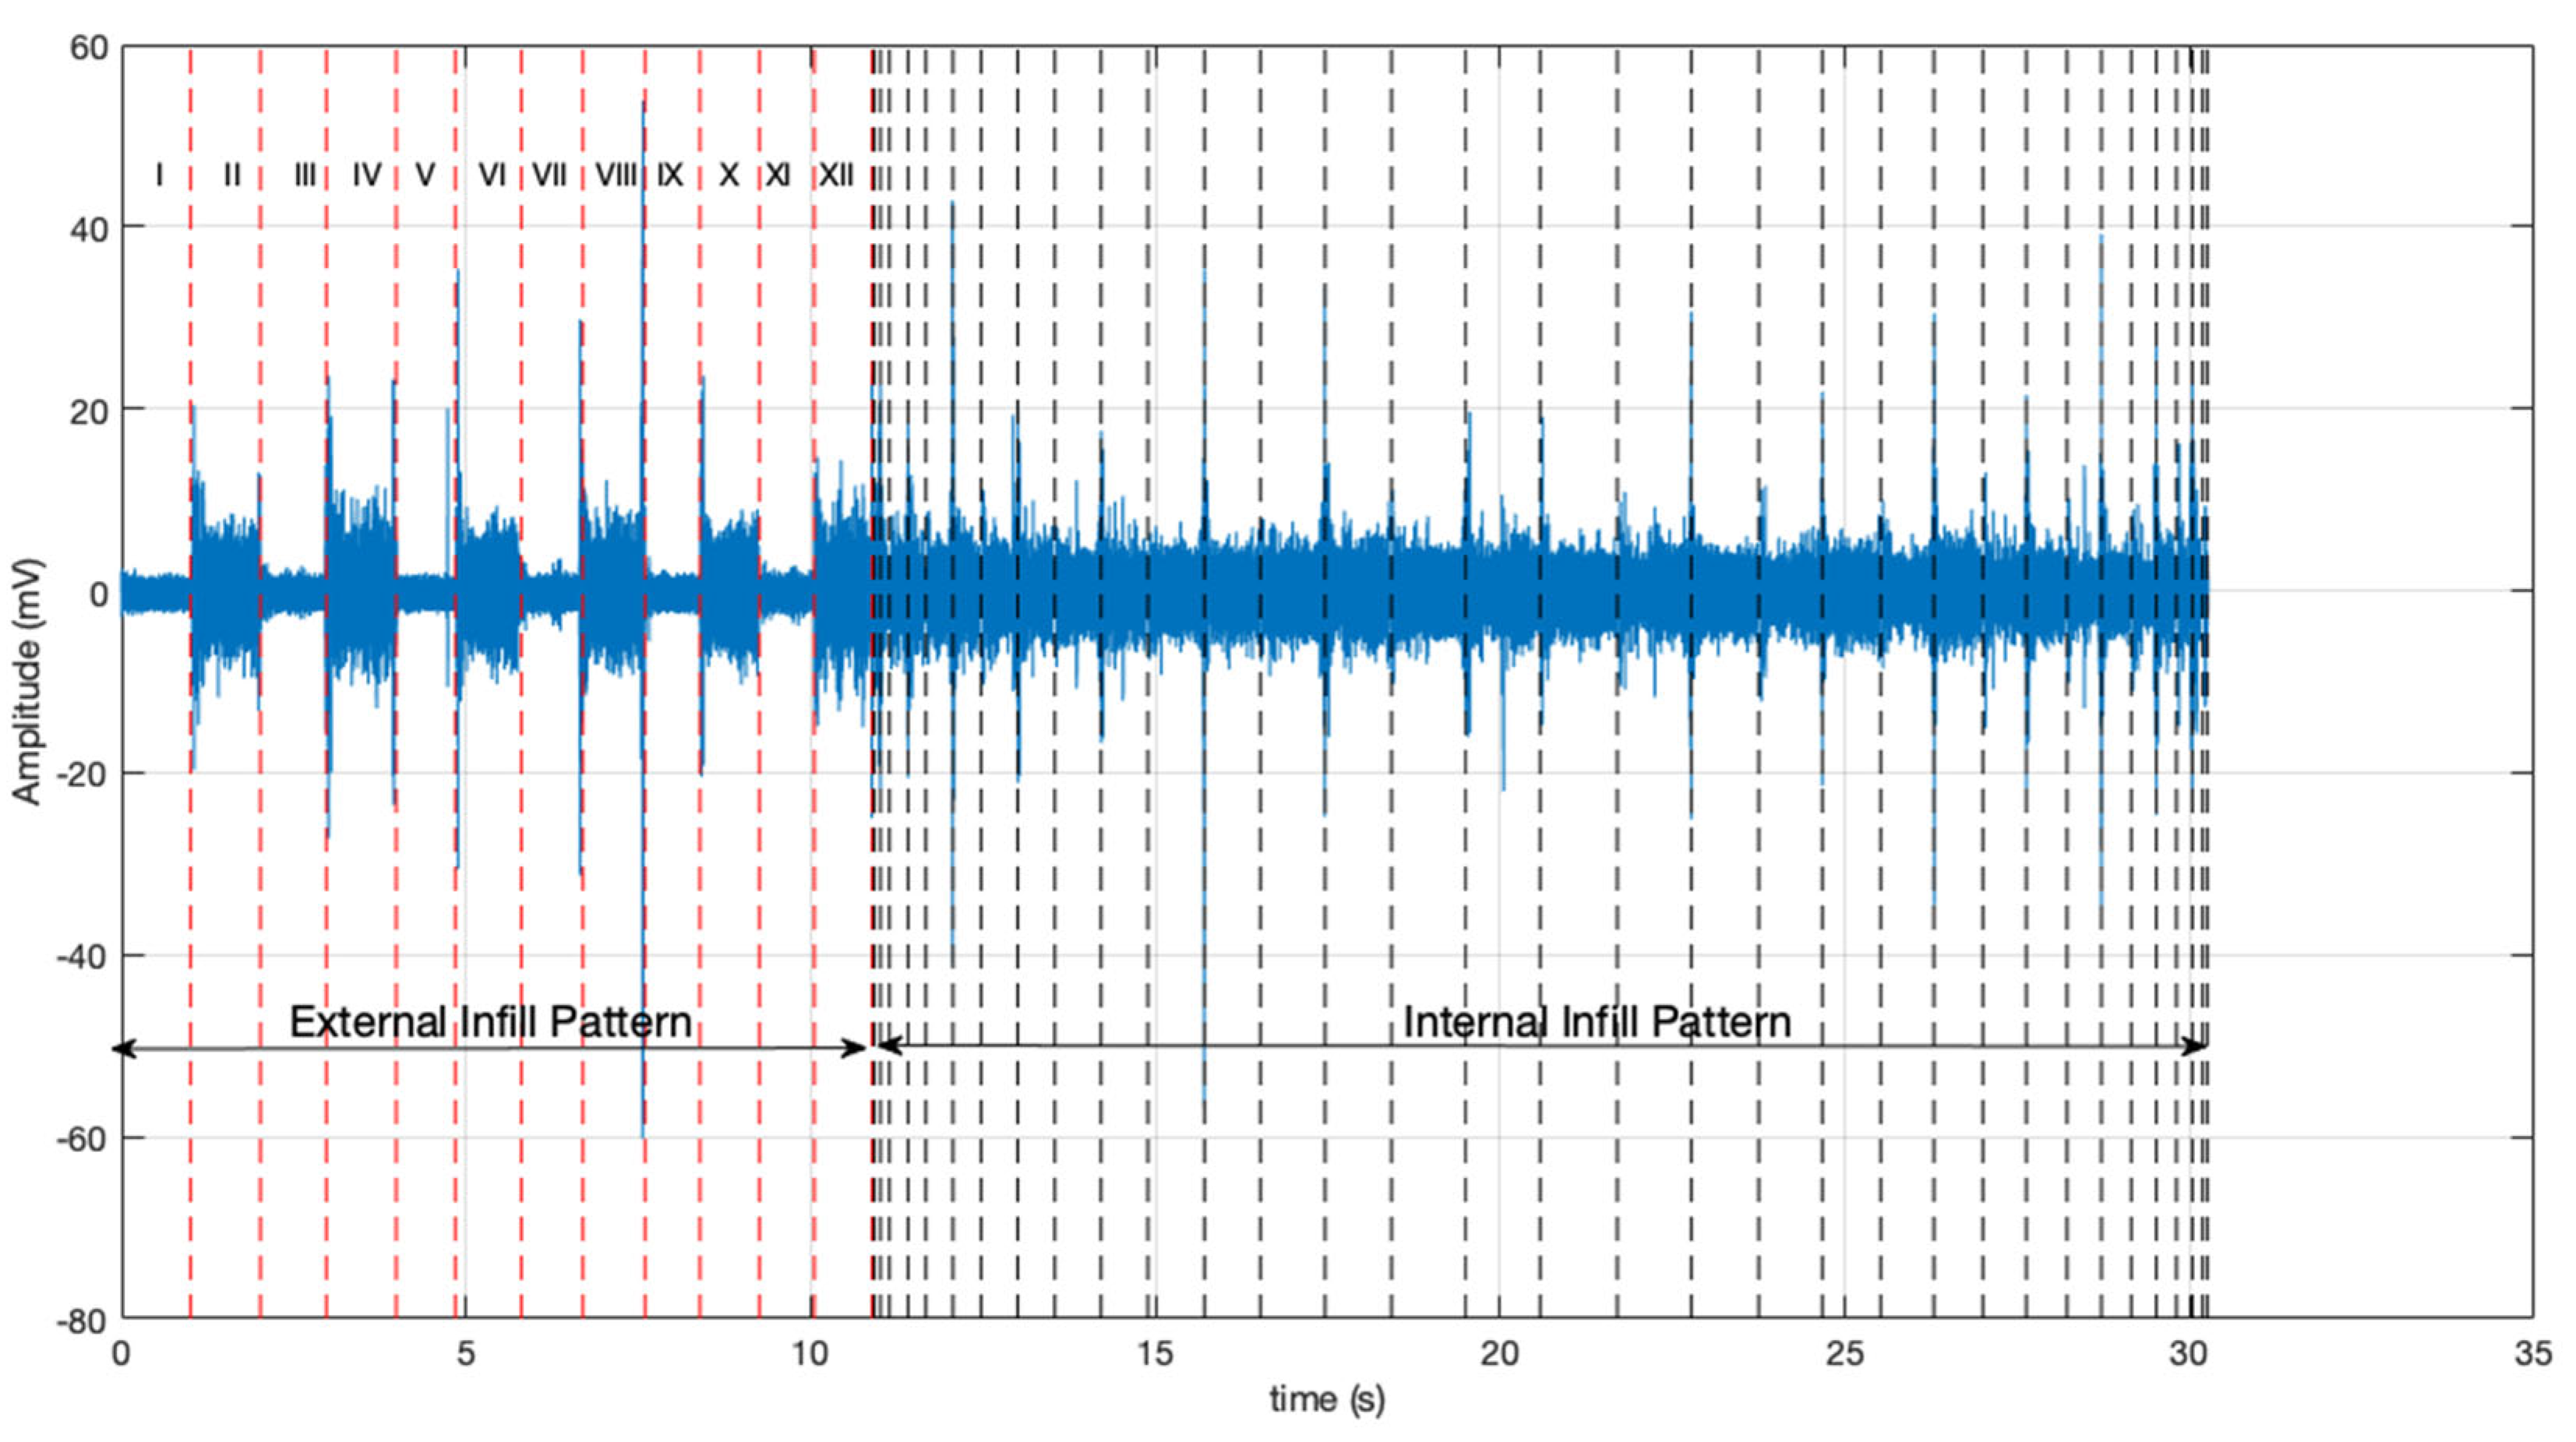
The fabrication parameters were the default values of the Slic3r software, which is part of the Repetier-Host software. The single layer part consisted of two infill patterns, as shown in
Figure 2.
The external infill pattern (EIP) was used for the fabrication of the external lines, following the movement of the extruder or table at an angle of 0, 90, 180 and 270°, while the internal infill pattern (IIP), which started after the EIP had completed, was used for the fabrication of the internal lines, following the directions determined by the 45° raster angle for both extruder and table movements. The external and internal printing patterns were composed of 12 and 32 lines, respectively.
The printing process of the part was repeated three times to ensure the consistency and reliability of the measurements. The Yokogawa DL850 oscilloscope was used to collect AE signals throughout the printing process at a sample frequency of 1 MHz; the data was captured and stored on the oscilloscope internal hard drive. The data was digitally processed after the tests using the Matlab software. The printing processes were recorded with the use of a Motorola smartphone, model Moto G5SPlus in order to help in identifying the times of each printing cycle.
The raw AE signals were truncated in order to obtain only the segments (lines) extracted regarding each infill pattern. The RMS values were computed for each segment for further analysis. The integration time of 1ms for RMS computation was used. The average RMS and standard deviation values for each segment were then computed. The integration time of 1 ms was adopted, based on Reference [
5].
3. Results and Discussion
The raw AE signals are shown in
Figure 3. The vertical dashed lines in this figure represent the segment fabricated for each pattern, which were found by using the video recorded during the fabrication as well as the RMS signal. From a macro perspective, it can be observed clearly for the EIP the great difference in AE amplitudes between the odd (x-axis) and even (y-axis) segments of the signal along the entire fabrication of this infill pattern. This can be explained by recalling
Section 2, where it was described that in the x-direction only the extruder moves, whereas in the y-axis only the table moves. There were two step motors of the same specification in charge of these movements. On the other hand, it was known and clearly noticeable that the step motor of the extruder mechanism had a much lighter load than the step motor of the table mechanical apparatus. According to [
6], the main source of acoustics is the vibration of the step motors. Furthermore, according to [
7], the mechanical structures to which the various stepper motors are attached are different. A variation in the load affects the rotor oscillation and the vibration, whereas the variation in the mechanical structure affects the natural frequencies. Therefore, the greater amplitude of the AE signal in the y-axis was due to the greater load of the table’s mechanical system, in addition to the fusion and deposition process. It was also clearly noticed in this signal the peaks occurring between the odd and even segments, which were due to the complete stop of one step motor (end of a segment fabrication in the x-axis) and the start of the other step motor (beginning of a new segment fabrication in the y-axis), thereby producing a spike in the AE.
The raw AE data related to the IIP are shown in
Figure 3, which started at 10.92 s approximately. A very noisy signal can be observed for this pattern, with the segments increasing their size from the beginning of this infill pattern fabrication up to the main diagonal segment, and then decreasing in size up to the end of the fabrication, as expected. However, the 32-IIP segments were not distinguishable in the signal as in the EIP, and then a micro view of the raw signal, recorded video of fabrication or RMS signal analysis were needed to obtain the segment definition. The amplitude of the signal varied along the IIP, but it had an average value with less dispersion when compared to the EIP. This is due to the simultaneous movements of the table and extruder systems, whose mechanisms requested nearly the same load from the step motors during this pattern fabrication, and then generated a quasi-static acoustic emission level from a macro perspective. The occurrence of AE spikes along the pattern was also noted, which were due to the start and end of each segment fabrication derived from the step motor drive, but not at the same magnitude and time period.
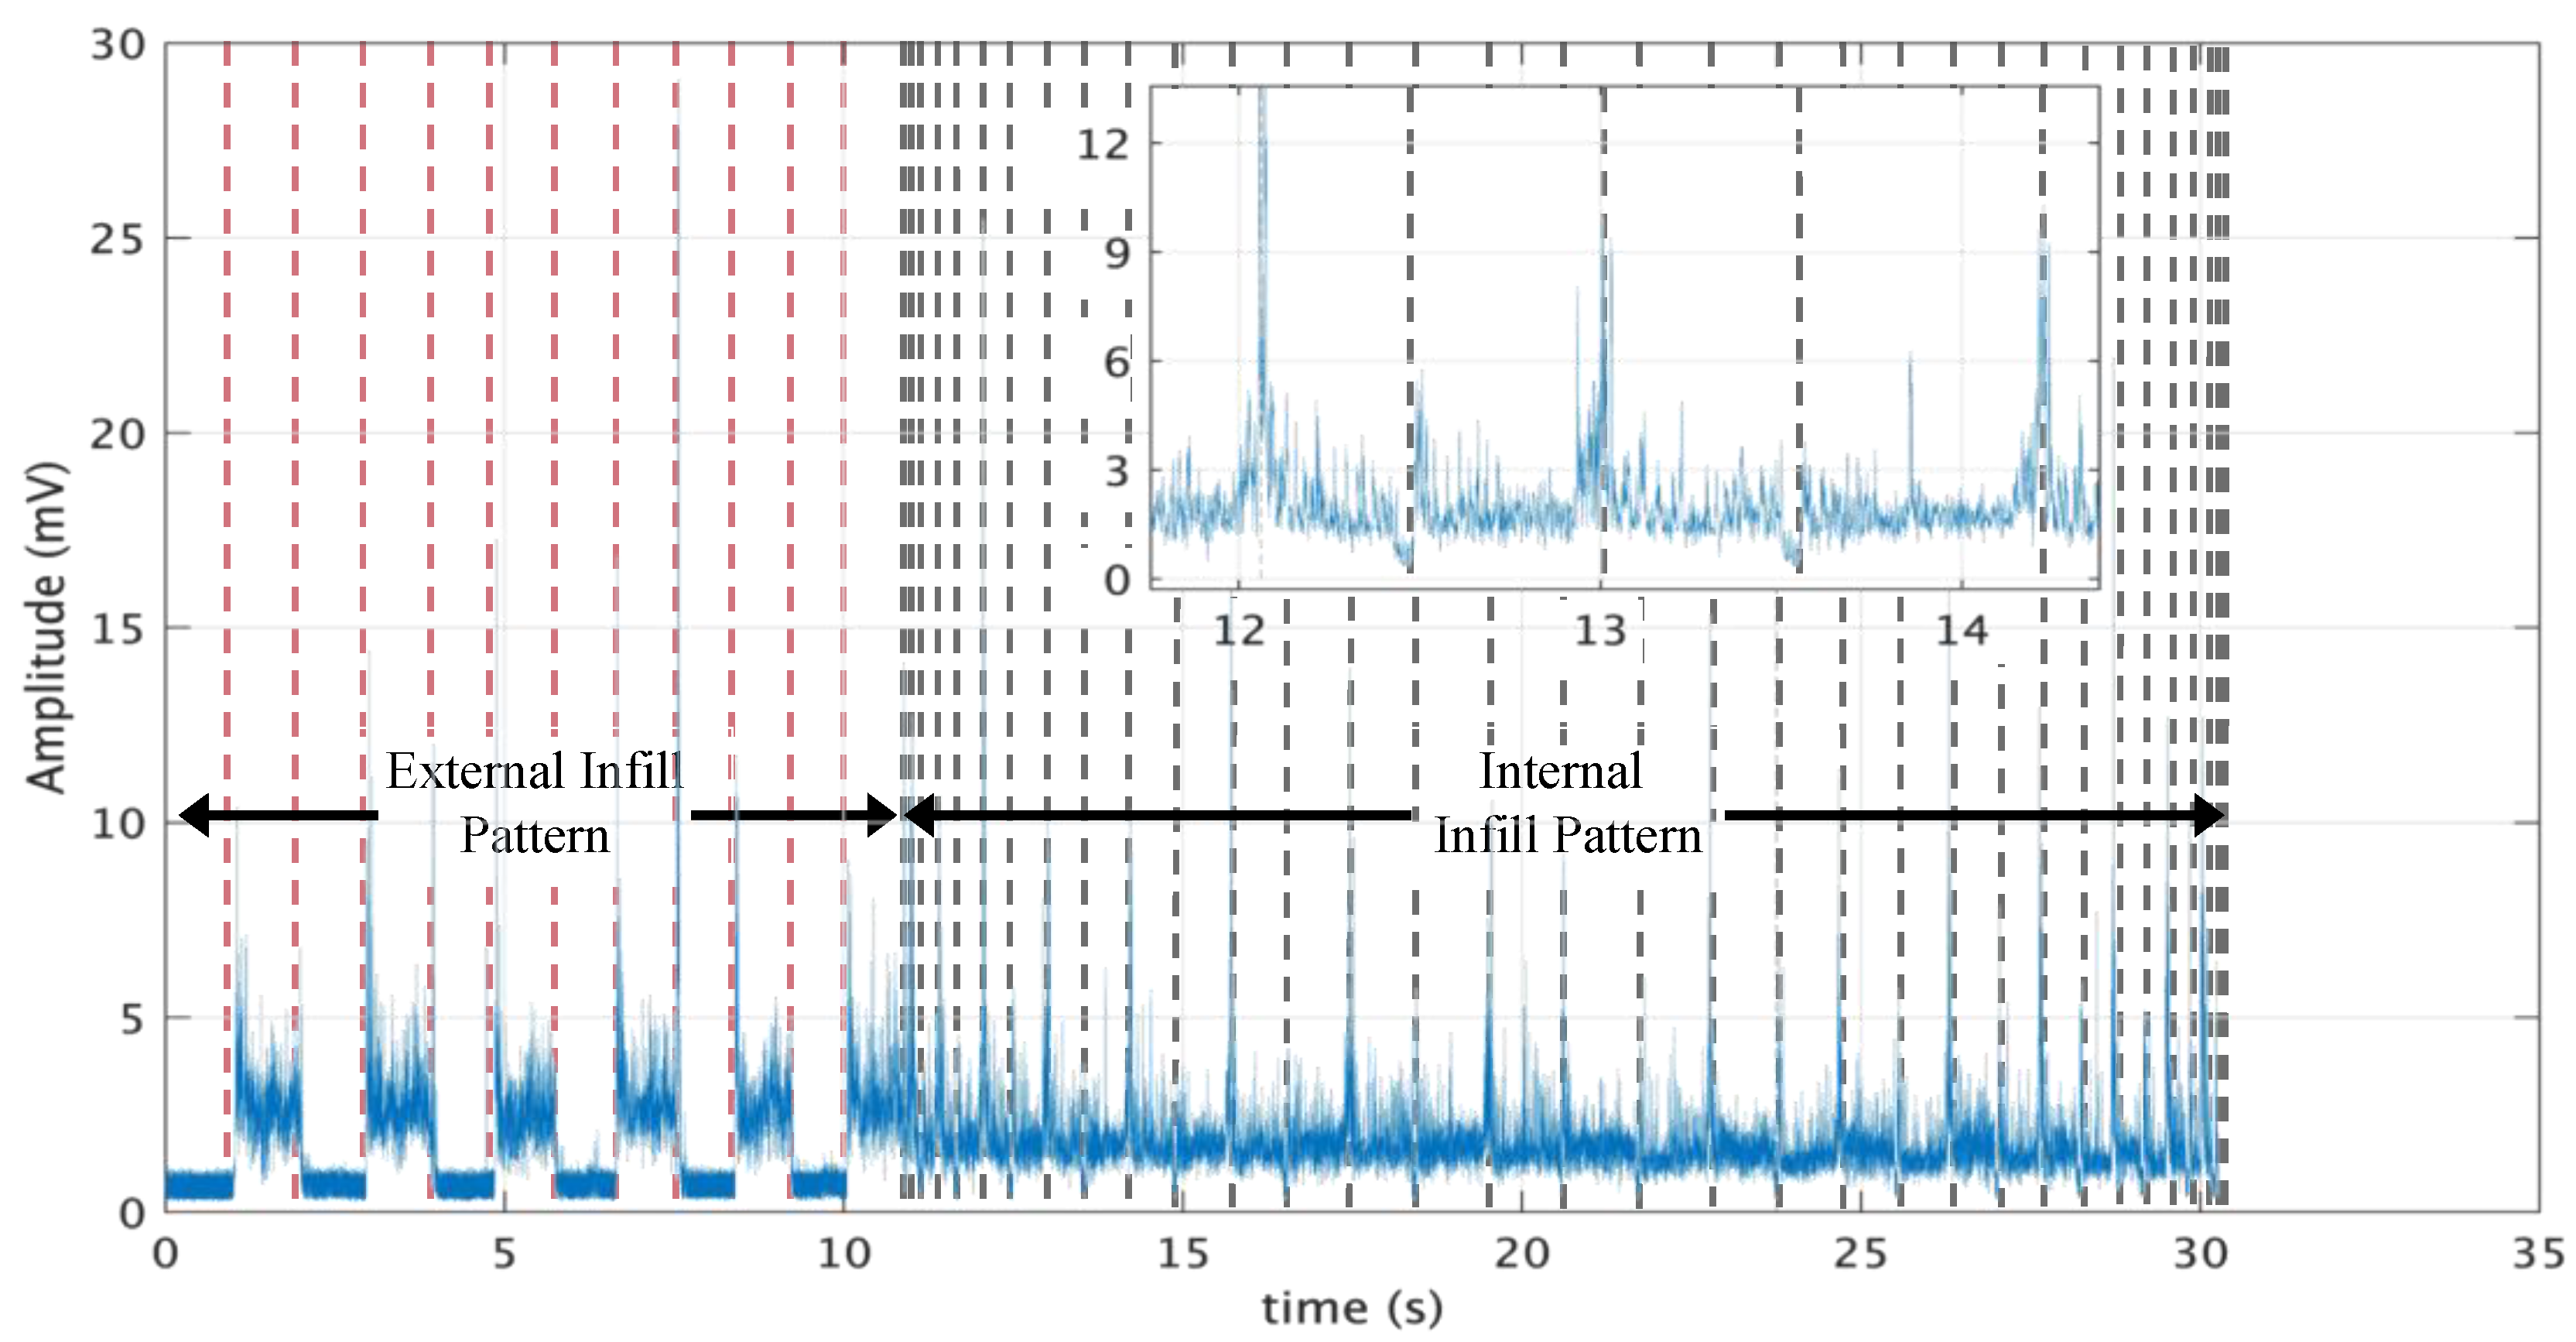
Figure 4 shows the AE RMS signals obtained for both EIP and IIP during the whole fabrication of the part. The vertical dashed lines represent the segments manufactured during the whole printing process. As observed in the raw signals, from a macro analysis, the segments were well defined for the EIP in the transitions between the extruder and table movements, but not for the IIP fabrication during which both extruder and table moved simultaneously. However, the segments could be defined approximately when the signals were magnified in this region, as shown in the right upper corner of
Figure 4. The amplitude of the acoustic emission for each segment varied for both patterns due to the specificities of these mechanisms of movement, which may be objectives for a further study. Finally, the same observations previously presented for the raw AE could be made for the RMS signals regarding the generation of acoustics during the fabrication process.
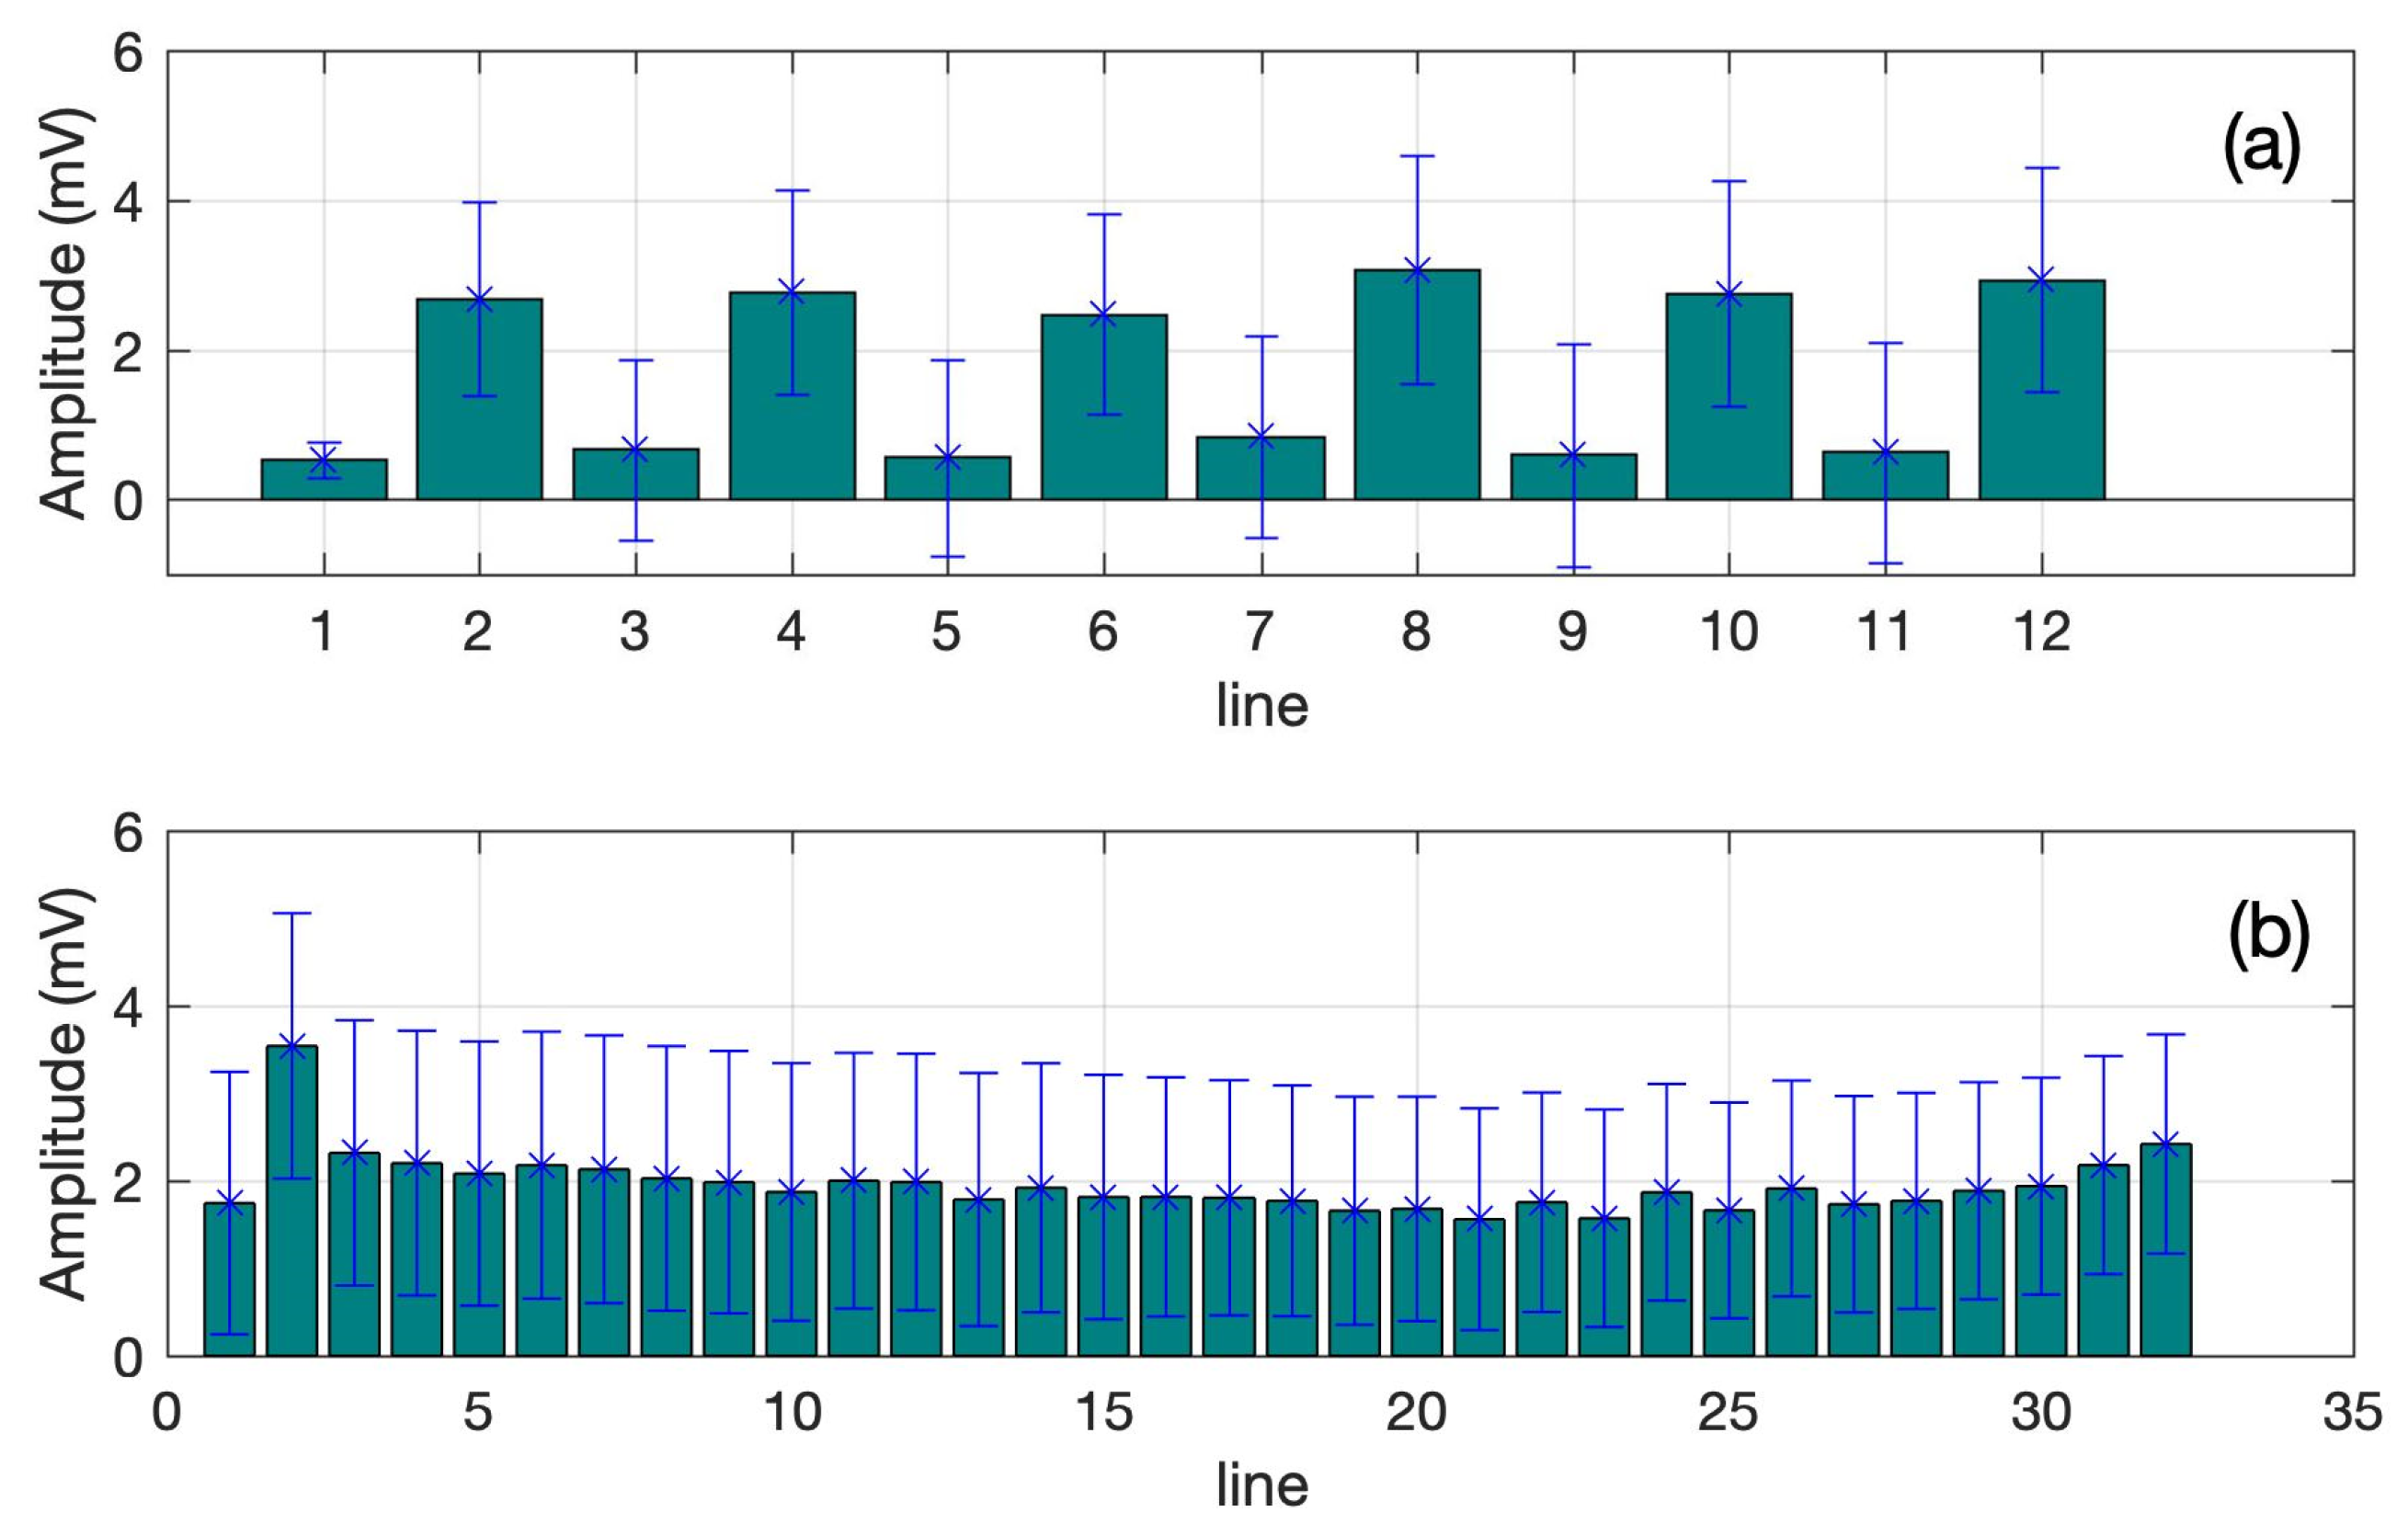
Figure 5 shows the AE mean values for each fabricated pattern and the corresponding standard deviation. A nearly constant mean value for each type of line fabricated could be seen, as expected. The differences observed were due to the random AE peaks throughout the entire process in addition to some imprecision of the method in extracting the lines, which was based on the RMS signal, as described previously. The standard deviation values, however, were very high, which could be explained by the occurrence of AE spikes throughout the entire process, which mostly were due to the step motors, as observed earlier, as well as to other random signals that need to be further studied.
4. Conclusions
This work has presented the study of AE signal behavior in the time-domain during the fabrication of a single layer part in the FFF process. It can be concluded that the raw acoustic emission signals behave quite differently not just for the two infill patterns, but within the same pattern. It was verified that the main sources of acoustics from the 3D process were the vibrations from step motors attached to the printer structures, whose vibration levels depended on the load, as supported by other research studies. It was evident the lighter acoustic emission level occurred for the extruder-only movement, in contrast with the table-only and table–extruder movements. The raw and RMS AE signals contained many spikes throughout the whole process, but the higher ones were those generally occurring at the end and/or start of a fabrication line. To a certain extent, the RMS values had a similar behavior to the raw signal regarding the process noise, in addition to being helpful in finding the start and end times of each fabricated line for both patterns. The mean RMS values showed nearly constant but different averages for the extruder-only, table-only and extruder–table movements. The standard deviation values, on the other hand, were very high, as expected, due to the inherent spikes from the noisy process. This work is preliminary and valid for the conditions and printer used.
Author Contributions
Conceptualization, T.G.L. and P.R.A.; methodology, T.G.L.; software, T.G.L.; validation, P.R.A., T.V.F. and P.d.O.C.J.; formal analysis, C.S.J.; investigation, Z.R.F.A.; resources, T.V.F.; data curation, P.R.A.; writing—original draft preparation, T.G.L.; writing—review and editing, P.R.A.; visualization, C.S.J.; supervision, P.d.O.C.J.; project administration, P.R.A.; funding acquisition, T.V.F. All authors have read and agreed to the published version of the manuscript.
Funding
This work was supported by the São Paulo Research Foundation (FAPESP) (grant #2016/22038-8) and by the National Council for Scientific and Technological Development (CNPq) (grant # 306774/2021-6).
Institutional Review Board Statement
Not applicable.
Informed Consent Statement
Not applicable.
Acknowledgments
Thanks go to the São Paulo Research Foundation (FAPESP) and the National Council for Scientific and Technological Development (CNPq).
Conflicts of Interest
The authors declare no conflict of interest.
References
- Yang, Z.; Jin, L.; Yan, Y.; Mei, Y. Filament breakage monitoring in fused deposition modeling using acoustic emission technique. Sensors 2018, 18, 749. [Google Scholar] [CrossRef] [PubMed]
- Wu, H.; Yu, Z.; Wang, Y. Experimental study of the process failure diagnosis in additive manufacturing based on acoustic emission. Meas. J. Int. Meas. Confed. 2019, 136, 445–453. [Google Scholar] [CrossRef]
- Wu, H.; Yu, Z.; Wang, Y. Real-time FDM machine condition monitoring and diagnosis based on acoustic emission and hidden semi-Markov model. Int. J. Adv. Manuf. Technol. 2017, 90, 2027–2036. [Google Scholar] [CrossRef]
- Rao, P.K.; Liu, J.; Roberson, D.; Kong, Z.; Williams, C. Online Real-Time Quality Monitoring in Additive Manufacturing Processes Using Heterogeneous Sensors. J. Manuf. Sci. Eng. Trans. ASME 2015, 137, 061007. [Google Scholar] [CrossRef]
- Alexandre, F.A.; Aguiar, P.R.; Götz, R.; Viera, M.A.A.; Lopes, T.G.; Bianchi, E.C. A novel ultrasound technique based on piezoelectric diaphragms applied to material removal monitoring in the grinding process. Sensors 2019, 19, 3932. [Google Scholar] [CrossRef] [PubMed]
- Chhetri, S.R.; Canedo, A.; Al Faruque, M.A. KCAD: Kinetic Cyber-Attack Detection Method for Cyber-Physical Additive Manufacturing Systems. In Proceedings of the 2016 IEEE/ACM International Conference on Computer-Aided Design (ICCAD), Austin, TX, USA, 7–10 November 2016; pp. 1–8. [Google Scholar]
- Chhetri, S.R.; Al Faruque, M.A. Side Channels of Cyber-Physical Systems: Case Study in Additive Manufacturing. IEEE Des. Test 2017, 34, 18–25. [Google Scholar] [CrossRef]
| Publisher’s Note: MDPI stays neutral with regard to jurisdictional claims in published maps and institutional affiliations. |
© 2022 by the authors. Licensee MDPI, Basel, Switzerland. This article is an open access article distributed under the terms and conditions of the Creative Commons Attribution (CC BY) license (https://creativecommons.org/licenses/by/4.0/).


 ,
, 


