Proceeding Paper

Experiment with Cuffless Estimation of Arterial Blood Pressure from the Signal Sensed by the Optical PPG Sensor †

Institute of Measurement Science, Slovak Academy of Sciences, 841 04 Bratislava, Slovakia
*
Author to whom correspondence should be addressed.
Presented at the 9th International Electronic Conference on Sensors and Applications, 1–15 November 2022; Available online: https://ecsa-9.sciforum.net/.
Eng. Proc. 2022, 27(1), 51; https://doi.org/10.3390/ecsa-9-13220
Published: 1 November 2022

Abstract

:
The paper describes the development, testing, and verification of practical usability of the indirect cuffless method for estimation of arterial blood pressure (ABP) values from the photo-plethysmography (PPG) signal sensed by the optical PPG sensor. The proposed procedure uses time domain features (systolic/diastolic pulse time ratios and partial areas around the pulses) extracted from the second derivative of the PPG signal. The linear regression method is next used to calculate the relation between the determined PPG wave features and the blood pressure values measured in parallel using a blood pressure monitor. ABP values are finally estimated by the inverse conversion characteristic calculated from these linear relations. Summary estimation errors obtained from first-step experiments achieve acceptable values of about 8/3% for systolic/diastolic ABPs. However, further improvements are necessary before usage of the proposed procedure.

1. Introduction

We are interested in the analysis of the physiological and psychological impacts of vibration and acoustic noise on a person scanned in a weak-field magnetic resonance imager (MRI) [1]. The information about the state of the cardiovascular system of a tested person is mainly acquired by measuring current heart rate (HR) and arterial blood pressure (ABP) values. Both types of parameters can be successfully used for detection of the stress effect that accompanies the MRI scanning process [2,3]. These parameters can be obtained through a photoplethysmography (PPG) signal with parallel measurement of blood pressure values using an external portable blood pressure monitor (BPM) device. However, this type of measurement instrumentation and arrangement is less comfortable for tested persons and also brings with it some practical problems with the realization of the whole measurement experiment. This is especially true for the measurements in the weak magnetic field environment of the running MRI device, for which special prototypes of wearable PPG sensors consisting of nonferromagnetic materials that are fully shielded against the radiofrequency disturbance must be used [1]. Therefore, the cuffless approach to ABP value estimation is chosen in the current work to exclude using the BPM device.
This paper describes an indirect approach in which systolic (SABP) and diastolic (DABP) arterial blood pressure values are estimated from the sensed PPG wave [4,5,6]. In the first step, the proposed procedure determines time domain features (systolic/diastolic pulse times) and pulse areas from the preprocessed second derivative of the PPG signal (SD-PPG) to create a database of PPG wave features (PPGWF). For estimation of the ABP values from these features, the linear regression method is used to calculate the relation between the determined PPGWF parameters and the blood pressure values measured in parallel by the BPM (BPBPM). In the last step, the correctness and accuracy of the estimated SABP and DABP values are evaluated through comparison with the measured BPBPM values. From the obtained preliminary experimental results follows that the precision of the estimated ABP values differs depending on the measured hand (left/right) and the gender of a tested person (male/female). The summary obtained relative estimation error (REE) achieves 7.5% for SABP and 2.6% for DABP values respectively. These results are acceptable in this first-step part of the experiments, but further improvements are necessary before the proposed method would be implemented for practical usage.

2. Methods

2.1. Methods of Determination of ABP Values from PPG and ECG Signals

There exist several methods for determination of blood pressure values from the PPG or electrocardiogram (ECG) signals. For employment of both these signals, pulse transit time (PTT) methods are usually applied. The PTT represents the time difference between the onsets of ECG and PPG peaks [7]. Due to a linear relationship between PTT and ABP, the estimation of the blood pressure using the PTT is more accurate than using the PPG alone. On the other hand, this method necessitates parallel measurement by ECG and PPG sensors located at a known distance [8].
The estimation of DABP and SABP can be performed using only the PPG signal. In this case, the time domain features may be extracted from the first or the second derivative of the PPG signal. Principally, the SD-PPG waveform consists of five areas corresponding to the time domain features: systolic area, systolic upstroke time, diastolic area, cycle duration, and diastolic time [5,9]. Another approach using similar features was successfully used in [6]. It utilizes time features (from start of cycle to systolic peak, from systolic peak to end of cycle, from systolic peak to diastolic rise, from diastolic rise to end of cycle) and areas under the curve (from start of cycle to max upslope point, from max upslope point to systolic peak, from systolic peak to diastolic rise, from diastolic rise to end of cycle). Similar time duration features determined from the first and the second derivatives of the PPG signal can be used also for biometric identification purposes [10]. To estimate the ABP values from the determined time and area features, the least squares support vector machine (LSSVM) approach is often used. The extracted PPGWF parameters are then fed into the inference function of a regression version of the LSSVM algorithm [11].

2.2. Method of PPG Wave Features Determination and Estimation of SABP/DABP Values

The proposed method of SABP and DABP values estimation from the PPG signal consists of four phases: (1) creation of a database of PPGWF from the preprocessed second derivative of the PPG signal records, (2) application of linear regression method to find a linear relation between the determined PPGWF parameters and the BPBPM values measured in parallel, (3) calculation of inverse conversion characteristics for estimation of SABP/DABP values from PPGWF parameters, and (4) testing correctness and evaluation of precision of the proposed estimation method.
As introduced in [10], following points are located on the second derivative PPG wave—see positions of a2, b2, e2, and f2 markers in Figure 1. Between these points, the time features ta2, tb2, t2, and t3 can be determined, and finally, the time feature ratios can be calculated: ta2/Tpp, tb2/Tpp, t2/Tpp, and t3/Tpp, where Tpp represents the PPG cycle period. Inspired by [6], we also calculated the features representing the partial areas (PAo-a2, PAa2-b2, PAb2-e2, PAe2-f2—where the “o” denotes the start/origin point of the PPG cycle) around the systolic and diastolic peaks (see shaded parts in Figure 1). The features extracted using a2 and b2 points are next used for the estimation of SABP values; the time durations t2 and t3 and areas around e2 peaks and f2 holes are used for estimation of DABP values. Then, the determined PPGWF parameters from the processed PPG signal records are paired with the BPBPM values measured using the BPM device. Finally, the linear regression tool of the Matlab program environment is used to compute a linear relation between the determined PPGWF parameters and the SABP/DABP values for each of feature types. The resulting linear relationship characteristic can be described by the general bisector formula in the parametric form using the direction k as
yy1 = k (xx1), k = (y1y0)/(x1x0),
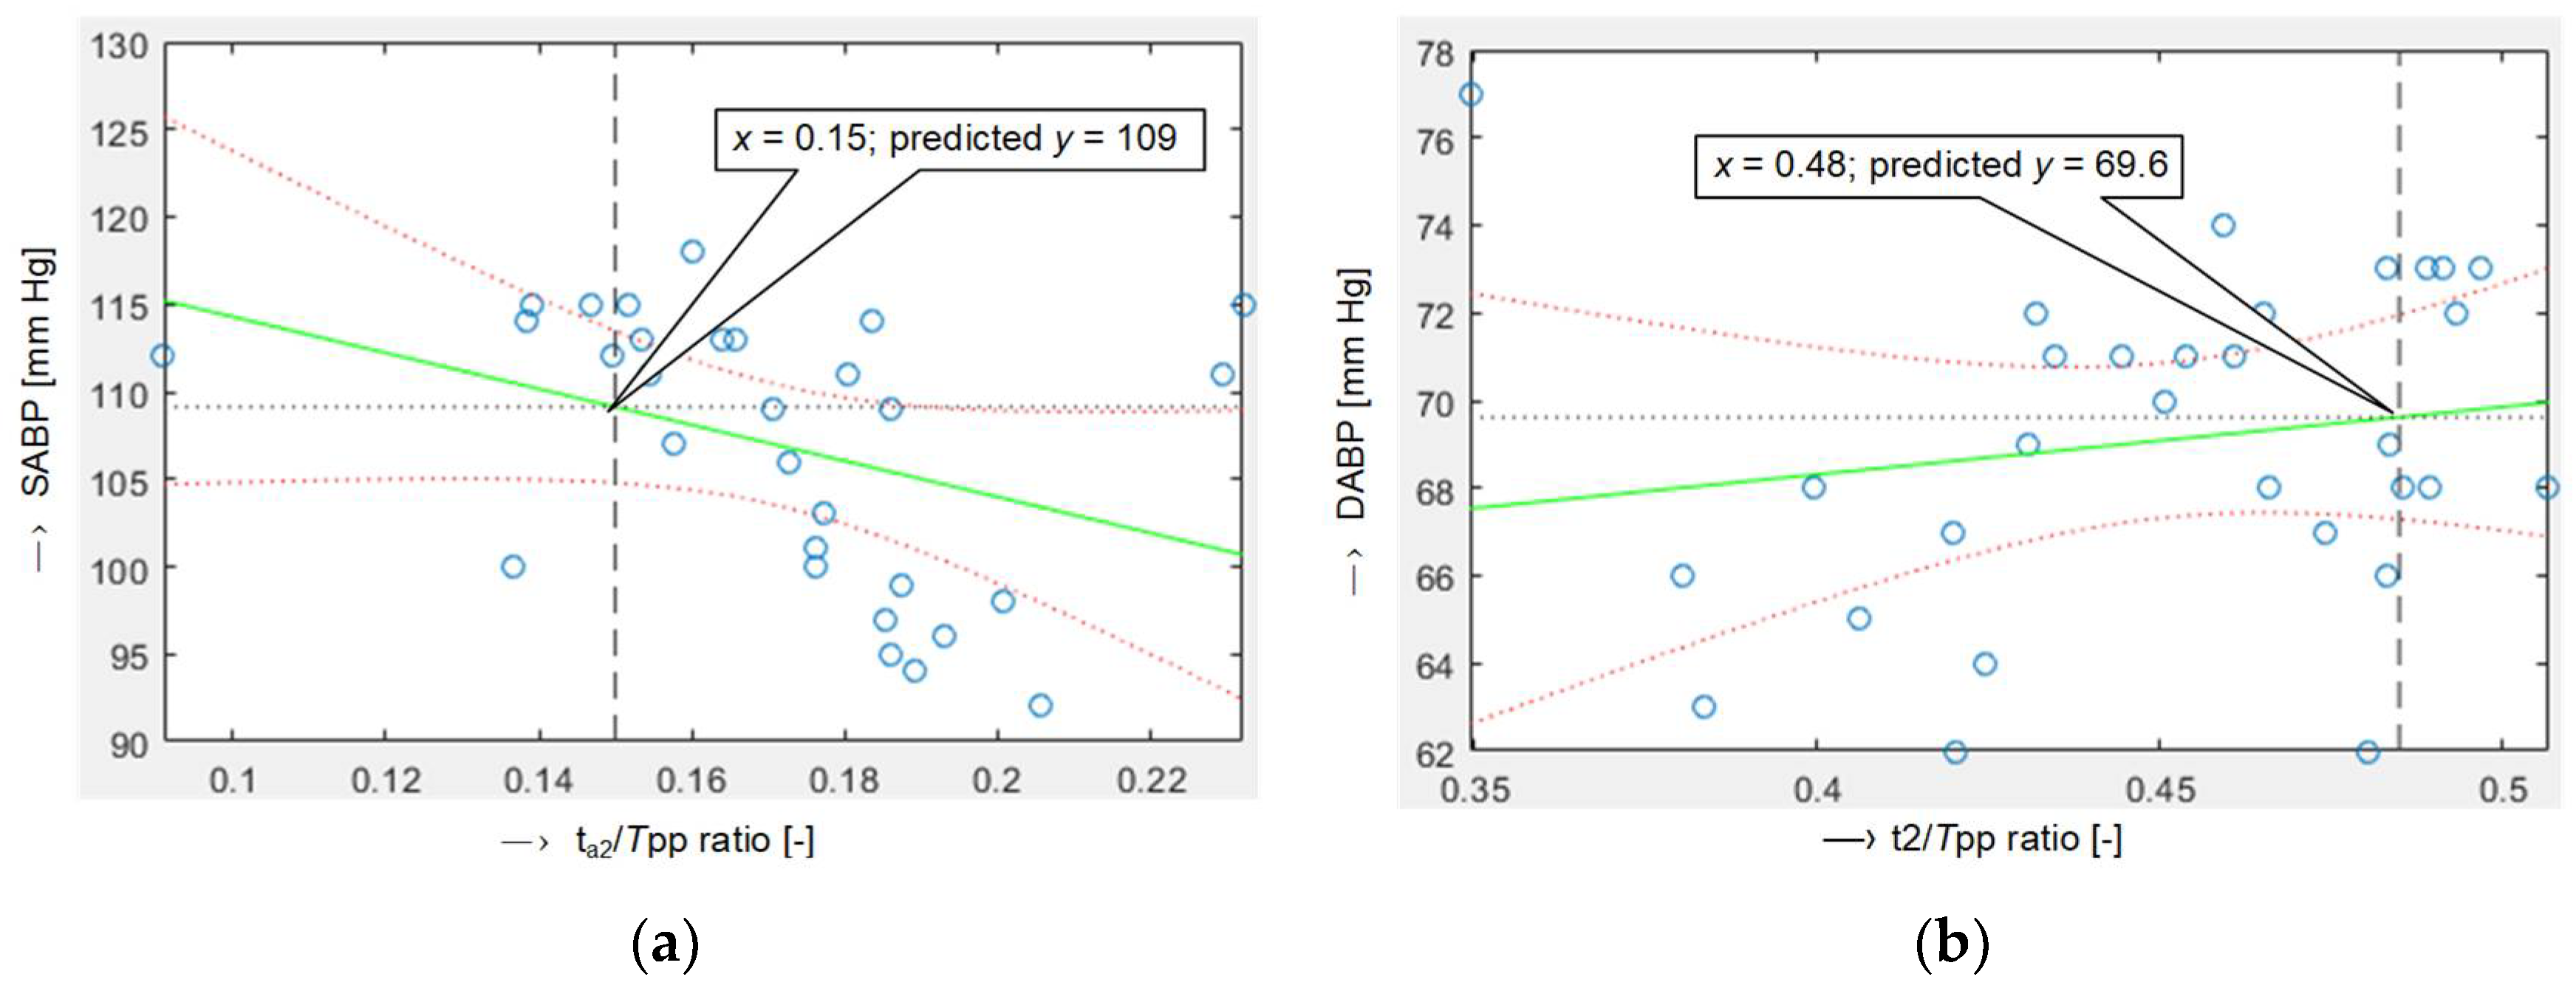
where y0,1 represent determined PPGWF parameters and x0,1 are the measured SABP/DABP values in mmHg. For k < 0, the relation between PPGWF parameters and ABP values has a declining trend; for k > 0, the relation has an ascending trend—see an example in Figure 2. For the estimation of ABP values from PPGWF parameters, the inverse linear characteristic is used. This means that parameters corresponding to y and x axes are exchanged—see an example of SABP estimation using ta2/Tpp and DABP estimation using t3/Tpp features in Figure 3.
For verification of the proposed method of ABP values estimation, another part of the PPG signal records was processed and analyzed (not used in the database creation phase) and also joined with known measured BPBPM values. The successfulness and precision of the estimation procedure were evaluated using the relative estimation error, REE, calculated as
REESABP,DAPB = (ABPTEST − BPBPM)/BPBPM × 100 [%],
where the ABPTEST represent SABP/DABP values obtained by estimation using features determined from the testing PPG signal records. As follows from our previous research, the quality and other parameters of the sensed PPG signal depend heavily on the measured hand (left/right) and also somewhat on the gender of a tested person (male/female) [1,12]. Therefore, the statistical analysis of the obtained REE values is performed separately for the left and the right hand and for the male and the female tested subjects as well as for the summary comparison for both hands together and all persons together.

3. Description of the Used PPG Signal Database, Experiments, and Results

In the current work, we use the extracted PPG signal database from the original one described in [12]. It contains the PPG signals picked up using the Pulse Sensor Amped PRODUCT (Adafruit 1093) working in reflectance mode and producing directly the SD-PPG wave as an output. This PPG signal is imputed to an analog mixer device, where it is digitized with the basic sampling frequency fs = 2 kHz and stored on a laptop. Subsequently, the PPG records are resampled at 160 Hz in the sound editor Sound Forge 9.0a for further processing. For BPBPM values measurement, the automatic blood pressure monitor BP-A150-30 AFIB by Microlife AG is applied. To prevent the already-discussed possible negative influence of an inflated pressure cuff of BPM on a tested person’s blood system, the PPG signal is picked up from the fingers of the opposite hand.
The currently processed PPG corpus consists of PPG signals sensed from four healthy volunteers—two males (M1, M2) and two females (F1, F2)—with a mean age of 49 years. In this way, we dispose of the PPG material picked from five fingers of the left and the right hands—“P1L/R, …, P5L/R”; each continually sensed PPG signal record with the total duration of 300 s practically consisted of five separate sections with durations of 60 s, and corresponding BP values were measured using the BPM device. In total, 500 60 s PPG signal sections (250 for the left and 250 for the right hand) per person are analyzed and processed. This PPG signal corpus is divided in a ratio of 4:1—this means that four of five of the 60 s PPG signal sections were used for creation of the database of PPGWF parameters together with the ABP values measured in parallel. In the frame of the testing phase, the remaining fifth 60 s section of PPG signals was used. Depending on the current heart rate of a person with originally sensed PPG signal, about 60–80 PPG cycles can be detected, and wave features can be determined from one PPG signal section. Next, the obtained values of the PPGWF parameters are statistically processed to calculate histograms of the occurrence distributions—see obtained partial results from PPG signals sensed of both hands of person M1 in Figure 4. Only one representative value with the highest occurrence was finally added to the PPGWF parameters database.
Obtained partial mean percentage REE values together with their standard deviations calculated separately for the left hand, the right hand, and both hands together analyzing the PPG signals sensed from the female tested person F1 are shown in Table 1; summary mean REE values for PPG signals originated from male/female and all tested persons are presented in Table 2.

4. Discussion and Conclusions

The performed preliminary experiments confirm practical functionality of the proposed method for the estimation of SABP/DABP values from the sensed SD-PPG signal wave. Although the precision of the estimated ABP values differs depending on the measured hand and somewhat on the gender of a tested person, the summary obtained relative estimation error (REE) values of 7.5 ± 10.8% for SABP and 2.6 ± 0.9% for DABP, which are acceptable for current state of our experiments.
As mentioned above, for the purposes of the current work, only the PPG records of four persons were used from the original database described in [12]. The PPG material of the remaining two persons was omitted due to partially untypical appearance of the PPG waves; the required a2 points would not be correctly detected and f2 holes were practically not present—see documentary examples of two PPG waves in Figure 5.
As the PPG signal from the tested person was always sensed in a silent sitting position without any physiological or psychological stimuli [12], the obtained range of SABP/DABP values was relatively limited—SABP ∊ <92~118> mmHg and DABP ∊ <62~77> mmHg. This has a positive effect on the robustness (stability) and accuracy of the estimation procedure when the ABP values of the tested PPG signal lie in these intervals. If the SABP/DABP values of the tested PPG signals are outside these ranges, the estimation procedure also works but the obtained results have significantly higher error.
On the other hand, if this outlier PPG signal record with the measured BP values is integrated to the created database of PPGWF parameters, the finally determined linear relationship characteristic can be radically changed. This means that the ascending trend would change to a descending one or the value of direction k can be modified heavily. In this case, the estimation error of SABP/DABP values from the PPG signals with BP values lying in the basic limited intervals was also increased—see Figure 6.
Therefore, it is necessary to process more PPG signals sensed in different relaxed/stimulation conditions to obtain wider measurement range of BP values prior to full practical usage of this developed estimation method in the working and experimental conditions we are interested in—e.g., from PPG signals sensed by wearable sensors in a weak magnetic field environment. For this reason, we plan to use the free access database PPG-BP [13] to verify the stability and accuracy of the developed ABP estimation method.

Author Contributions

Conceptualization and methodology, J.P. and A.P.; data collection and processing, J.P.; writing—original draft preparation, J.P. and A.P.; writing—review and editing, A.P.; project administration, I.F.; funding acquisition, I.F. All authors have read and agreed to the published version of the manuscript.

Funding

This work was funded by the Slovak Scientific Grant Agency project VEGA2/0003/20 and the Slovak Research and Development Agency project APVV-19-0531.

Institutional Review Board Statement

Institutional review board statement was waived for this study, due to testing authors themselves and colleagues from IMS SAS. No personal data were saved, only PPG waves and blood pressure values were used in this research.

Informed Consent Statement

Not applicable.

Data Availability Statement

Not applicable.

Conflicts of Interest

The authors declare no conflict of interest.

References

  1. Přibil, J.; Přibilová, A.; Frollo, I. First-step PPG signal analysis for evaluation of stress induced during scanning in the open-air MRI device. Sensors 2020, 20, 3532. [Google Scholar] [CrossRef] [PubMed]
  2. Steckner, M.C. A review of MRI acoustic noise and its potential impact on patient and worker health. eMagRes 2020, 9, 21–38. [Google Scholar]
  3. Celka, P.; Charlton, P.H.; Farukh, B.; Chowienczyk, P.; Alastruey, J. Influence of mental stress on the pulse wave features of photoplethysmograms. Healthc. Technol. Lett. 2020, 7, 7–12. [Google Scholar] [CrossRef] [PubMed]
  4. Yoon, Y.-Z.; Yoon, G.-W. Nonconstrained Blood Pressure Measurement by Photoplethysmography. J. Opt. Soc. Korea 2006, 10, 91–95. [Google Scholar] [CrossRef] [Green Version]
  5. Liu, M.; Lai-Man, P.; Fu, H. Cuffless blood pressure estimation based on photoplethysmography signal and its second derivative. Int. J. Comput. Theory Eng. 2017, 9, 202. [Google Scholar] [CrossRef] [Green Version]
  6. Slapnicar, G.; Luštrek, M.; Marinko, M. Continuous Blood Pressure Estimation from PPG Signal. Informatica 2018, 42, 33–42. [Google Scholar]
  7. Teng, X.F.; Zhang, Y.T. Continuous and Noninvasive Estimation of Arterial Blood Pressure Using a Photoplethysmographic Approach. In Proceedings of the 25 Annual International Conference of the IEEE EMBS, Cancun, Mexico, 17–21 September 2003. [Google Scholar]
  8. Zhang, M.; Wei, P.F.; Li, Y. A LabVIEW based measure system for pulse wave transit time. In Proceedings of the International Conference on Information Technology and Applications in Biomedicine, ITAB 2008, Shenzhen, China, 30–31 May 2008. [Google Scholar]
  9. Mousavi, S.; Firouzmand, M.; Charmi, M.; Hemmati, M.; Moghadam, M.; Ghorbani, Y. Blood pressure estimation from appropriate and inappropriate PPG signals using A whole-based method. Biomed. Signal Process. Control 2019, 47, 196–206. [Google Scholar] [CrossRef]
  10. Al-Sidani, A.; Ibrahim, B.; Cherry, A.; Hajj-Hassan, M. Biometric identification using photoplethysmography signal. In Proceedings of the Third International Conference on Electrical and Biomedical Engineering, Clean Energy and Green Computing (EBECEGC), Beirut, Lebanon, 25–27 April 2018; pp. 12–15. [Google Scholar] [CrossRef]
  11. Cattivelli, F.S.; Garudadri, H. Noinvasive cuffless estimation of blood pressure from pulse arrival time and heart rate with adaptive calibration. In Proceedings of the International Workshop on Wearable and Implantable Body Sensor Networks, Berkeley, CA, USA, 3–5 June 2009; pp. 114–119. [Google Scholar]
  12. Přibil, J.; Přibilová, A.; Frollo, I. Comparative Measurement of the PPG Signal on Different Human Body Positions by Sensors Working in Reflexive and Transmission Modes. Eng. Proc. 2020, 2, 69. [Google Scholar] [CrossRef]
  13. Liang, Y.; Chen, Z.; Liu, G.; Elgendi, M. A New, Short-Recorded Photoplethysmogram Dataset for Blood Pressure Monitoring in China. Scientific Data. 27 February 2018, Volume 5, p. 180020. Available online: https://figshare.com/articles/PPG-BP_Database_zip/5459299 (accessed on 19 July 2022).
Figure 1. Example of SD-PP signal with marked positions of a2, b2, e2, and f2 points and definition of time features ta2, tb2, t2, and t3 together with partial areas PAo-a2, PAa2-b2, PAb2-e2, and PAe2-f2.
Engproc 27 00051 g001
Figure 2. Examples of fitted linear relations between PPGWF parameters and SABP/DABP values calculated with the linear regression approach for (from left to right): ta2/Tpp ratio, tb2/Tpp ratio for estimation of SABP values and t2/Tpp, t3/Tpp ratios for DABP estimation.
Engproc 27 00051 g002
Figure 3. Examples of calculated conversion linear characteristics using: (a) ta2/Tpp ratio for estimation of SABP values, (b) t2/Tpp ratio for DABP estimation.
Engproc 27 00051 g003
Figure 4. Histograms of occurrence distributions of time PPGWF parameters (from left to right): ta2/Tpp ratio, tb2/Tpp ratio, t2/Tpp, and t3/Tpp ratio; PPG signals from both hands of a person M1.
Engproc 27 00051 g004
Figure 5. Comparison of two different SD-PPG signals: (a) PPG wave with presenting f2 holes; (b) PPG wave practically without f2 holes—this signal must be omitted.
Engproc 27 00051 g005
Figure 6. Example of outlier PPG signal with BP values effect to the linear relationship characteristic: (a) outlier record is not integrated; (b) outlier record integrated to the database.
Engproc 27 00051 g006
Table 1. Obtained partial mean REE values together with their std (in parentheses) separately calculated for the left hand, the right hand, and both hands together; PPG signals sensed from the tested person F1.
REE Type/PPG SignalFrom Left HandFrom Right HandFrom Both Hands
REESABP [%]21.9 (11.9)7.5 (10.8)8.6 (12.1)
REEDAPB [%]15.9 (5.1)2.5 (0.9)9.8 (6.1)
Table 2. Obtained summary mean REE values together with their std (in parentheses) separately for male/female and all tested persons.
REE Type/PPG SignalFrom M1, M2From F1, F2From All Persons
REESABP [%]1.2 (1.2)13.7 (14.0)7.5 (10.8)
REEDAPB [%]2.2 (1.4)2.9 (0.01)2.6 (0.9)
Publisher’s Note: MDPI stays neutral with regard to jurisdictional claims in published maps and institutional affiliations.