1. Introduction
This study dealt with the subject of Single-Point Incremental Forming (SPIF). The aim was to investigate the differences between the two damage criteria, the FLC and the FFL, for material E235 during SPIF using FE-Software. Particular attention was paid to the unequal failure behaviour for different forming stylus sizes described in the literature [
1]. Based on this, the incremental forming of a special geometry was carried out in the experiment. The clear decrease in formability with the increase in the forming stylus radius was demonstrated. Neither the FLC nor the FFL could reproduce this realistically in a Simufact Forming model derived from numerous material tests, since this software does not take certain geometry-dependent effects into account. Instead, a so-called sheet-thickness-to-forming stylus-radius failure diagram (TRFD) was defined as a user-friendly, practically usable correlation between the general wall angle at which a crack can occur and the forming stylus radius. This makes it possible to dispense with failure simulations, which are still problematic, and to carry out further research.
2. Materials and Methods
A comparison of the significance of FLCs and FFLs as failure criteria in SPIF is generally required. There are numerous studies that characterize FFL as the only possibility for the prediction of SPIF-specific forming behaviour that comes close to the real conditions, i.e., without material necking [
2,
3,
4,
5,
6,
7]. It reproduces well the high, practically measurable formability of the process in many applications, and its suitability for a reliable simulation-based crack determination has already been demonstrated for some materials. Since specimens fail without interaction with the load path for a certain sheet thickness, it is even postulated as a material property. The only significant dependence of formability during the SPIF process is that on the ratio of sheet thickness to forming stylus radius, t
0/r
S, subsequently expressed by parameter R
SPIF. The smaller R
SPIF is, the stronger the tendency to necking is, and the greater the formability is reduced, which in turn corresponds to the behaviour described by the classical FLC. Therefore, the differentiation of the possible applications of the two considered failure criteria can and should be performed using R
SPIF in relation to the maximum formability.
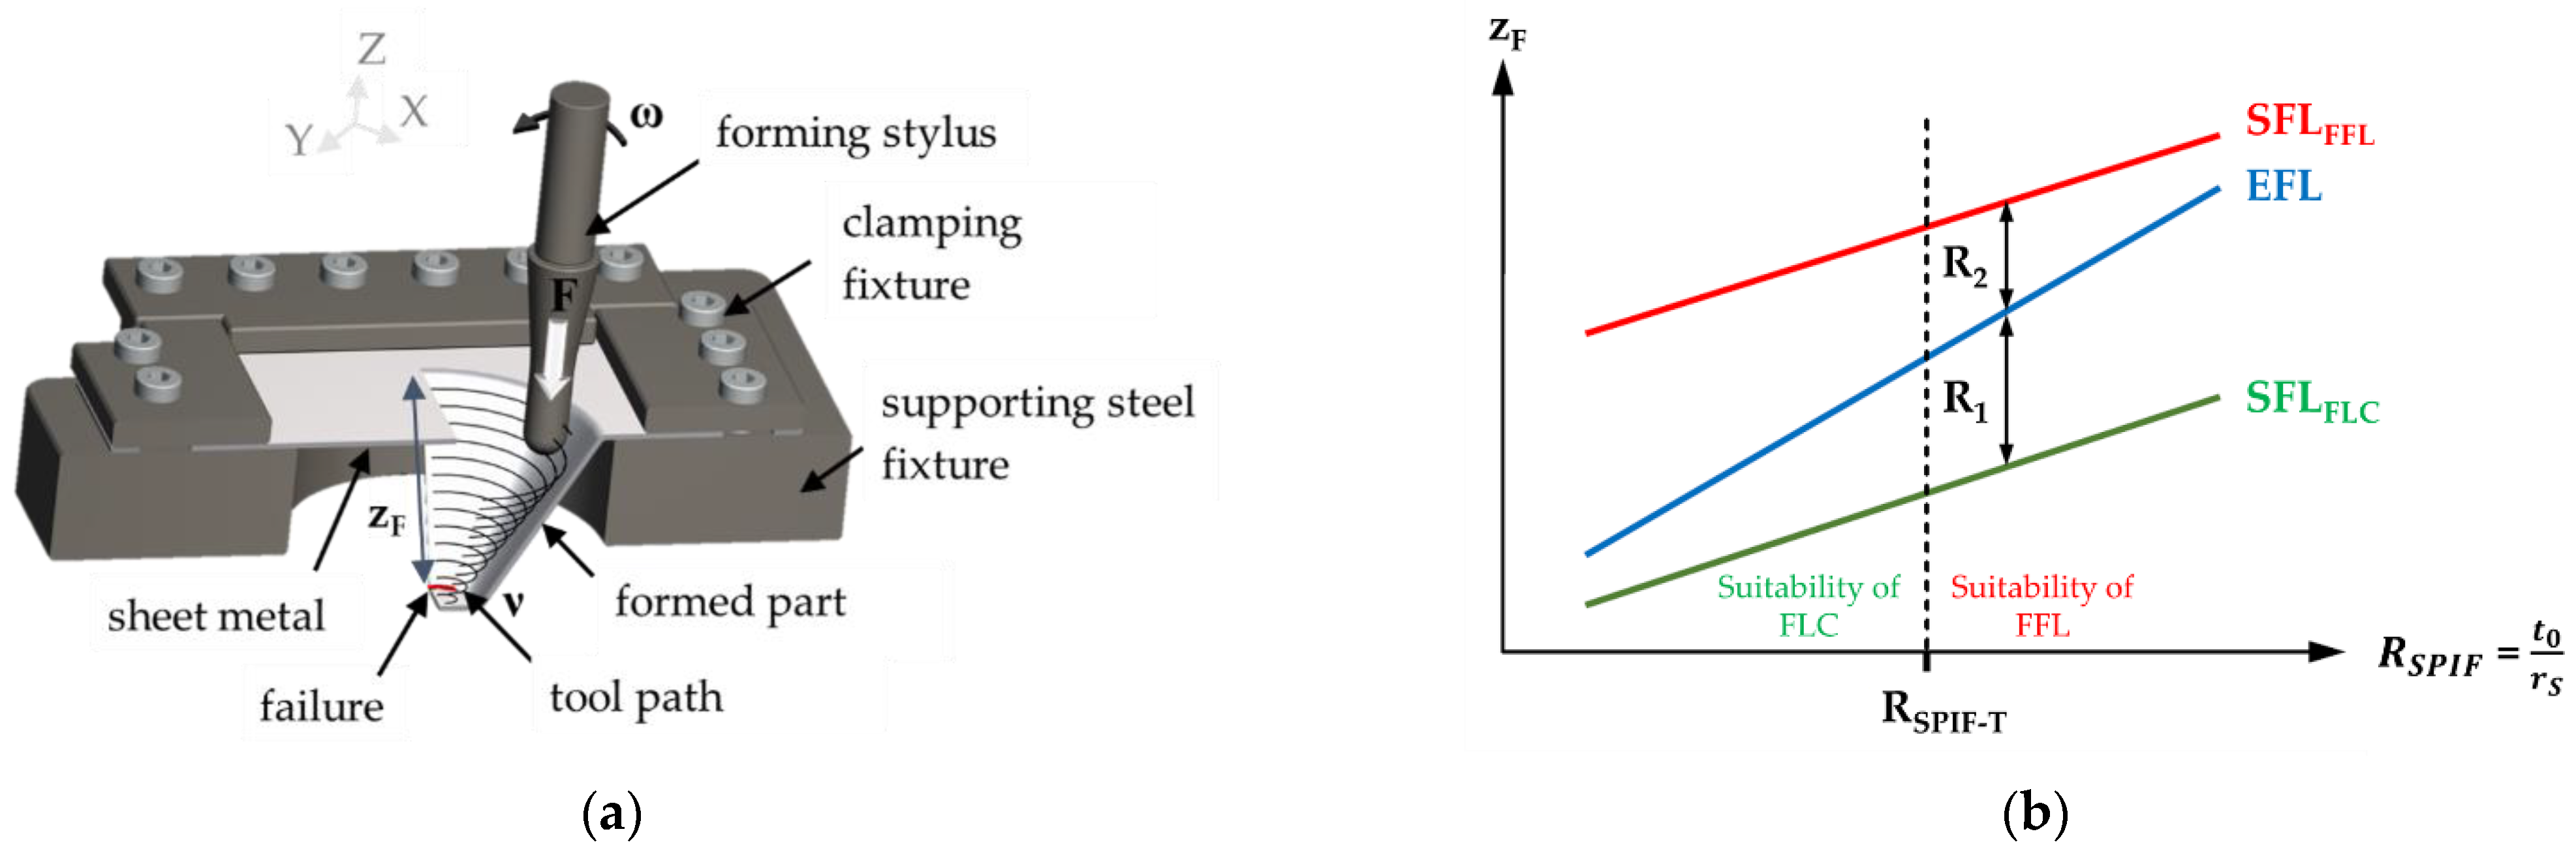
Accordingly, a series of experimental tests was performed by means of the SPIF of a uniform specimen shape with varying wall angle. As in the preliminary investigations, E235 steel was used for comparability and knowledge transfer. Prior to forming, the choice of process conditions and geometry had to ensure that fracture occurred in all cases, because without failure, no data points could have been collected, and the experiment would have been invalid. A possible criterion for formability is the strain achieved before failure; this can, however, only be measured on the component in a complex manner using circular grids. A simpler and easily determined but nevertheless meaningful criterion is the depth, z
F,, where failure occurs in the geometry, which in turn is directly related to the respective current wall angle. The greater the value achieved is, the higher the formability has to be. This qualitative statement is already sufficient for a basic evaluation. The R
SPIF parameter was determined by repeating the test several times with a constant sheet thickness and different forming stylus diameters. Finally, the measured combinations of z
F and R
SPIF were used to create a sheet-thickness-to-forming-stylus-radius failure diagram, abbreviated to TRFD, as a new type of representation that illustrated the relationship between the two variables. According to the fundamentals, the experimentally generated experimental failure line (EFL), as schematically shown in
Figure 1, must also increase with the increase in the value of R
SPIF, since formability increases due to enhanced bending effects.
In parallel, the tests had to be repeated numerically in Simufact Forming software, once with the FLC and once with the FFL as the incorporated failure criterion. The simulation model of the process was adopted from preliminary investigations as far as possible, since it has already been proven there. The FLC and the FFL have already been included and experimentally confirmed for E235 according to the state of the art. Only the part geometries and tools had to be adapted to the specifications or, if necessary, redesigned. The already elaborated knowledge concerning the best possible meshing and application of boundary conditions at SPIF was also exploited to focus on failure determination as the actual interest. The values for z
F determined in software after fracture had to be entered into the TRFD for the corresponding forming stylus radii and interpolated to two lines.
Figure 1 shows the expected course of the simulation-based failure line (SFL) with the FFL (SFL
FFL) and the FLC (SFL
FLC), respectively, according to the fundamentals. For larger R
SPIF values, the SFL
FFL should steadily approach the EFL. For a small R
SPIF, on the other hand, the SFL
FLC is theoretically closer with a smaller formability and then moves further and further away from the EFL. The exact spacing of the lines could not be predicted at this point, nor could their shape (straight line or curve), so they were plotted only qualitatively as shown in
Figure 1. Deviations from z
F, which occurred due to the springback of the parts in the experiment, had to be deducted based on trigonometric relations for high result accuracy. Therefore, the 3D measurement of the parts and a comparison with the geometries exported from the simulation in software GOM Inspect was performed. By superimposing the surfaces, the “error” had to be determined and z
F of the experiment thus compensated.
It was assumed, as shown in the figure, for the direction of the increases in SFLFFL and SFLFLC that Simufact Forming was able to represent the influence of RSPIF correctly according to reality. Whether this is actually the case has not yet been investigated for the selected simulation software; this was, therefore, the second objective of the experiments besides the EFL. Furthermore, the expected course of the curve as shown on the x-axis resulted in a threshold value, RSPIF-T, the determination of which was also aimed at. From this point on, the R1 distance (the residual) between SFLFLC and EFL was equal to the R2 value between SFLFFL and the EFL. Consequently, the here newly defined value, RSPIF-T, could serve as an easily testable application limit of the respective failure criterion in SPIF simulations, which would be a great advantage in practice.
Experiments
The aims of the tests were, as already described, to form several samples via SPIF with different ratios of RSPIF and to measure the occurring failure depth, zF, in order to describe the dependence of the two quantities in a diagram for material E235. Sheet blanks with an initial sheet thickness of (according to the supplier) 2.0 mm were used, as this semi-finished product is of industrial relevance. Due to the enormous calculation time for the numerical simulations, the investigations were initially carried out with only one sheet thickness value. Furthermore, the FLC was determined in the preliminary work using samples of 2 mm thickness. Since it (in contrast to the FFL) shows a certain dependence on the sheet thickness, this also had to be retained for the intended adoption of the determined failure curve. Even between two identical deliveries in terms of dimensions and material, there can be small differences in the flow curves, the FLC and FFL. Therefore, the same batch was used again. However, because the sheet thickness in reality always deviates from the order placed with the producer, but has a decisive influence on failure, its simulation and the RSPIF values determined, it had to be measured separately at several points in preparation for the investigation. This was already carried out for each sample of the Nakajima and Marciniak tests at two locations each, and an average value was determined. The same sheets were used for the SPIF tests in this work. Therefore, a new average could be formed from the large number of thickness measurements with sufficient accuracy, which then served as a reference value for both FE modelling, and the calculation and graphical representation of RSPIF.
In order to be able to observe experimentally the gradual transition of the different fracture types in SPIF, five different forming stylus diameters were selected (according to availability) similar to those in the investigations by Silva, Nielsen, et al. [
2], which covered the industrially available spectrum as best as possible. From a manufacturing point of view, the use of a very small forming stylus is only possible for thin sheets or easily formable materials such as plastic or aluminium. Experience shows that with the chosen combination of material and sheet thickness, the transverse loads that occur cause a high bending moment even with small forming stylus lengths and can easily lead to the deformation of the forming stylus. A preliminary test with a diameter of 5 mm confirmed this assumption. Apart from that, manufacturing under these conditions has to be prevented, since the tip of the forming stylus never has its position as intended in the CAM programme (ESPRIT) and geometric errors occur. Accordingly, there is a lower, production-related limit to the forming stylus size that should not be touched in any way during a test. Therefore, the choice falls on the still comparatively small but nevertheless process-safe diameters of 10 mm and 15 mm, which are used very frequently in practice and are regarded as the established standard. In contrast, 45 mm and 60 mm are seldom found, as the forming stylus diameters are expensive, are not suitable for all workpiece geometries and can influence formability. Nevertheless, they are used, for example, for large parts, to reduce the production time or to achieve the smallest possible roughness in certain situations; they were investigated in the experiments. The fifth, supplementary diameter of 30 mm is an average value that combines both the positive and negative characteristics to a greater or lesser extent. The spherical forming styli were made of prehardened (45 HRC) tool steel Toolox44, which was provided with an AlCrNi coating for additional service life extension and friction reduction.
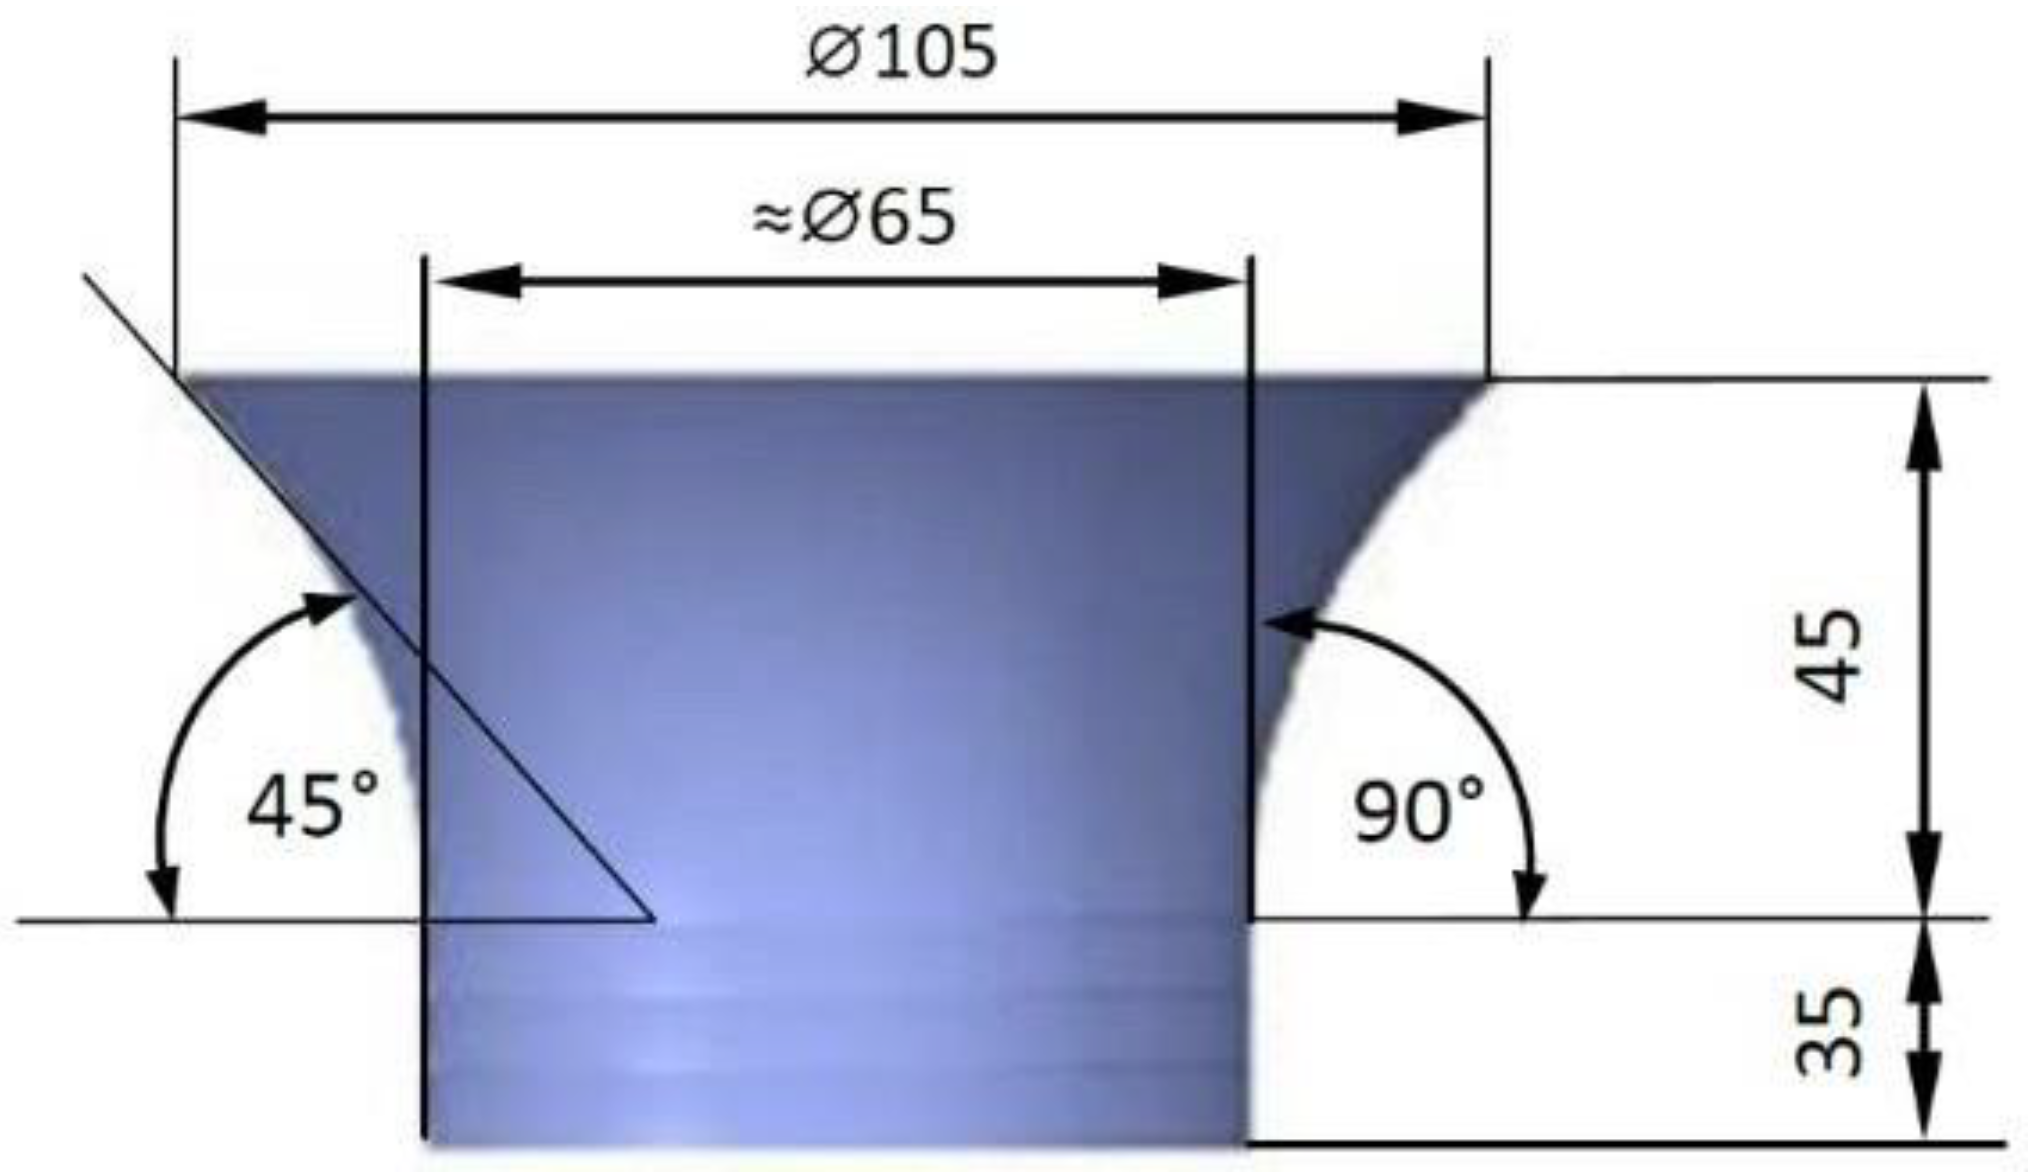
A truncated cone with a varying, steepening wall angle
β was chosen for the investigations. Failure and formability in SPIF are decisively related to the maximum sheet thickness reduction, which in turn is linked to the wall angle via the sine law (1). This is only an approximation, so a suitable test had to be developed to represent the real component failure independent of geometry.
If this varies and always increases with increase in failure depth, the maximum angle can be determined via an experiment on this one specimen shape. Meanwhile, with a constant angle, many, possibly iterative experiments are required, each with slightly steeper components, until the maximum wall angle is reached. Each angle on the cone shape is assigned to a unique failure depth, which is thus representative of formability and can be easily measured. The exact selection of the shape was based on former experiments, since failure has always occurred reliably there, which is indispensable for the usability of the test results. The geometry used with its main dimensions is shown schematically in
Figure 2. The total height of the part (without previous fracture) was a maximum of 80 mm. The wall angle,
β, varied between 45° and 90°. Its progression from top to bottom (in the depth direction) was described by the simple mathematical function of wall angle
β (2), which was valid for a forming depth z between 0 mm and 45 mm.
3. Results
The results of the experimental tests of SPIF on E235 using different forming stylus radii r
S are summarised in
Table 1. In
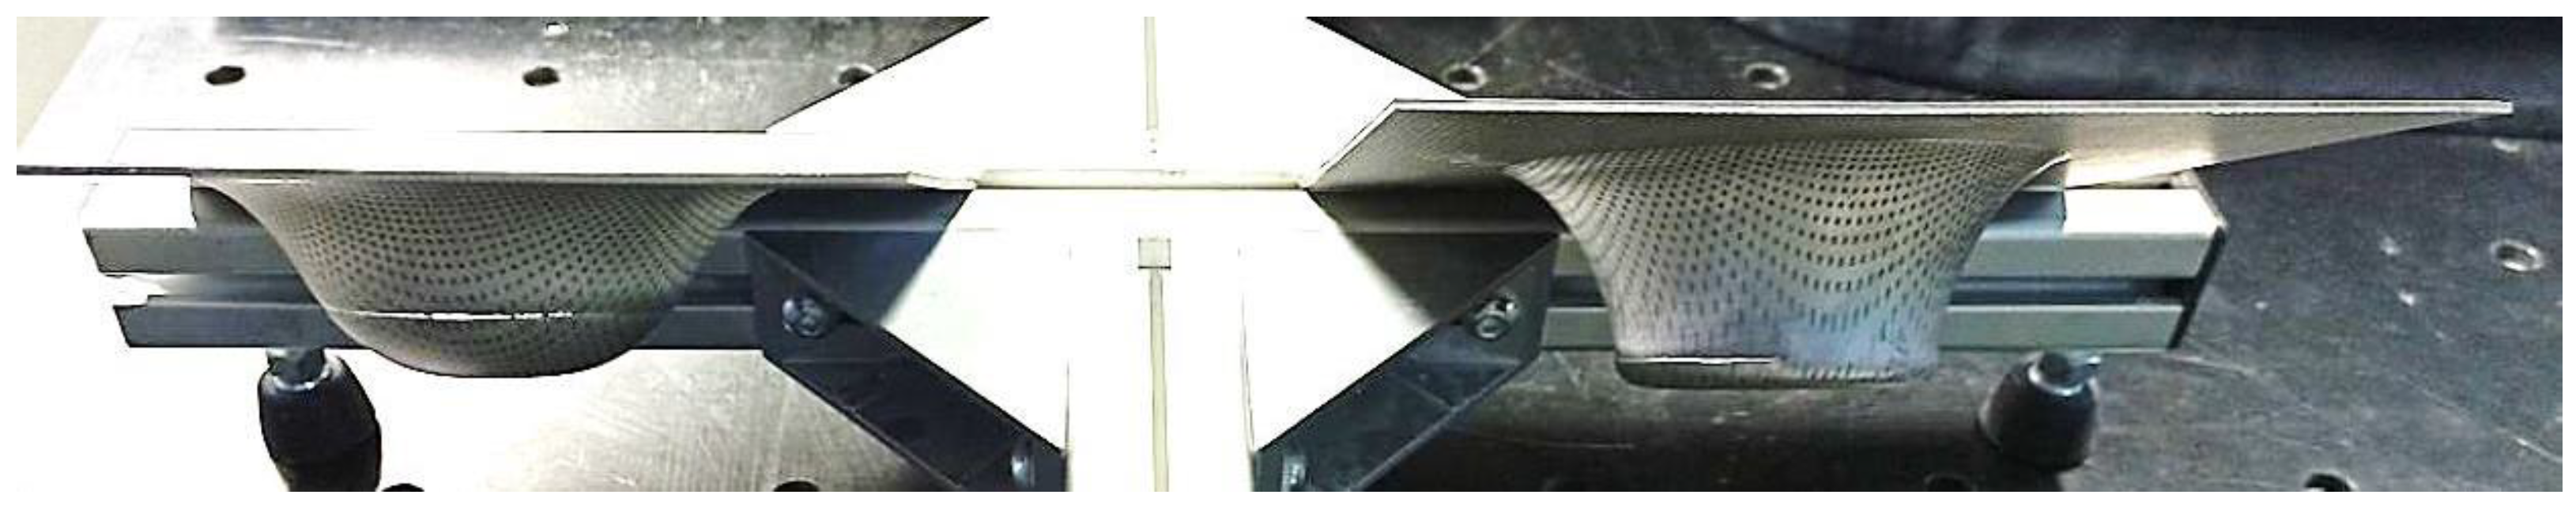
Figure 3, the failure depth and grid distortion when forming the cone with large and small forming stylus radii are shown.
It was clearly visible that cracks occurred later and at larger wall angles when using a forming stylus with a smaller radius. This was also proven with the load measurements of the SPIF processes shown in
Figure 4, which were recorded using a Kistler load cell.
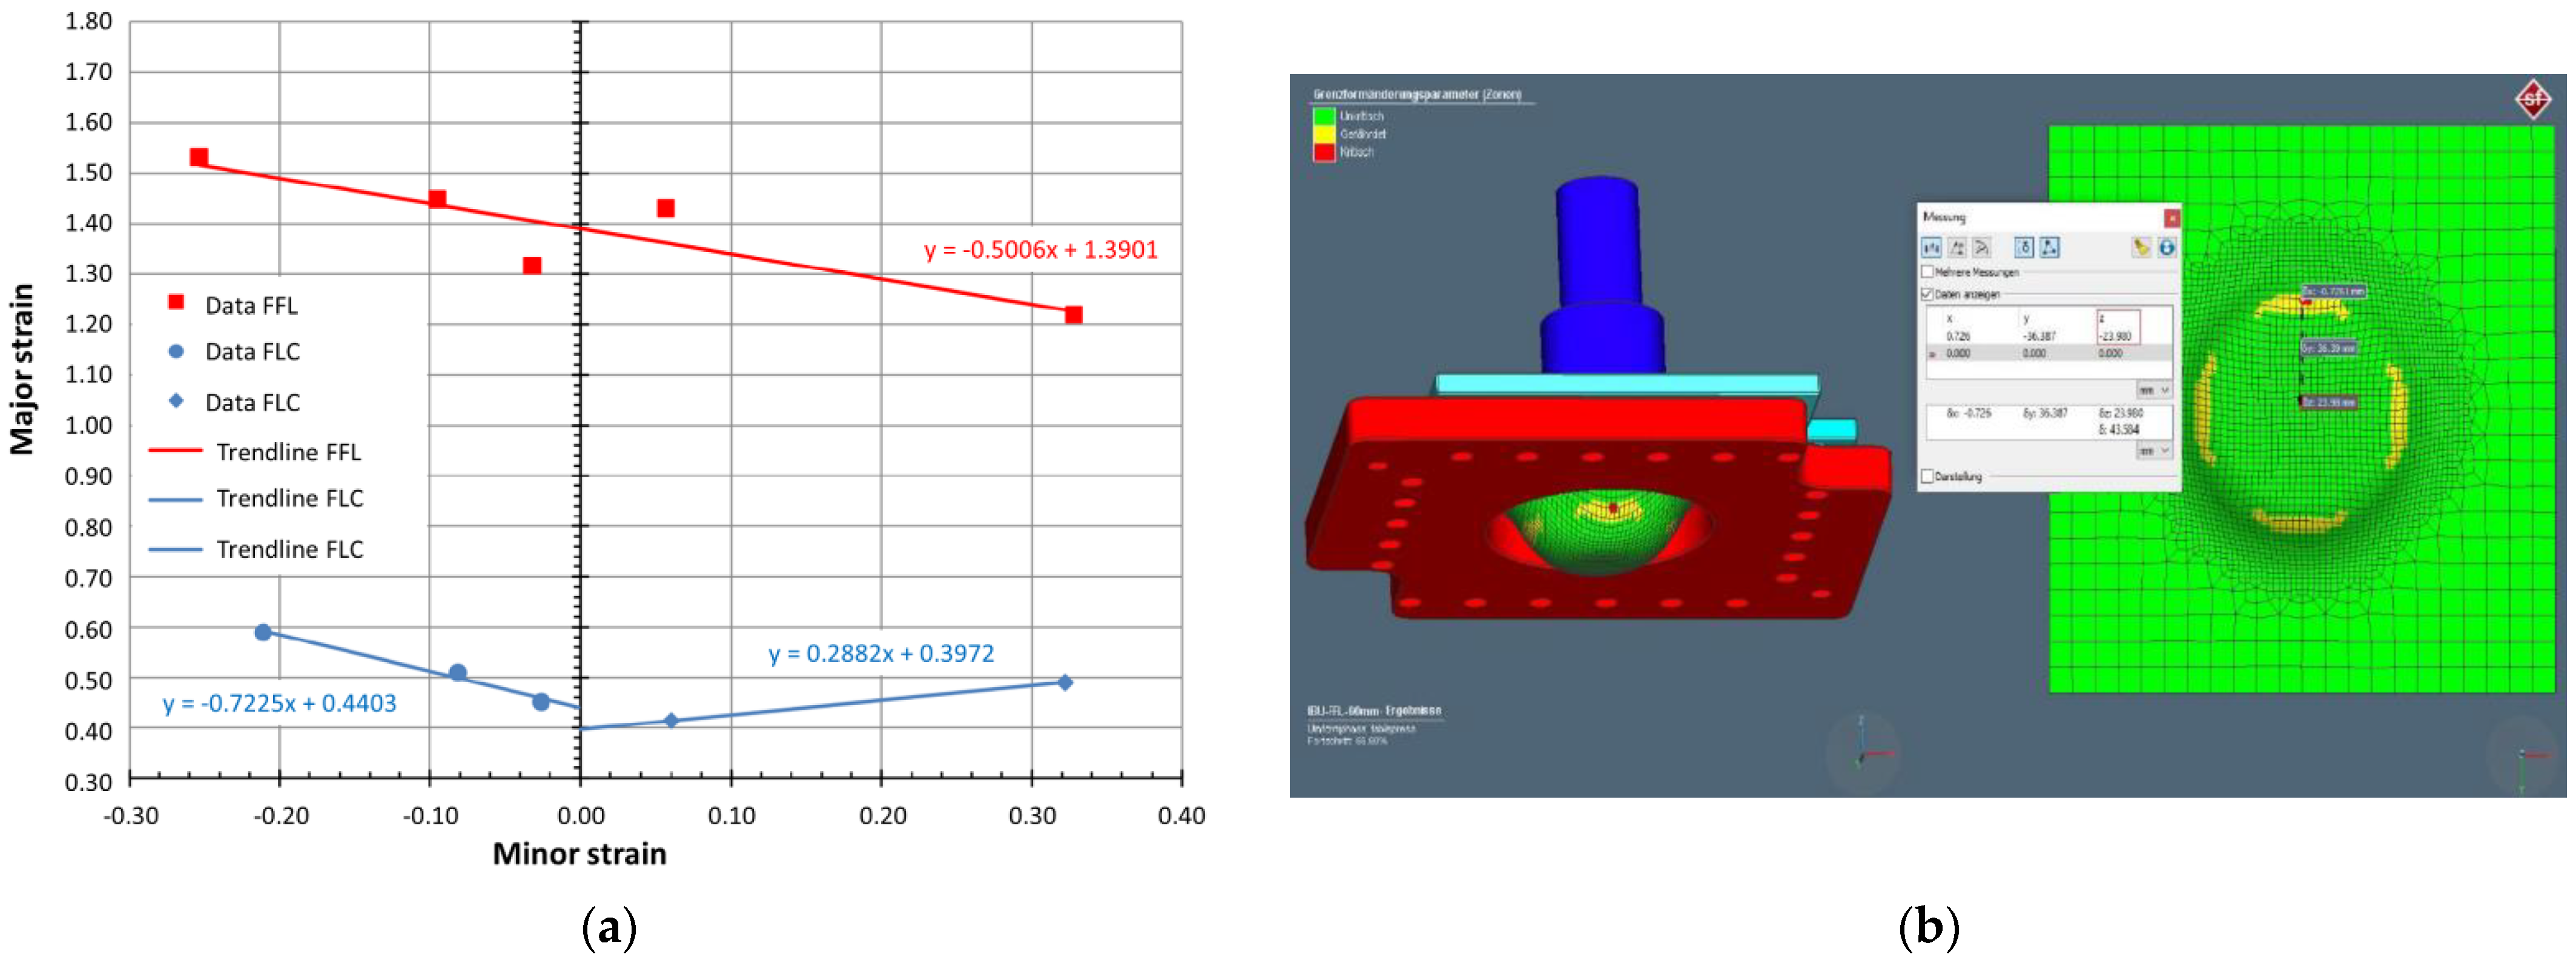
As a basis for the numerical investigations, the forming limit curve (FLC; see
Table 2) and the forming limit line (FFL; see
Table 3) were determined for material E235 using Nakajima and Marciniak tests. In order to balance the respective advantageous and disadvantageous properties of the test methods as well as isolated outliers, the data points were formed from the average values of both methods. The forming limit diagram of sheet material E235 and the measurement of failure depth z
F in the simulation are depicted in
Figure 5.
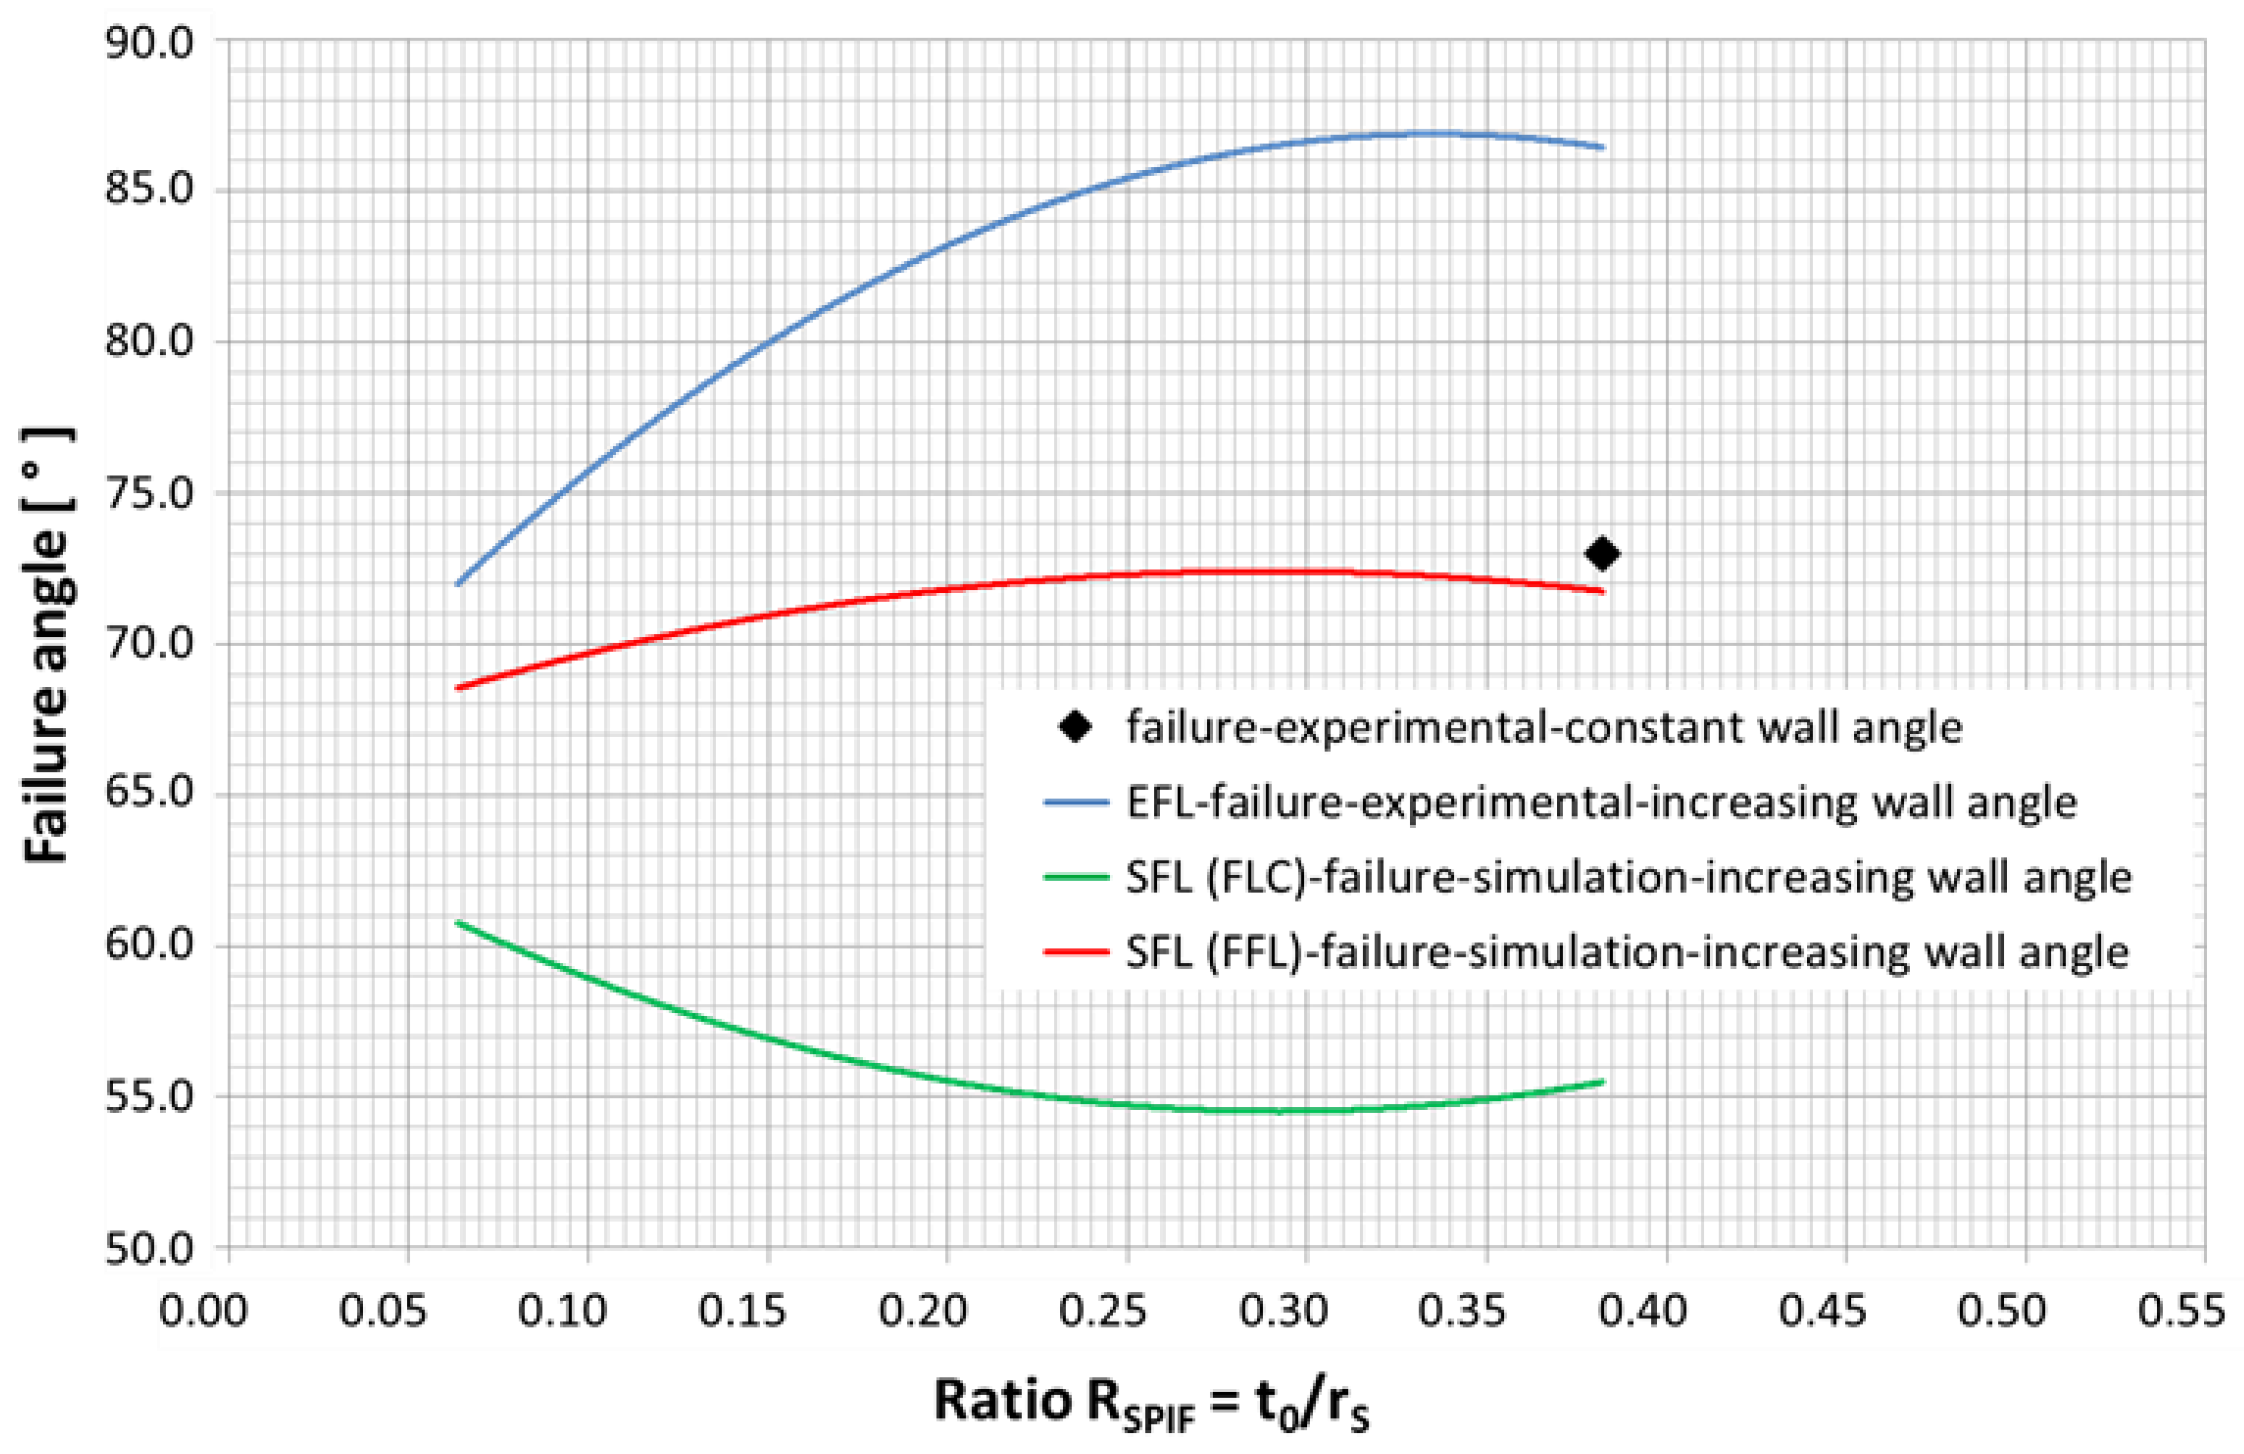
Figure 6 shows the sheet-thickness-to-forming-stylus-radius failure diagram (TRFD). The experimental failure line (EFL) was determined based on the experimental SPIF tests with variable wall angle (
Figure 2). The simulation-based failure lines (SFLs) for this were determined with the help of FE software Simufact Forming by implementing the determined FFL and FLC. It was found that the experimentally determined failure angles for all R
SPIF were significantly higher than those determined in the simulation. The experimentally determined failure angle for an R
SPIF of 0.382 on a specimen geometry with a constant wall angle was about 73° and was in the range of the simulation results with the FFL. The results showed that the component geometry had a very significant influence and that the FLC could not be used for modelling failure in SPIF in any case. The simulation results with the FFL showed a good correlation with the experimental results for small R
SPIF values. However, it must be noted that the FFL could not be used for large R
SPIF values. For large R
SPIF values, the FFL seemed to reproduce failure well for components with constant wall angles. However, further investigations are required here.
4. Discussion
In the SPIF of material E235, formability decreased noticeably and reproducibly with the decrease in the ratio of sheet thickness to forming stylus radius RSPIF. This became clear with the decrease in the maximum forming angle, which was representative of the achievable reduction in sheet thickness. If the angle achieved over RSPIF were plotted in a failure diagram as the so-called EFL, the characteristic curve would rise from left to right, first more steeply and then more and more flatly.
The loads in all spatial directions increased with the radius of the forming stylus, whereby the vertical component allowed conclusions to be drawn about the crack initiation and showed that in SPIF, failure always occurs suddenly and presumably without local constrictions as soon as formability is exhausted. This behaviour corresponds to the FFL theory.
Dimensional deviations from the nominal due to springback also increased with the increase in the forming stylus radius; therefore a forming stylus that is too small can also have negative effects. In addition to elastic–plastic deformation, these would also include material removal. With regard to the achievable shape accuracy, therefore, an optimal radius of the forming stylus exists.
The experimental critical angle was strongly dependent on the geometry produced, since the minimum sheet thickness according to the sine law only occurs with a certain delay, and the general critical angle could thus be exceeded. This could only be unambiguously determined for a given geometry with iterative tests on cones of constant angle.
The used FE model in Simufact Forming could not reliably reproduce the experimental failure. The simulation-based failure line with the FLC (SFLFLC) was clearly below the EFL in every range of the TRFD. Slightly above, but still too low, was SFLFFL using the FFL. The increase behaviour of both curves did not correspond to reality but only depended on the course of the strain paths compared to the selected criterion. The crack thus always occurred in the simulation largely independent of the geometry.
5. Conclusions and Outlook
This work investigated the possibility of SPIF simulation using the FFL and the FLC. Both are methods to map formability within a forming limit diagram on the basis of the tolerable principal strain. While the latter is a frequently used method for conventional sheet metal forming (deep drawing, etc.) and characterises failure by necking, the FFL describes the crack in SPIF in particular, independent of the load path with a significantly increased sum of the plane strain. The theoretical reasons for the larger formability of the process are stress superpositions and increased bending effects at the contact between a normally small forming stylus radius and the workpiece. At the same time, due to the increase in the ideal FFL from −1 in the forming limit diagram, the material always breaks with identical thickness deformation. The FFL would thus represent a pure material characteristic value. However, some preliminary investigations and literature studies contradict this and also show dependencies of the FFL on the ratio, RSPIF, of initial sheet thickness to the forming stylus radius used for SPIF. Based on this, the thesis was put forward that with a small RSPIF, the FLC and, with a large RSPIF, the FFL were better suited for the simulation-based representation of real SPIF.
For the graphical clarification of the dependency relationship, a new form of representation was defined with the sheet-thickness-to-forming-stylus-radius failure diagram (TRFD). The analysis of the obtained data showed that the experimental failure line (EFL) below which the process was considered safe steadily increased with the increase in RSPIF (and thus the decrease in the forming stylus radius), as suspected. At the same time, it became increasingly flat and thus took on a characteristic shape. However, the measurements of the load in the depth direction, the course of which was influenced in particular by the resulting sheet thickness, indicated that despite the lower formability, the crack occurred without significant necking, and suddenly, at a certain plastic thickness strain even for larger forming stylus radii. Parallel to the experimental tests, FE simulations took place, using software Simufact Forming with the two failure criteria. The wall angles concluded from the initial critical depth, zF, could in turn be entered into the existing TRFD as a so-called simulation-based failure line (SFL), called SFLFLC or SFLFFL depending on the criterion used, and compared with the EFL. SFLFLC was too low compared with the EFL and showed a false slope behaviour, as it fell with the increase in RSPIF. In contrast, SFLFFL was consistently higher, as expected, and had the correct slope direction. The magnitude of the slope was nevertheless too small compared with the EFL. It was deduced that the shape of the resulting curves depended only on the course of the strain paths with respect to the FLC or FFL used in Simufact Forming, which was not able to represent the clearly changing formability. For this, for each forming stylus, an FFL determined using the SPIF test had to be integrated into the FE model. However, this raised the question of why the software adopted also underestimated the failure depth for those small ratios for which the FFL should have theoretically applied.
In the future, further experimental and simulation-based (with FLCs and FFLs) investigations are required to determine the failure of components with constant wall angles. Furthermore, it should be checked whether the strain states between experiment and simulation agree, as discrepancies are also expected here. For such research, the optical measuring system GOM Aramis is to be used. Based on these correlations, the FE model is to be tested and further improved with regard to the applicability of the failure criteria for certain component geometries. It should also be examined whether the FE models and in particular the failure criteria can be used for other process variants, other materials and other sheet thicknesses.
A modification of the Simufact Forming model, e.g., with other remeshing criteria, initial meshing, element types, etc., is also conceivable. Numerous result variables and display modes in the solver offer further possibilities for evaluation. For example, the complete three-dimensional scan of the experimental samples could be used to compare the sheet thicknesses of the individual areas by means of GOM Inspect. In any case, the simulations should be repeated with other FE software, as all results explicitly only refer to Simufact Forming and material E235.
All in all, pure SPIF failure simulations are still problematic, at least in Simufact Forming, and are theoretically geometry independent. With a reliable TRFD, however, they become almost dispensable, as this indicates at which critical wall angle failure can generally occur for the material. It is true that the ultimate crack initiation is determined by how far and at what angle further deformation takes place in the depth direction after the limiting angle has been reached. However, this always depends on the geometry in each individual case. The structural strength of the sheet is generally severely weakened by significant thickness reduction from the critical point; for an absolutely process-safe design, which should always be the goal in practice, the TRFD can, therefore, always be used. The TRFD as a newly developed tool for failure prediction for SPIF processes thus also offers itself for future use, as it specifically offers the user a simple possibility for checking the targeted forming stylus and sheet thickness as well as for component checking/design with regard to the maximum wall angle via a kind of “process window”. In this context, however, it still has to be checked whether a sheet thickness change for the variation in RSPIF would achieve the same results as a corresponding change in the forming stylus radius, which is not directly evident from the dimensionless key figure. The usability of the TRFD for the design of SPIF parts and processes is being verified in current research projects for various materials.
Based on the findings presented, the work is aimed both at researchers in the field of SPIF and at the still few practical users, e.g., in the fields of car body part production, medical technology or design. In the process, it shows the numerous correlations in component failure as well as the necessity of its exact prediction and presents practicable dependency relationships. Only through an exact understanding of the mechanisms that occur and their effects, it would ultimately be possible to permanently establish SPIF in the industrial environment of sheet metal forming as an equal process to the classic production methods. In this sense, the work provides a new contribution for further intensive research and is explicitly intended to serve as a basis for constructive and derivative investigations in this versatile, promising field.


 ,
, 


