Proceeding Paper

Characterization of Hand Gestures by a Smartphone-Based Optical Fiber Force Myography Sensor †

School of Mechanical Engineering, University of Campinas, São Paulo 13083-860, Brazil
*
Author to whom correspondence should be addressed.
Presented at the 7th Electronic Conference on Sensors and Applications, 15–30 November 2020; Available online: https://ecsa-7.sciforum.net/.
Eng. Proc. 2020, 2(1), 46; https://doi.org/10.3390/ecsa-7-08178
Published: 14 November 2020
(This article belongs to the Proceedings of 7th International Electronic Conference on Sensors and Applications)

Abstract

:
In this paper, a smartphone-integrated, optical fiber sensor based on the force myography technique (FMG), which characterizes the stimuli of the forearm muscles in terms of mechanical pressures, was proposed for the identification of hand gestures. The device’s flashlight excites a pair of polymer optical fibers and the output signals are detected by the camera. The light intensity is modulated through wearable, force-driven microbending transducers placed in the forearm and the acquired optical signals are processed by an algorithm based on decision trees and residual error. The sensor provided a hit rate of 87% regarding four postures, yielding reliable performance with a simple, portable, and low-cost setup embedded on a smartphone.

1. Introduction

Monitoring hand movements is essential for several technological applications, such as teleoperation of robots, rehabilitation of patients, and the implementation of intuitive user–system interfaces [1]. Although this task can be accomplished with glove-based sensors or optical tracking, myography techniques allow determining the forces and postures of the hand (or even the intentions of movement) in a precise and non-invasive way [1,2].
The force myography (FMG) was proposed as a mechanical counterpart to surface electromyography (sEMG). In the FMG, muscle stimuli are detected in the form of radial pressures, enabling the identification of movements without using an exaggerated number of channels or intensive signals preprocessing [3]. The radial pressures from the forearm muscles generate modulated optical signals, since the microbending of optical fibers causes loss of transmitted light intensity [4].
Using such a phenomenon, a bench-top optical force myography sensor was proposed for the characterization of human hand movements. In previous works, an FMG system based on a bulky fiber optic sensor was developed, allowing the identification of up to 11 postures with an accuracy of 99.7% [5,6]. The present study, however, aimed to develop a system based on a more accessible platform and with a simplified processing approach: a ubiquitous smartphone. Moreover, recent research reveals an increasing trend of applying smartphone-based sensors to several areas including biomedical applications and mechanical structure monitoring [7,8,9]. Hence, with many emerging functions, such as image acquisition, light source, local processing, wireless communication, and so on, the smartphone platforms figure is highly versatile and promising hardware for sensing.
In this work, an optical fiber force myography sensor embedded in a smartphone device is proposed for the characterization of human hand gestures. A mobile application for the acquisition, processing, and classification of the optical signal was developed and tested for evaluating its sensitivity and temporal response. Subsequently, experiments were performed with four different hand postures and their classification was performed by an algorithm based on a decision tree. Finally, the hit rates of the classifier were quantified, and their characteristic operating curves (ROC curve) were investigated to evaluate the sensor performance.

2. Materials and Methods

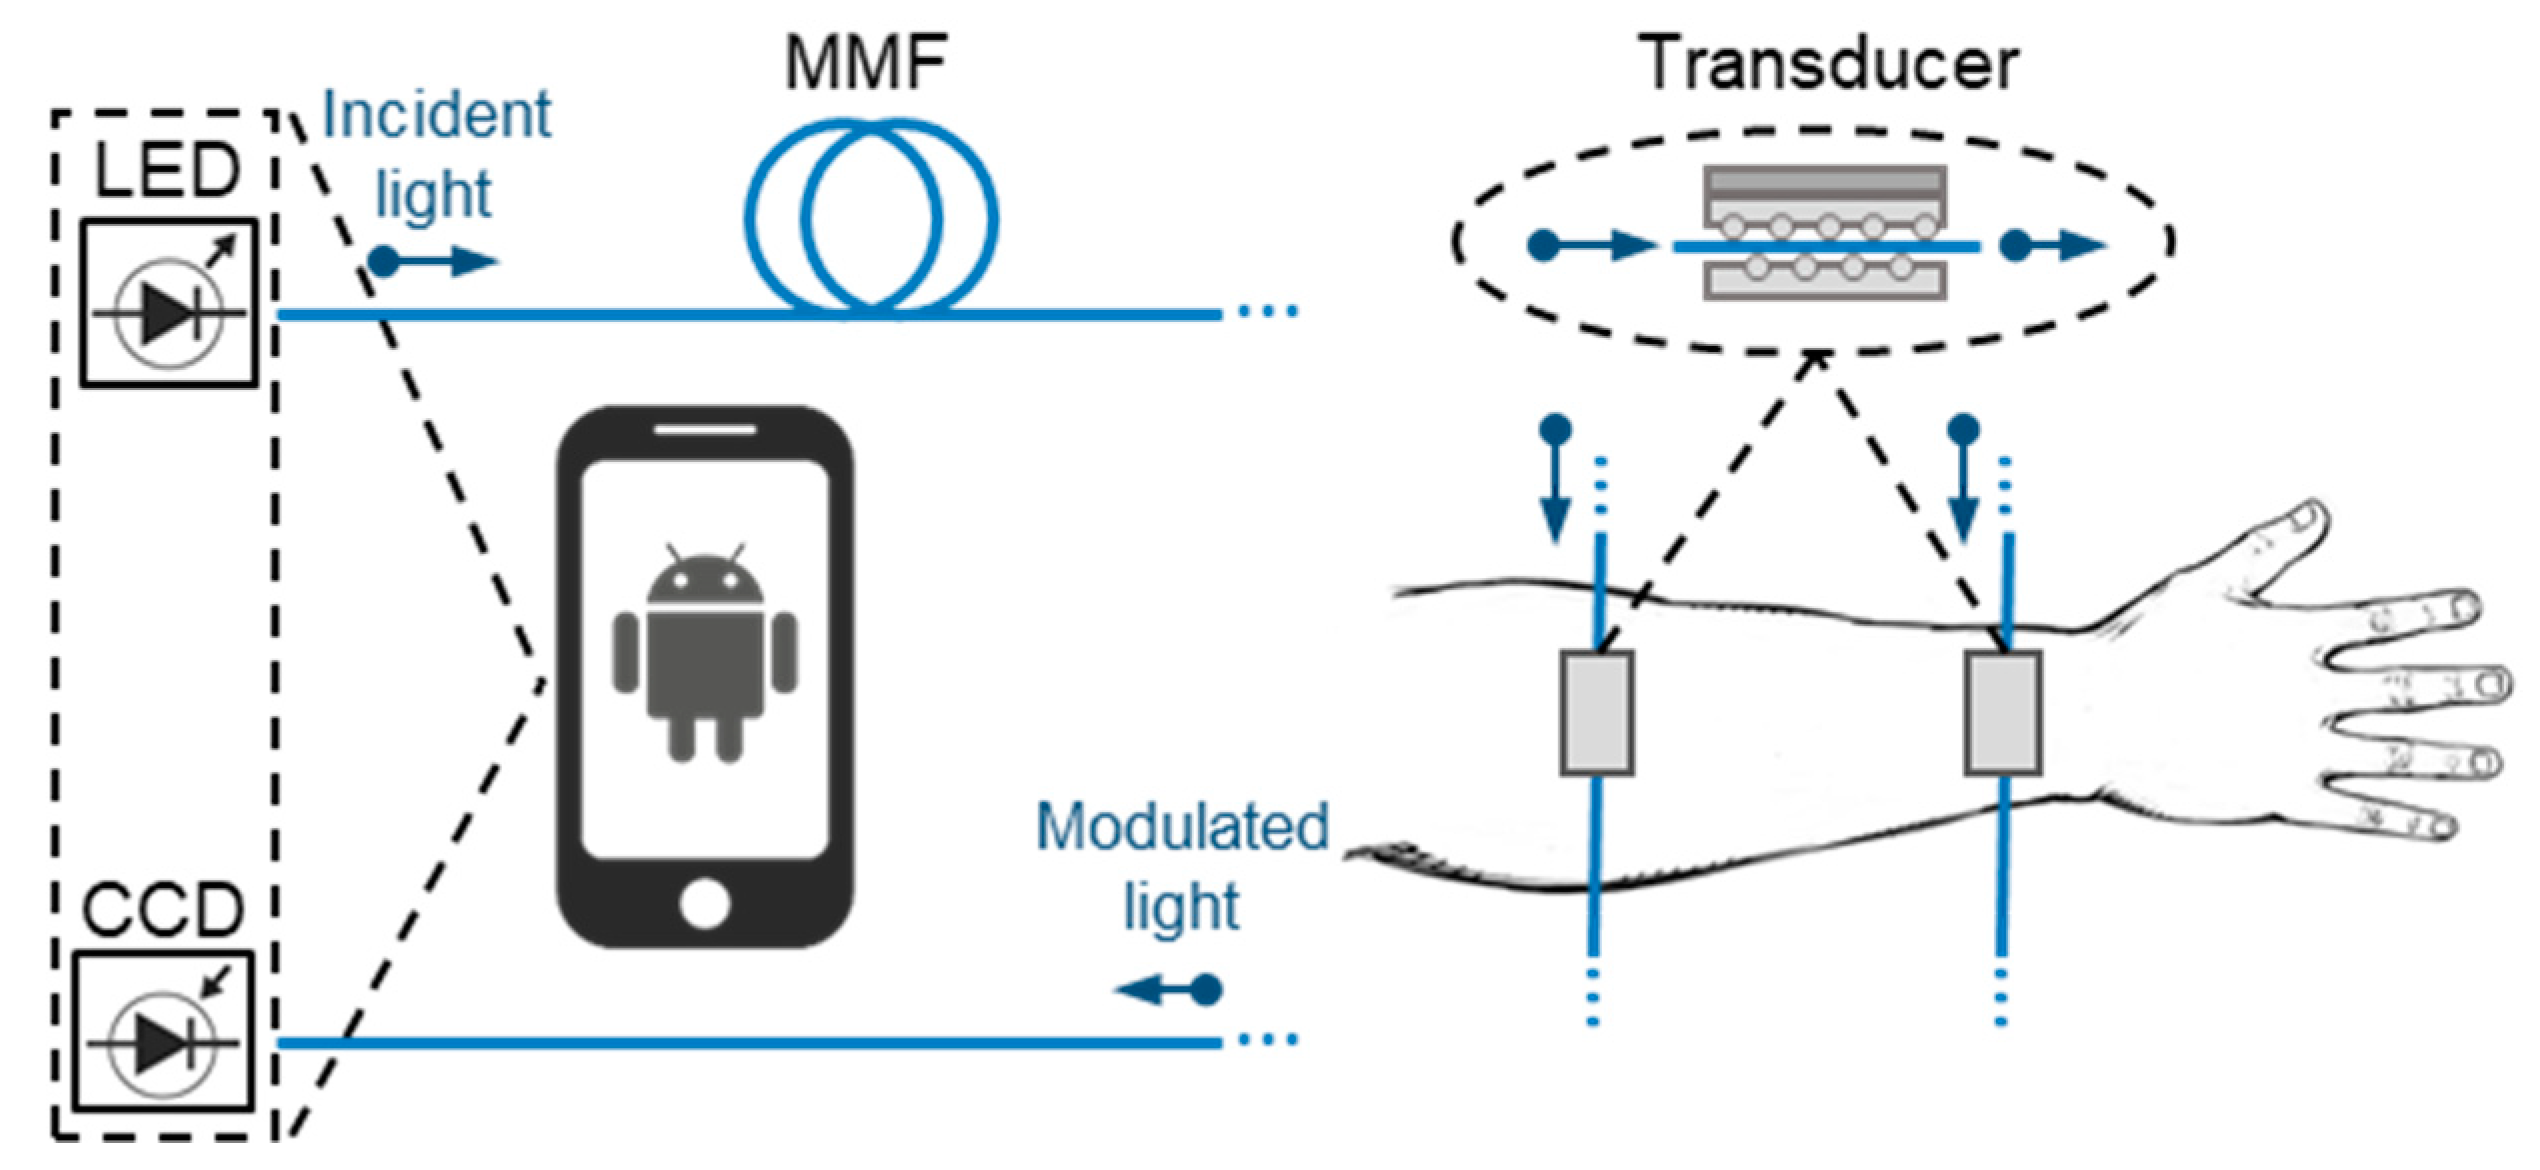
2.1. Experimental Setup

The experimental setup, shown in Figure 1, consists of a white light-emitting diode (LED) that excites a pair of multimode poly(methylmethacrylate) (PMMA) optical fibers. The waveguides are attached to the user’s forearm by force-driven microbending transducers. The fibers’ end faces are positioned perpendicularly to the receiver, and the smartphone’s charged coupled device camera (CCD) captures image frames of the output light. Once both the light source and the camera are part of the smartphone, the optical coupling is done through a 3D-printed case manufactured for the device. The hardware in which the system was integrated is an Android mobile with OS version 8.1. It contains a chipset Snapdragon 660 Qualcomm SDM660, 4 GB RAM, and a 12 Mp camera which is used for the frame acquisition at a resolution of 1280 × 720.
To determine postures and movements in a pre-defined set of patterns, an initial calibration must be performed for each user. These adjustments are indispensable due to the intrinsic singularities among subjects. A movement may demand a different degree of flexion for each person, for example, yielding variations of light intensity for the same movement [10,11]. As shown in Figure 1, the two microbending transducers [6] are placed on extensor muscles of the forearm and tied with Velcro straps, applying a moderate preload and avoiding the discomfort of the user. Furthermore, the positioning of the transducers is performed by palpating the muscles, seeking to maximize the sensitivity regarding the tested movements. The experiments were performed according to the Ethical Committee recommendations (CAAE 17283319.7.0000.5405).

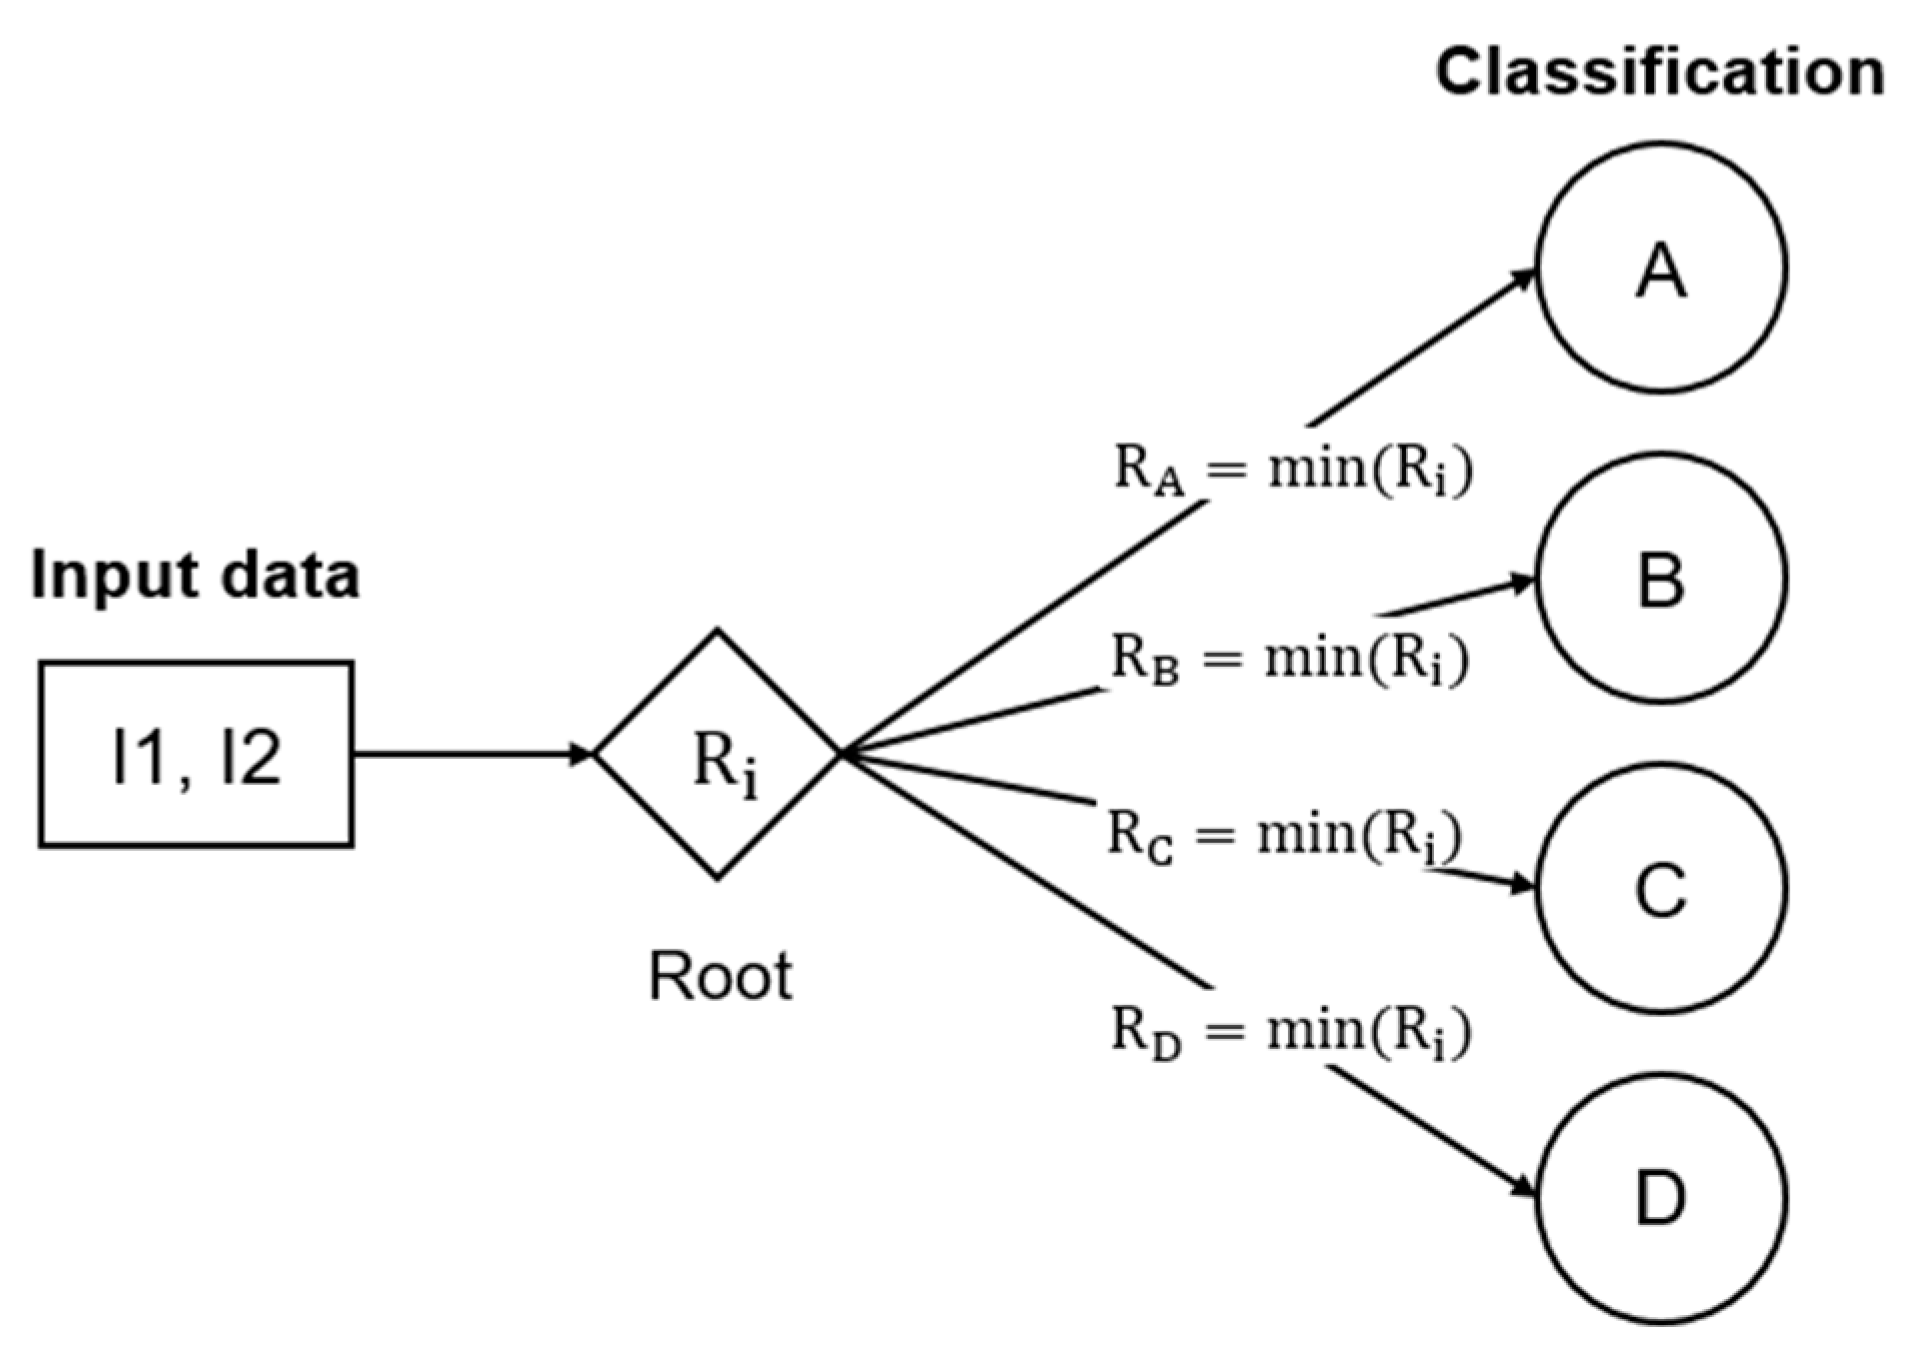
2.2. Application and Pattern Recognition

The software for data acquisition and processing was developed on the Android API 27, which is compatible with versions 8.1 and higher. Also, only standard Java and Android libraries were used to avoid compatibility errors and excessive processing by the device. Although there are many available image-processing libraries, like OpenCV, for the approach used in this work, the standard libraries performed well. Hence, the application has an intuitive interface and fast processing, whose main functionalities can perform satisfactorily in any ordinary smartphone. As soon as the main activity is started, the camera preview is started, showing the frames captured by the CCD. The application data processing is done in real-time, and the user can select the window resolution, frame-sampling period, as well as the camera focus on the interface (parameters that can generate great variability in measurements when not normalized). Such adjustments must be performed before starting a measurement, but can also be modified during the experiment. Besides, the application also has a calibration mode that performs the routine of recording posture patterns.
The frames are captures in bitmap format with a sampling interval T (ms); then, windows referring to the two optical channels sections are highlighted and these sub-bitmaps are analyzed for their intensity in RGB,
I ( x i , y i ) = | R i ,   G i , B i | ,
Im = i = 1 n I ( x i , y i ) n ,
where I(xi, yi) is the intensity of the i-th pixel of components Ri, Gi, Bi; n is the number of pixels contained in the bitmap. Thus, on the decimal basis, R, G, B ∈ [0, 255], then the intensity values can vary from 0 (black) to 441 (white).
The application must be able to classify patterns in the pre-fixed set of postures according to the sampled intensity data. To perform this task, several algorithms could be used, for example, artificial neural networks that have already been used in past works [12]. However, a complex classification method comes up against the hardware and processing limitations of the smartphone. Hence, a simplified approach based on the normalized sample residue is proposed: it consists of calculating the residue for each sampled point to the calibrated postures and normalizing it by the total residue,
R i = | I i Im |     | I j Im | ,
where Ri is the normalized residue of an acquired data point Im to the i-th pattern; Ij is the j-th pattern. Essentially, the technique is based on a decision tree, where the decisions are made based on the minimal normalized residue. Such classifiers are used satisfactorily in several areas such as the classification of radar signals, character recognition, remote sensing, medical diagnostics, and speech recognition [13]. These classifiers show the ability to make a complex decision process into several simplified decision subprocesses, generating a solution that is simpler to interpret and to model. However, for the methodology adopted in this work, an extensive tree was not necessary, so that: level 0 is the root and level 1 is the target postures of the classification (Figure 2). This makes the classifier very fast, as required by the hardware. Nevertheless, such a technique allows that, while new postures are added and the sensor is used for other applications, subsequent tree levels can be added for further refinement of the classifier.

3. Results

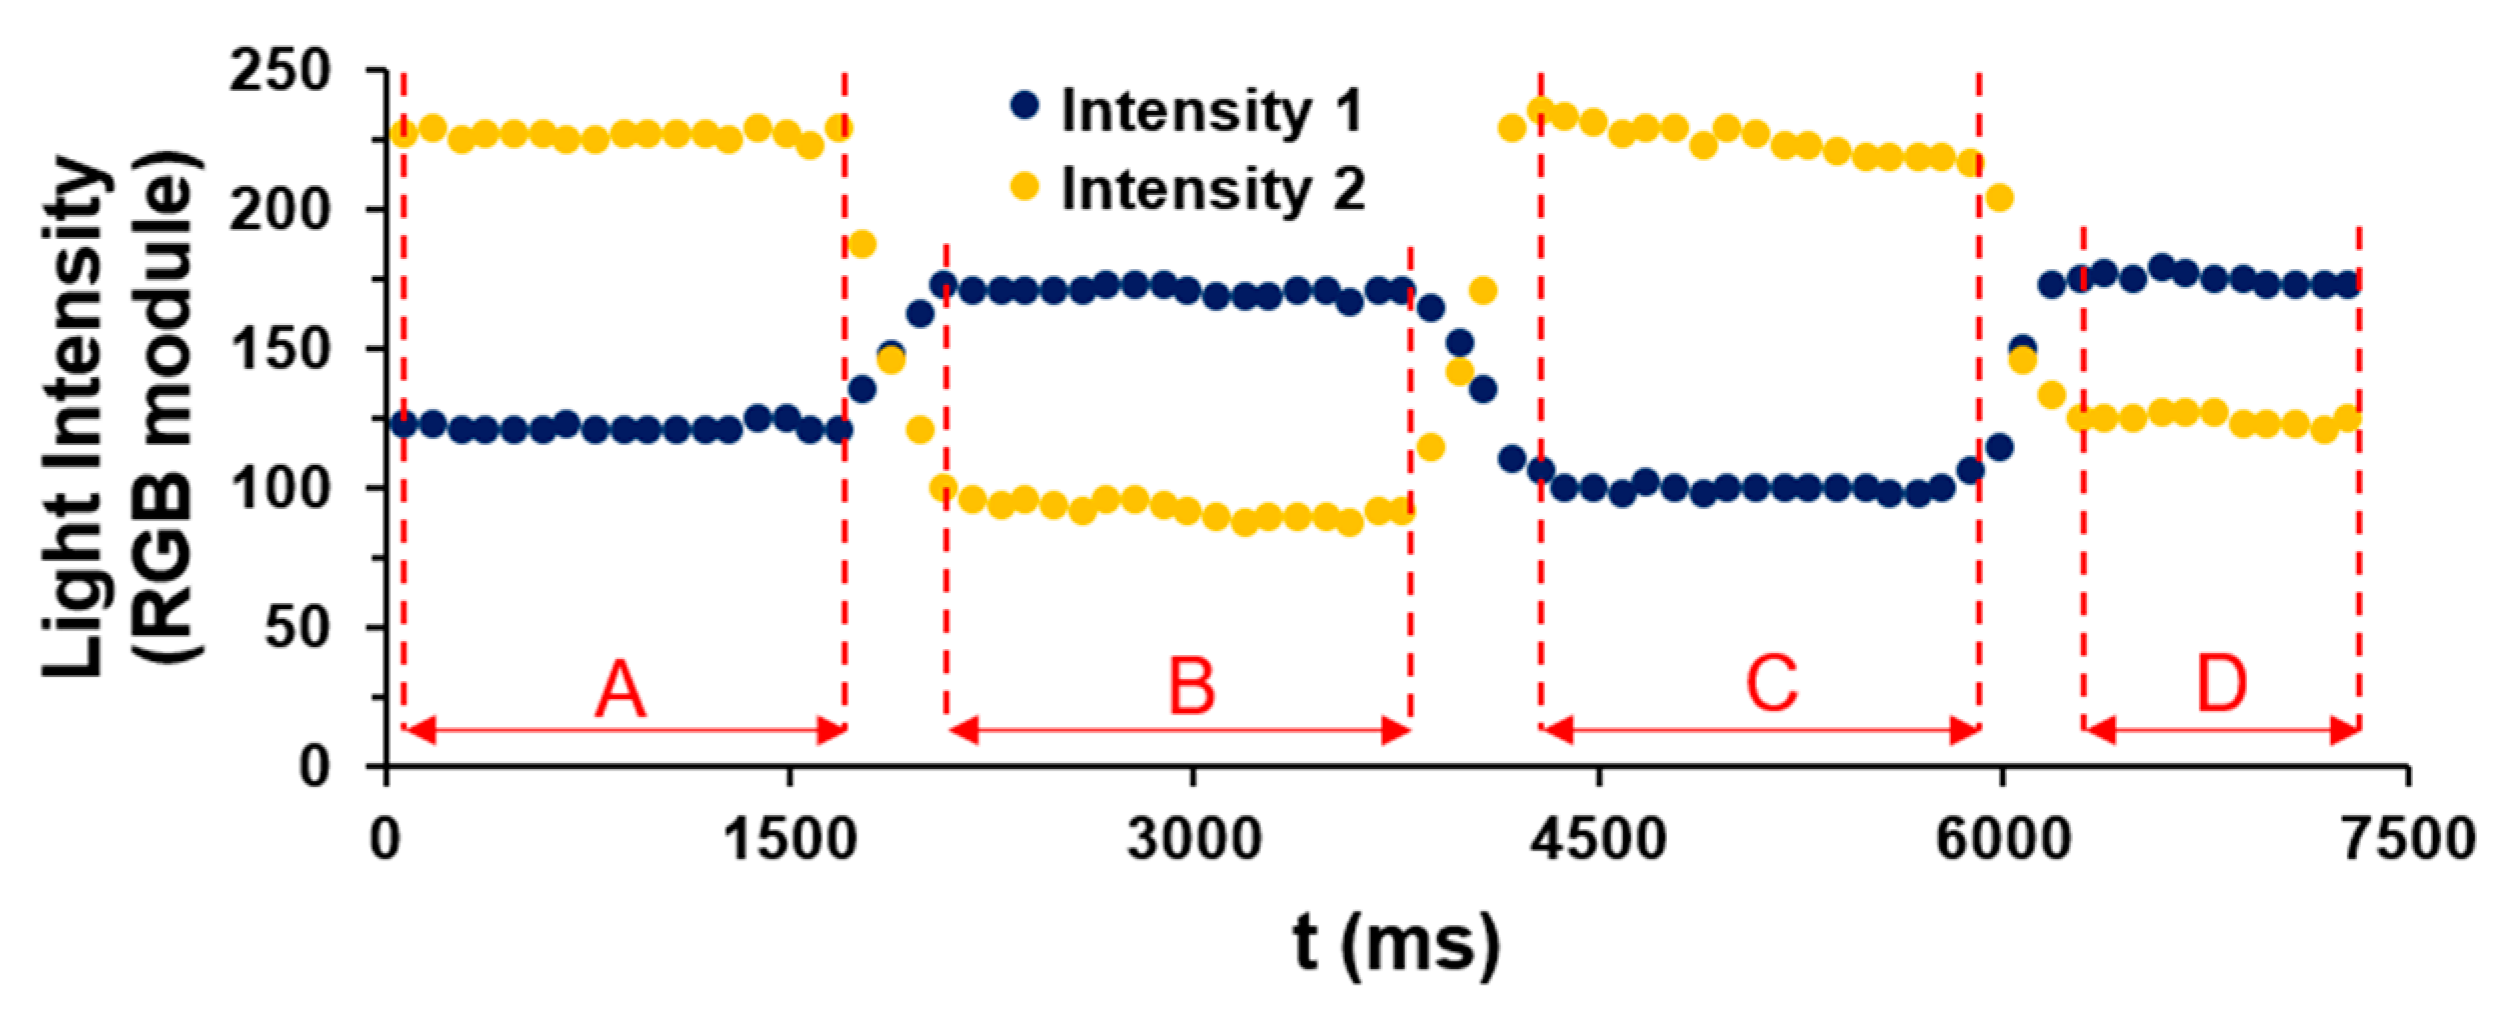
3.1. Measurement of FMG signals

The application comprises 4 possible patterns for classification, and the postures chosen for carrying out the experiments are shown in Figure 3a. It is worth noticing that the sensor can be used to classify additional postures as long as there is no ambiguity between the intensity signals. The static calibration of the microbending transducer provided a linear response to mechanical deformations and low hysteresis (Figure 3b), even for high amplitude stimuli.
The intensity signals recorded in the calibration routine for a given measurement are shown in Figure 4. The user maintained each posture for ~2 s, while the sensor measured the average signals and saved the patterns A, B, C, and D, respectively. We notice that each posture presents a characteristic [I1, I2] pair, confirming that there are no apparent ambiguities between the patterns. Furthermore, in the present experiment, it was possible to observe good signal stability, with variations of <1%. Although the presented data refer to a specific measurement, once the transducers are positioned in the same muscles on the user’s forearm and the setup operates with the same calibration, signals with the same characteristics are expected.

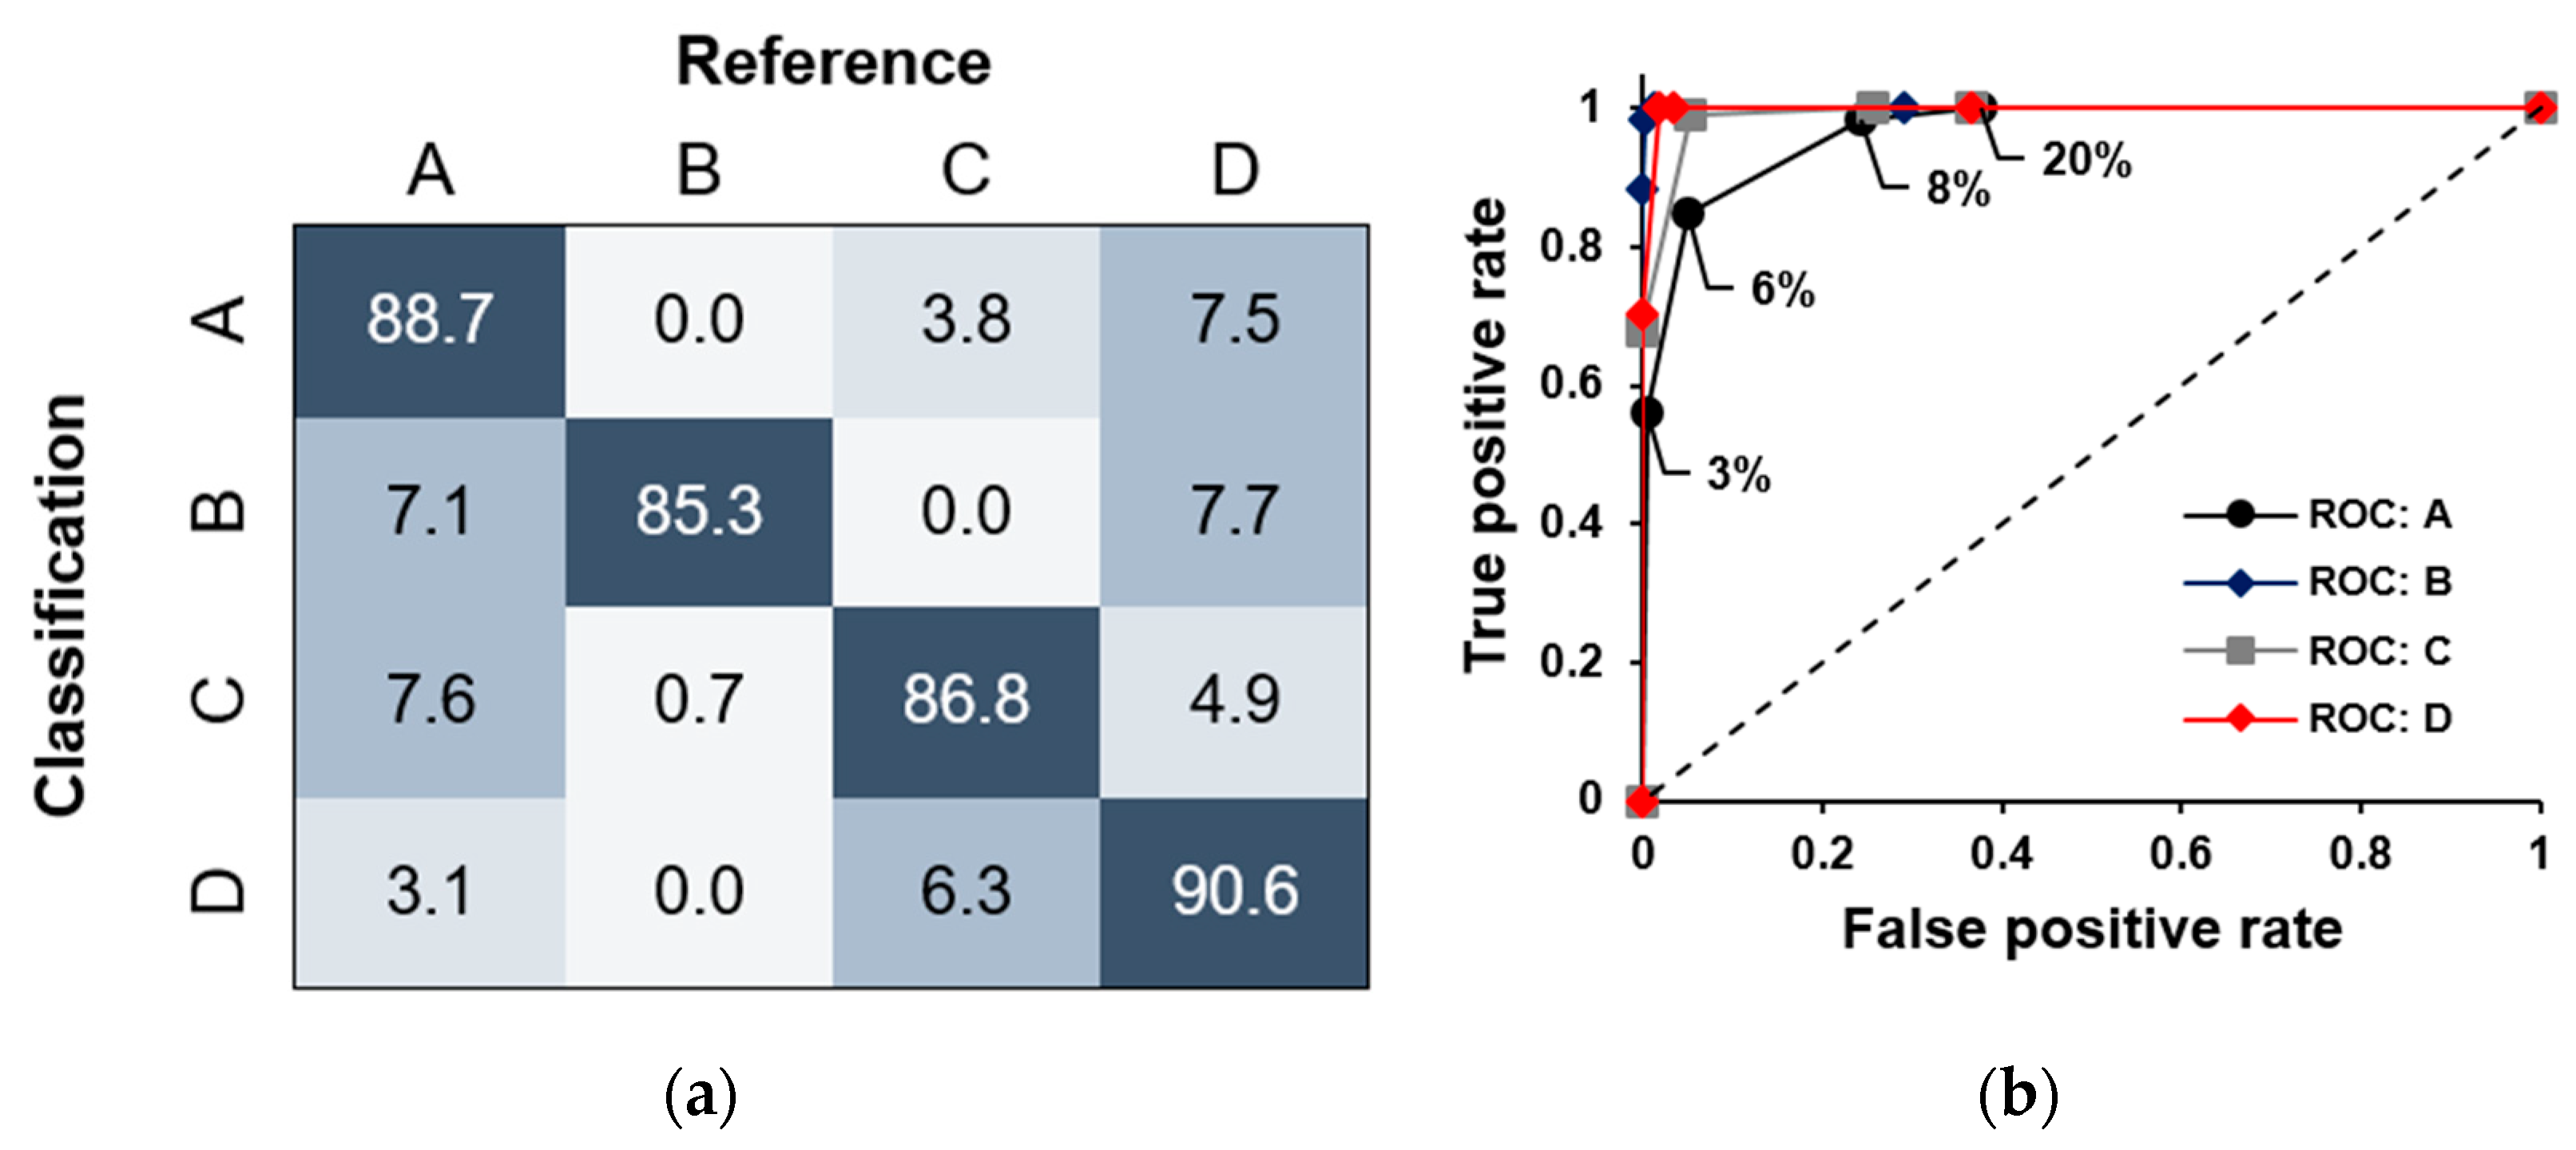
3.2. Gesture Classification

The main objective of the work was to produce a reliable sensor with an acceptable hit rate. Random sequences of movements were performed to obtain an estimate of the classifier performance. In total, 40 movements were performed in which the postures were maintained for approximately 2 s, totaling 500 measurements (including posture transitions) with a sampling period of 100 ms. Regarding the classification threshold, an intensity cut-off limit of 8% was arbitrated to perform pattern recognition. The results of the experiments are shown in Figure 5a, where it is possible to verify an average hit rate of ~87%. Once the classification does not treat movement data as exceptional cases (but as ordinary posture points), mostly errors are perceived during posture transitions. Therefore, if those points were excluded in an intermediate treatment, the hit rate of the sensor would reach values close to 97%.
Moreover, for the given data set, the receiver’s characteristic operating curves (ROC curves) were established to observe the classifier’s performance regarding the residual cut-off limit. These results are shown in Figure 5b. The curves were obtained taking into account the classification deviations of 3%, 6%, 8%, and 20%, in addition to the extreme values of 0% and 100%. It turns out that the curves are extremely close to the ideal (area below the curve close to 1), indicating that the classifier performs adequately. Furthermore, the intermediate points referring to the limits of 6% and 8% present TPR (true positive rate) close to 1 to an FPR (false positive rate) below 0.5, confirming that the choice of the classification threshold of 8% is correct. Besides, there is also a sharp drop in the TPR for the lowest cut-off limit of 3%, while for the 20% limit the highest rate of false positives is obtained, as well as a too wide a range is verified. Although the ROC curves were constructed independently for each one of the postures, the classification of the patterns occurs together, so that the general classifier presents an even lower threshold than that verified for the isolated patterns.

4. Conclusions

A compact, versatile, and simple optical fiber force myography sensor based on a smartphone for the classification of gestures of the human hand was successfully developed. A 3D-printed case was manufactured to perform the optical coupling and to provide stable conditions for data acquisition and noise minimization. For the acquisition and processing of data, an Android application was developed to measure and classify the data. Next, a set of measurements with pre-defined posture patterns were performed to test and validate the developed sensor, yielding a ~87% hit rate for identifying four hand postures. In future studies, the complete reconstruction of movements and the integration of the sensing system with actuators will be addressed. An approach with finite state machines [14] has been tested for monitoring movement sequences and has generated promising results. Despite the general approach used in this work, the sensing applications are numerous and extend from the assistance in physiotherapy sections to the advanced control of mechatronic devices.

Author Contributions

Conceptualization, M.S.R. and E.F.; methodology, E.F.; software, M.S.R.; validation, M.S.R. and P.M.L.; formal analysis, M.S.R.; investigation, M.S.R.; resources, P.M.L.; writing—original draft preparation, M.S.R. and M.C.P.S.; writing—review and editing, M.S.R., M.C.P.S. and E.F. All authors have read and agreed to the published version of the manuscript.

Funding

This work was supported in part by PIBIC/CNPq and in part by FAPESP under grant 2017/25666-2.

Conflicts of Interest

The authors declare no conflict of interest.

References

  1. DiPietro, L.; Sabatini, A.M.; Dario, P. A Survey of Glove-Based Systems and Their Applications. IEEE Trans. Syst. Man, Cybern. Part C Appl. Rev. 2008, 38, 461–482. [Google Scholar] [CrossRef]
  2. Chowdhury, R.H.; Reaz, M.B.I.; Ali, M.A.B.M.; Bakar, A.A.A.; Chellappan, K.; Chang, T.G. Surface Electromyography Signal Processing and Classification Techniques. Sensors 2013, 13, 12431–12466. [Google Scholar] [CrossRef] [PubMed]
  3. Craelius, W. The Bionic Man: Restoring Mobility. Sci. 2002, 295, 1018–1021. [Google Scholar] [CrossRef] [PubMed]
  4. Boechat, A.A.; Su, D.; Hall, D.R.; Jones, J.D. Bend loss in large core multimode optical fiber beam delivery systems. Appl. Opt. 1991, 30, 321–327. [Google Scholar] [CrossRef] [PubMed]
  5. Fujiwara, E.; Wu, Y.T.; Santos, M.F.M.; Schenkel, E.A.; Suzuki, C.K. Optical Fiber Specklegram Sensor for Measurement of Force Myography Signals. IEEE Sens. J. 2016, 17, 951–958. [Google Scholar] [CrossRef]
  6. Fujiwara, E.; Suzuki, C.K. Optical Fiber Force Myography Sensor for Identification of Hand Postures. J. Sens. 2018, 2018, 8940373. [Google Scholar] [CrossRef]
  7. Liu, Y.; Liu, Q.; Chen, S.; Cheng, F.; Wang, H.; Peng, W. Surface Plasmon Resonance Biosensor Based on Smart Phone Platforms. Sci. Rep. 2015, 5, 12864. [Google Scholar] [CrossRef]
  8. Sun, A.; Venkatesh, A.G.; Hall, D.A. A Multi-Technique Reconfigurable Electrochemical Biosensor: Enabling Personal Health Monitoring in Mobile Devices. IEEE Trans. Biomed. Circuits Syst. 2016, 10, 945–954. [Google Scholar] [CrossRef] [PubMed]
  9. Kong, Q.; Allen, R.M.; Kohler, M.D.; Heaton, T.H.; Bunn, J. Structural Health Monitoring of Buildings Using Smartphone Sensors. Seism. Res. Lett. 2018, 89, 594–602. [Google Scholar] [CrossRef]
  10. Aagaard, P.; Simonsen, E.B.; Beyer, N.; Larsson, B.; Magnusson, P.; Kjaer, M. Sokinetic muscle strength and capacity for muscular knee joint stabilization in elite sailors. Int. J. Sports Med. 1997, 18, 521–525. [Google Scholar] [CrossRef] [PubMed]
  11. Hayes, K.W.; Falconer, J. Differential muscle strength decline in osteoarthritis of the knee. A developing hypothesis. Arthritis Rheum. 1992, 5, 24–28. [Google Scholar] [CrossRef] [PubMed]
  12. Wu, Y.T.; Gomes, M.K.; Da Silva, W.H.; Lazari, P.M.; Fujiwara, E. Integrated Optical Fiber Force Myography Sensor as Pervasive Predictor of Hand Postures. Biomed. Eng. Comput. Biol. 2020, 11. [Google Scholar] [CrossRef] [PubMed]
  13. Safavian, S.; Landgrebe, D. A survey of decision tree classifier methodology. IEEE Trans. Syst. Man, Cybern. 1991, 21, 660–674. [Google Scholar] [CrossRef]
  14. Brown, S.; Vranesic, Z. Fundamentals of Digital Logic with Verilog Design, 2nd ed.; Mc Graw Hill:: New York, NY, USA,, 2003; pp. 447–463. [Google Scholar]
Figure 1. Overview of the sensor system: LED (flashlight); MMF: multimodal PMMA optical fibers; CCD: charged coupled device camera. The microbending devices are attached to the forearm using Velcro straps.
Engproc 02 00046 g001
Figure 2. Decision tree for the classification of postures (A, B, C, and D) through light intensity data (I1 and I2).
Engproc 02 00046 g002
Figure 3. (a) Hands postures analyzed. A: hand closed; B: hand flat; C: hand flexed up; D: hand flexed down. (b) Optical response to a linear displacement performed by a micrometer attached to the mechanical transducer. The instrument was varied from 0 to 0.5 mm, then from 0.5 to 0 mm, such that the sensor showed approximately the same intensity response of ~ΔI/Δx=46 mm-1 for both directions.
Engproc 02 00046 g003
Figure 4. Light intensity signals of the optical fiber channels over time.
Engproc 02 00046 g004
Figure 5. (a) Confusion matrix. (b) Receiver’s characteristic operating curves (ROC curves) referring to posture classifications for different threshold limits (indicated in the ROC curve: A).
Engproc 02 00046 g005
Publisher’s Note: MDPI stays neutral with regard to jurisdictional claims in published maps and institutional affiliations.

