Abstract
The use of wireless sensor networks (WSN) to address and improve the environmental quality of the built environment is gaining more and more prominence in modern cities. In this scope, our work aims to assess the spatial variability of local climate in relation to the urban morphology and the distribution of materials and vegetation. Furthermore, on-site measured data have been exploited to run and benchmark numerical models for the simulation and visualization of multiple climate parameters, such as outdoor thermal comfort.
1. Introduction
With the diffusion of the Smart City concept, the deployment of IoT technologies for monitoring purposes is spreading in urban areas. Within this trend, microclimate monitoring for understanding thermal conditions and identifying/coping with the phenomena of urban heat island (UHI) in cities is gaining relevance. In parallel, the use of numerical models for simulating local climate conditions allows expanding the analysis to broader urban areas than the one monitored, also addressing a wider set of variables, which is sometimes difficult to sample with proper spatiotemporal resolution (e.g., wind speed, mean radiant temperature, surface temperature, etc.).
The main objectives of this experimental investigation are:
- to quantify the temporal and spatial distribution of air temperature and relative humidity and to study the impact of the urban morphology and surface characteristics on these variables;
- to assess the representativeness and the reliability of a wireless network of low-cost sensors for the purpose of calibrating computational microclimate models;
- to exploit numerical simulations for expanding the microclimate and thermal comfort analysis to a broader area than the monitored one.
2. Materials and Methods
The research analyzed the main microclimate parameters in summer conditions. It included four main steps:
- Set up and deployment of the low-cost wireless sensor networks (WSN);
- Continuous field measurement at 17 points in the studied area to analyze the local weather conditions;
- Numerical simulations of microclimate variables;
- Numerical model evaluation.
2.1. Case Study Area
The study was conducted in the industrial area in Bolzano (Italy). The city of Bolzano (UTM 46°29′53.8′′ N, 11°21′17.1′′ E) is in the north-east of Italy. Its climate is categorized as moist continental and is affected by strong seasonal fluctuations, with high temperature and heatwaves during summer. The industrial area covers a surface of 100 ha and is characterized by a high share of impermeable surfaces with low albedo and lack of vegetation. These attributes worsen the summer thermal heat stress conditions, making this specific area the most affected one by urban heat island (UHI) throughout Bolzano.
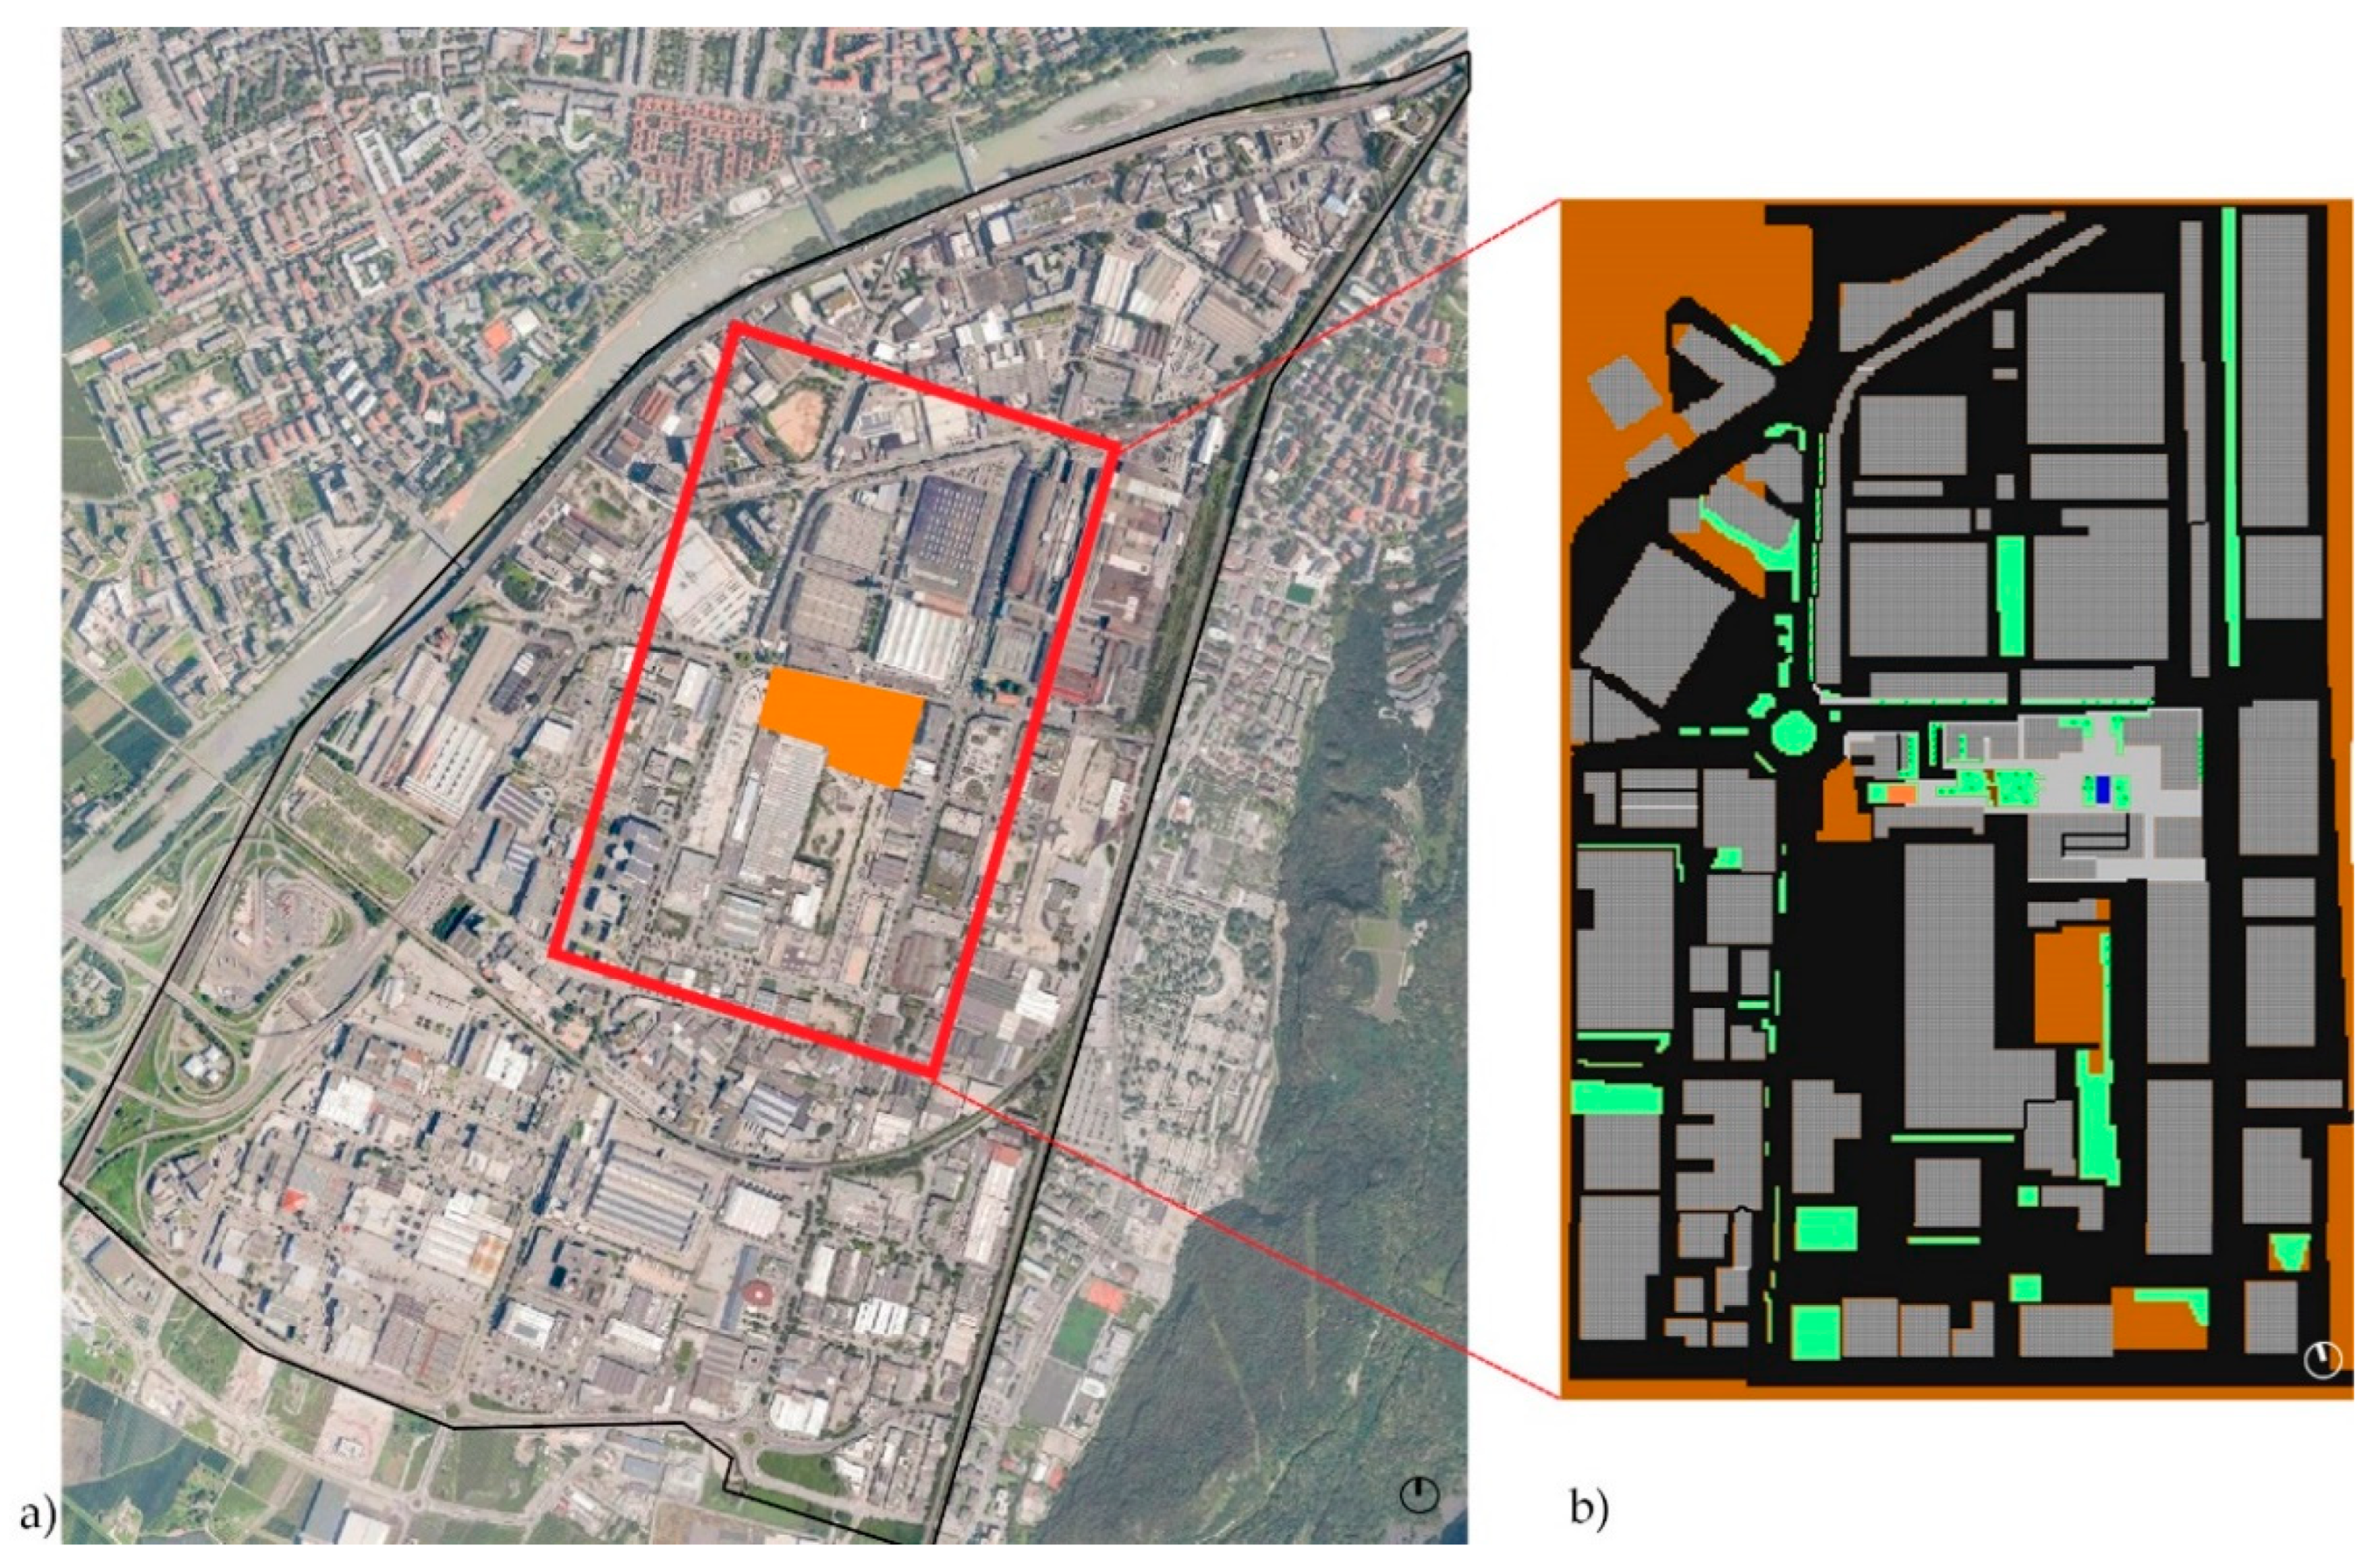
The field measurements were performed in the NOI (Nature of Innovation) Techpark, a building complex located at the center of the industrial area (Figure 1). Instead, the numerical modeling was expanded to include the surrounding urban canyons (Figure 1).
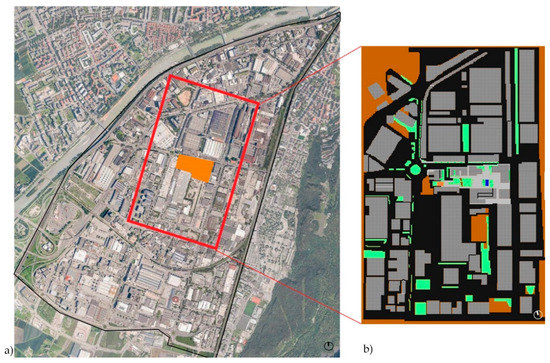
Figure 1.
(a) Bolzano industrial area. The NOI Techpark is highlighted in orange. The area of interest for the numerical simulations is within the red square. (b) Overview of the 3D model of the area of interest, input for the numerical simulations.
2.2. Low-Cost WSN Setup
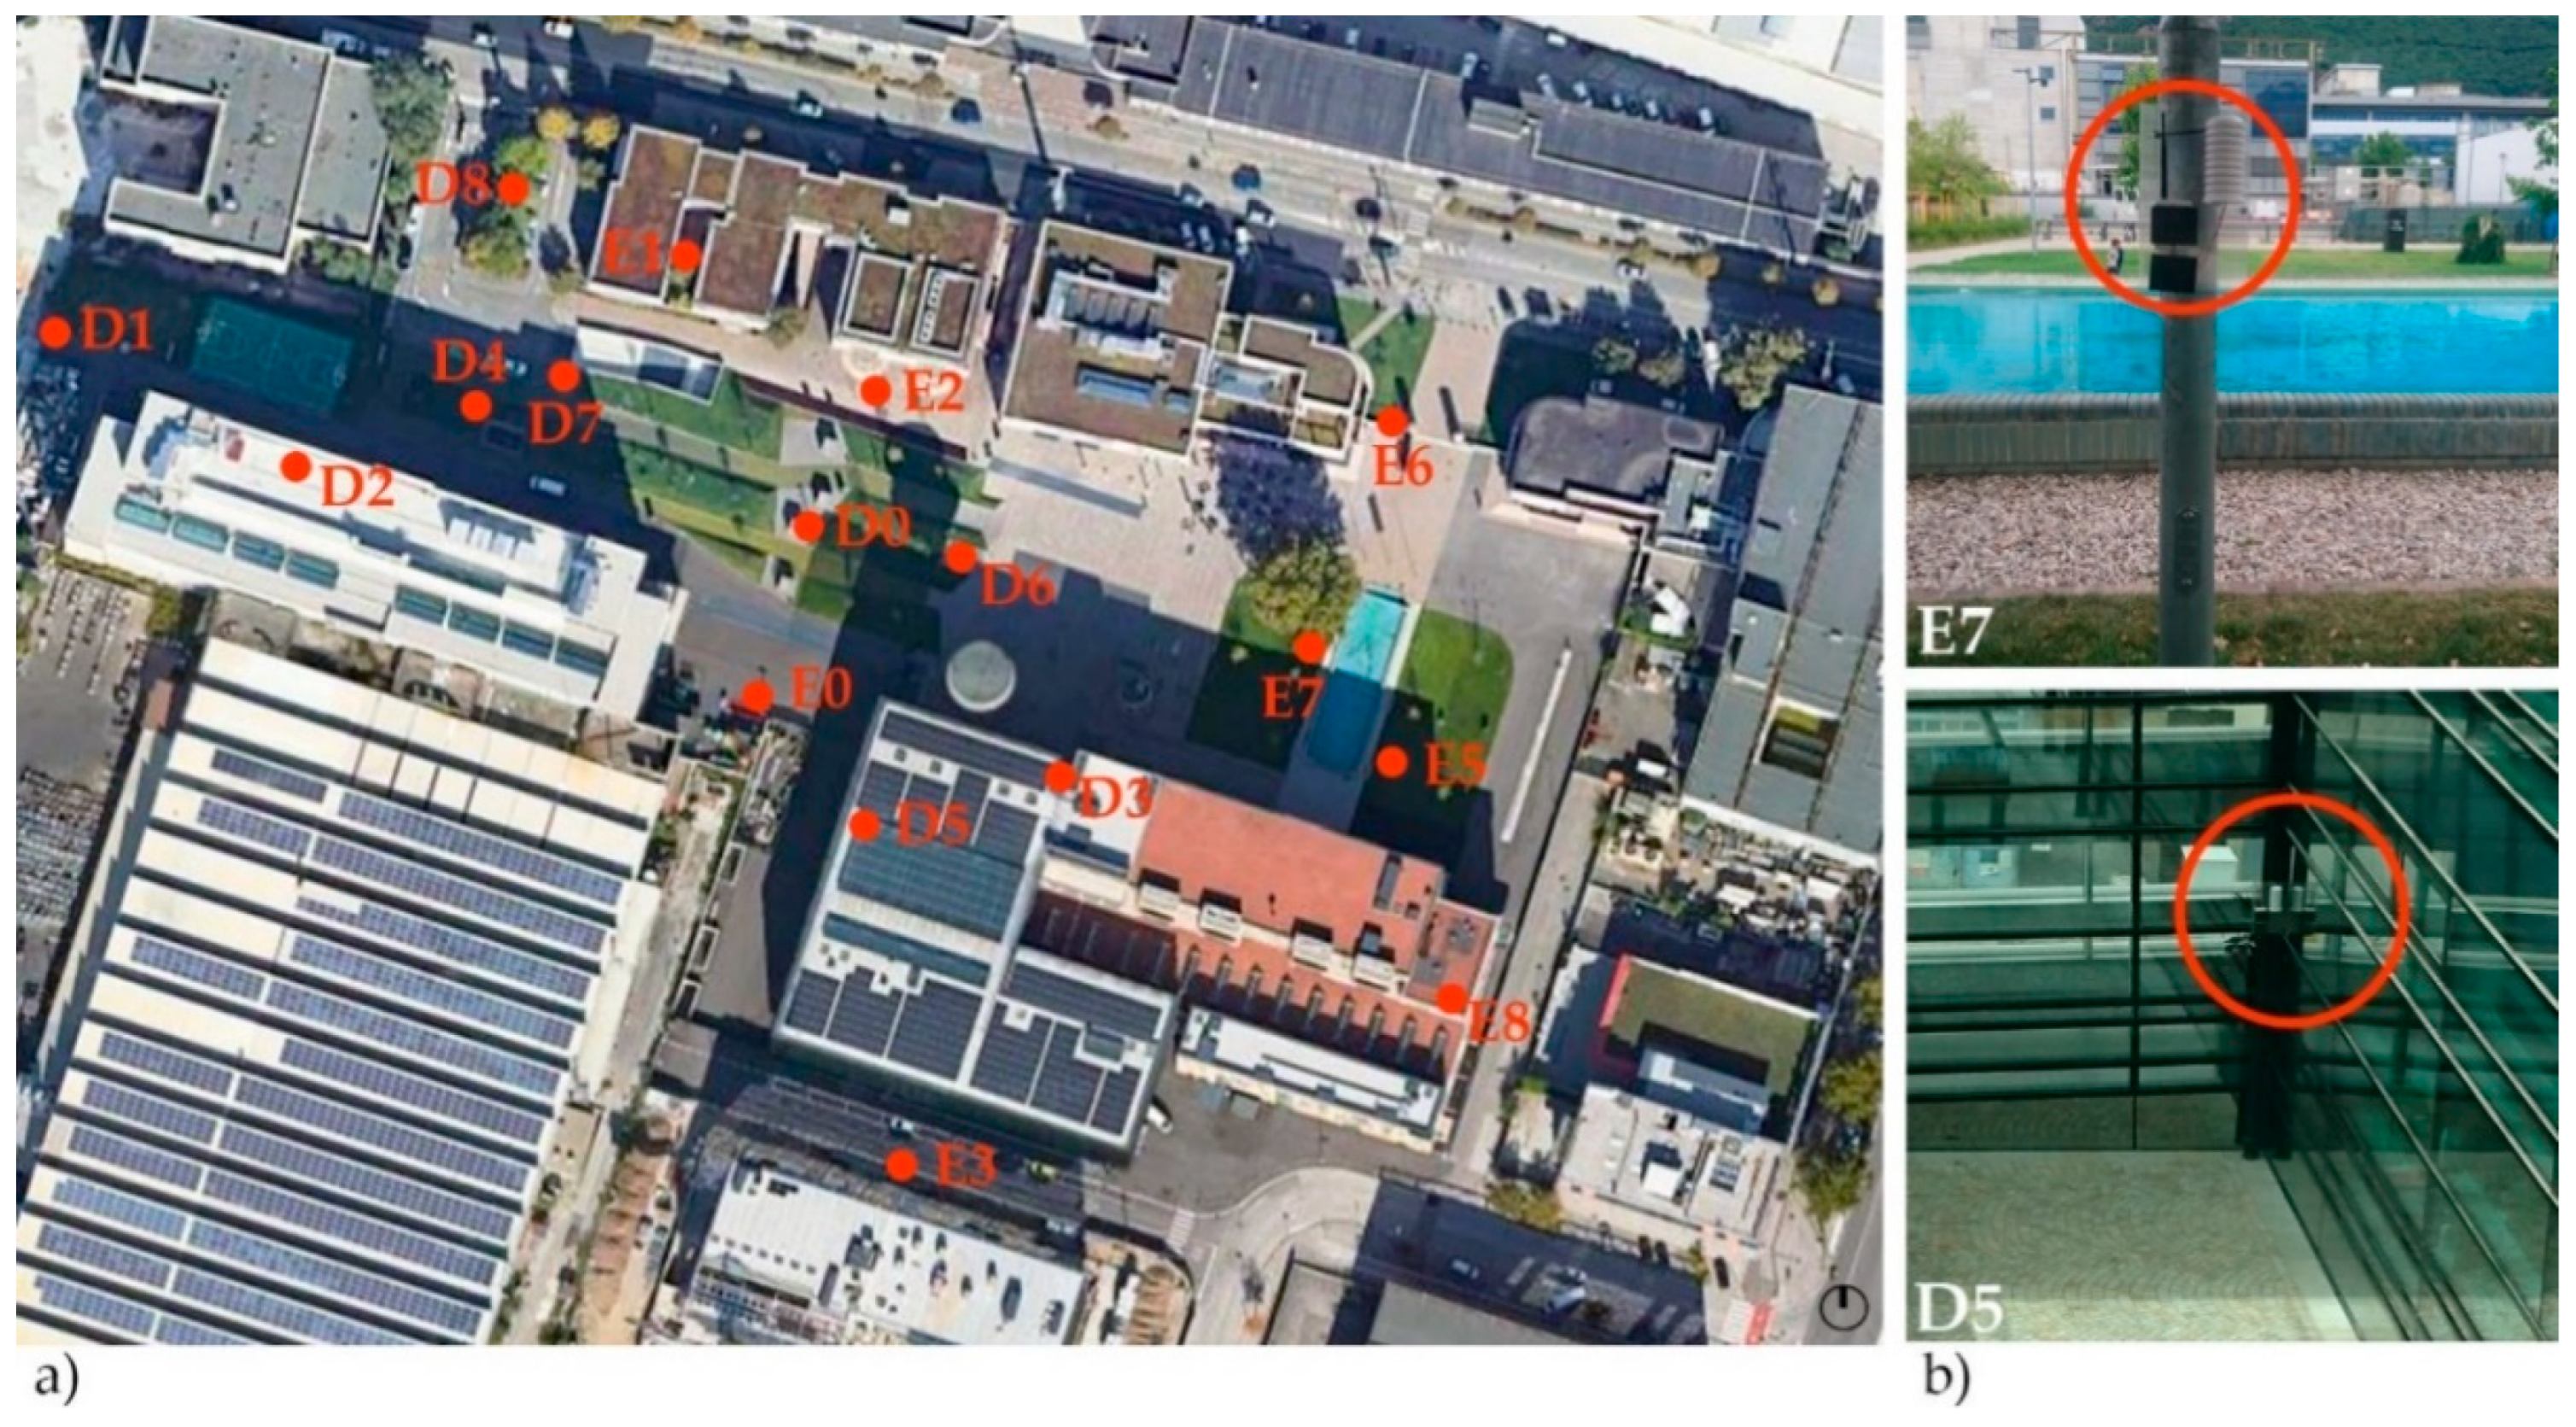
From July 2020, 17 autonomous sensor nodes added to the LoRaWAN network of the technology park [1] were deployed within the NOI area. They are equipped with a Honeywell HIH6121 sensing element with tabulated accuracy of ±4.0% on relative humidity (RH) and ±0.5 °C on temperature (Tair). The nodes are coded to acquire RH and Tair every 10 min and store the data both locally and in the cloud (more details are given in [2]). The WSN covers an area of about 0.04 km2. The measurement point locations (Figure 2) were selected to assess the effects of the different surface materials present there (e.g., asphalt, grass, natural stone, etc.), as well as of the urban morphology characteristics. The sensor nodes have a height between 1.0 and 2.0 m a.g.l., to be representative of the prevailing conditions at pedestrian level (with three exceptions, i.e., two sensors on roofs of buildings with different heights, D2 and E8, and one in a winter garden located at the second floor of the main building, D5).
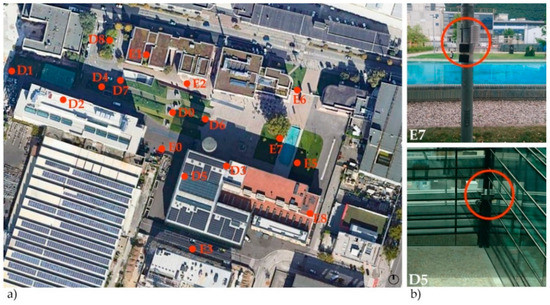
Figure 2.
(a) Positioning of the sensors in the NOI Techpark area. (b) Sensor nodes installed in the central courtyard at the pedestrian level (E7) and in the winter garden on the 2nd floor (D5).
2.3. Numerical Simulation
The numerical model capable of simulating climates in urban environments ENVI-met, version 4.5, was selected for the analysis of the microclimate conditions in the district. ENVI-met is a 3D prognostic microclimate model that predicts the surface-vegetation-atmosphere interactions in urban complex environments with spatial resolution from 0.5 to 10 m and temporal resolution from 5 to 10 s [3]. The core of Bolzano’s industrial area, including NOI Techpark and the surrounding urban canyons, was meshed with a step of 3 m in all directions, resulting in a modeling area of 240 × 358 × 21 elements (Figure 1. (a) Bolzano industrial area. The NOI Techpark is highlighted in orange. The area of interest for the numerical simulations is within the red square. (b) Overview of the 3D model of the area of interest, input for the numerical simulations.). The search domain is then 720 × 1074 × 63 m.
The microclimate simulations were carried out exploiting a local weather station for input data. August 21, 2020, was selected as one of the most representative days for typical hot summer conditions (i.e., max(Tair) ≥ 30 °C, min(Tair) ≥ 20 °C, and clear sky). The output of the numerical simulations was used for evaluating human comfort at the pedestrian level by means of the universal thermal climate index (UTCI) [4].
3. Results and Discussion
For the purpose of this study, the analysis of the results has been limited to 21 August 2020. On this date, the sensor nodes present no or very limited saturation (max 2 consecutive measures, i.e., 20 min and max 2 times in a day). Besides, a limited packet loss ratio has been encountered (max 12%). Hence, the data are suitable for comparison with the microclimate numerical simulations.
3.1. Spatial Distribution of Microclimatic Variables
The spatial distribution of air temperature in the different measurement points (Table 1) highlights the influence of the surface materials and morphological features on the local climate conditions. Sensors located in points with high solar irradiance and close to impermeable surfaces (i.e., D2, E2, and D1) have registered the highest Tair. With regard to urban morphology, sky view factor (SVF, i.e., a portion of sky visible from a specific point inside the urban area) and aspect ratio (H/W, i.e., the ratio of the mean building height H to road width W) have been considered. The locations with low SVF (i.e., D6 and D8) and the sensors located in closed or semi-enclosed spaces (i.e., D3 and D5) have registered the lowest temperatures.

Table 1.
Morphological characteristics and daily values measured by the sensor nodes on 21st August 2020. The highest and lowest values are highlighted, respectively, in orange and light blue.
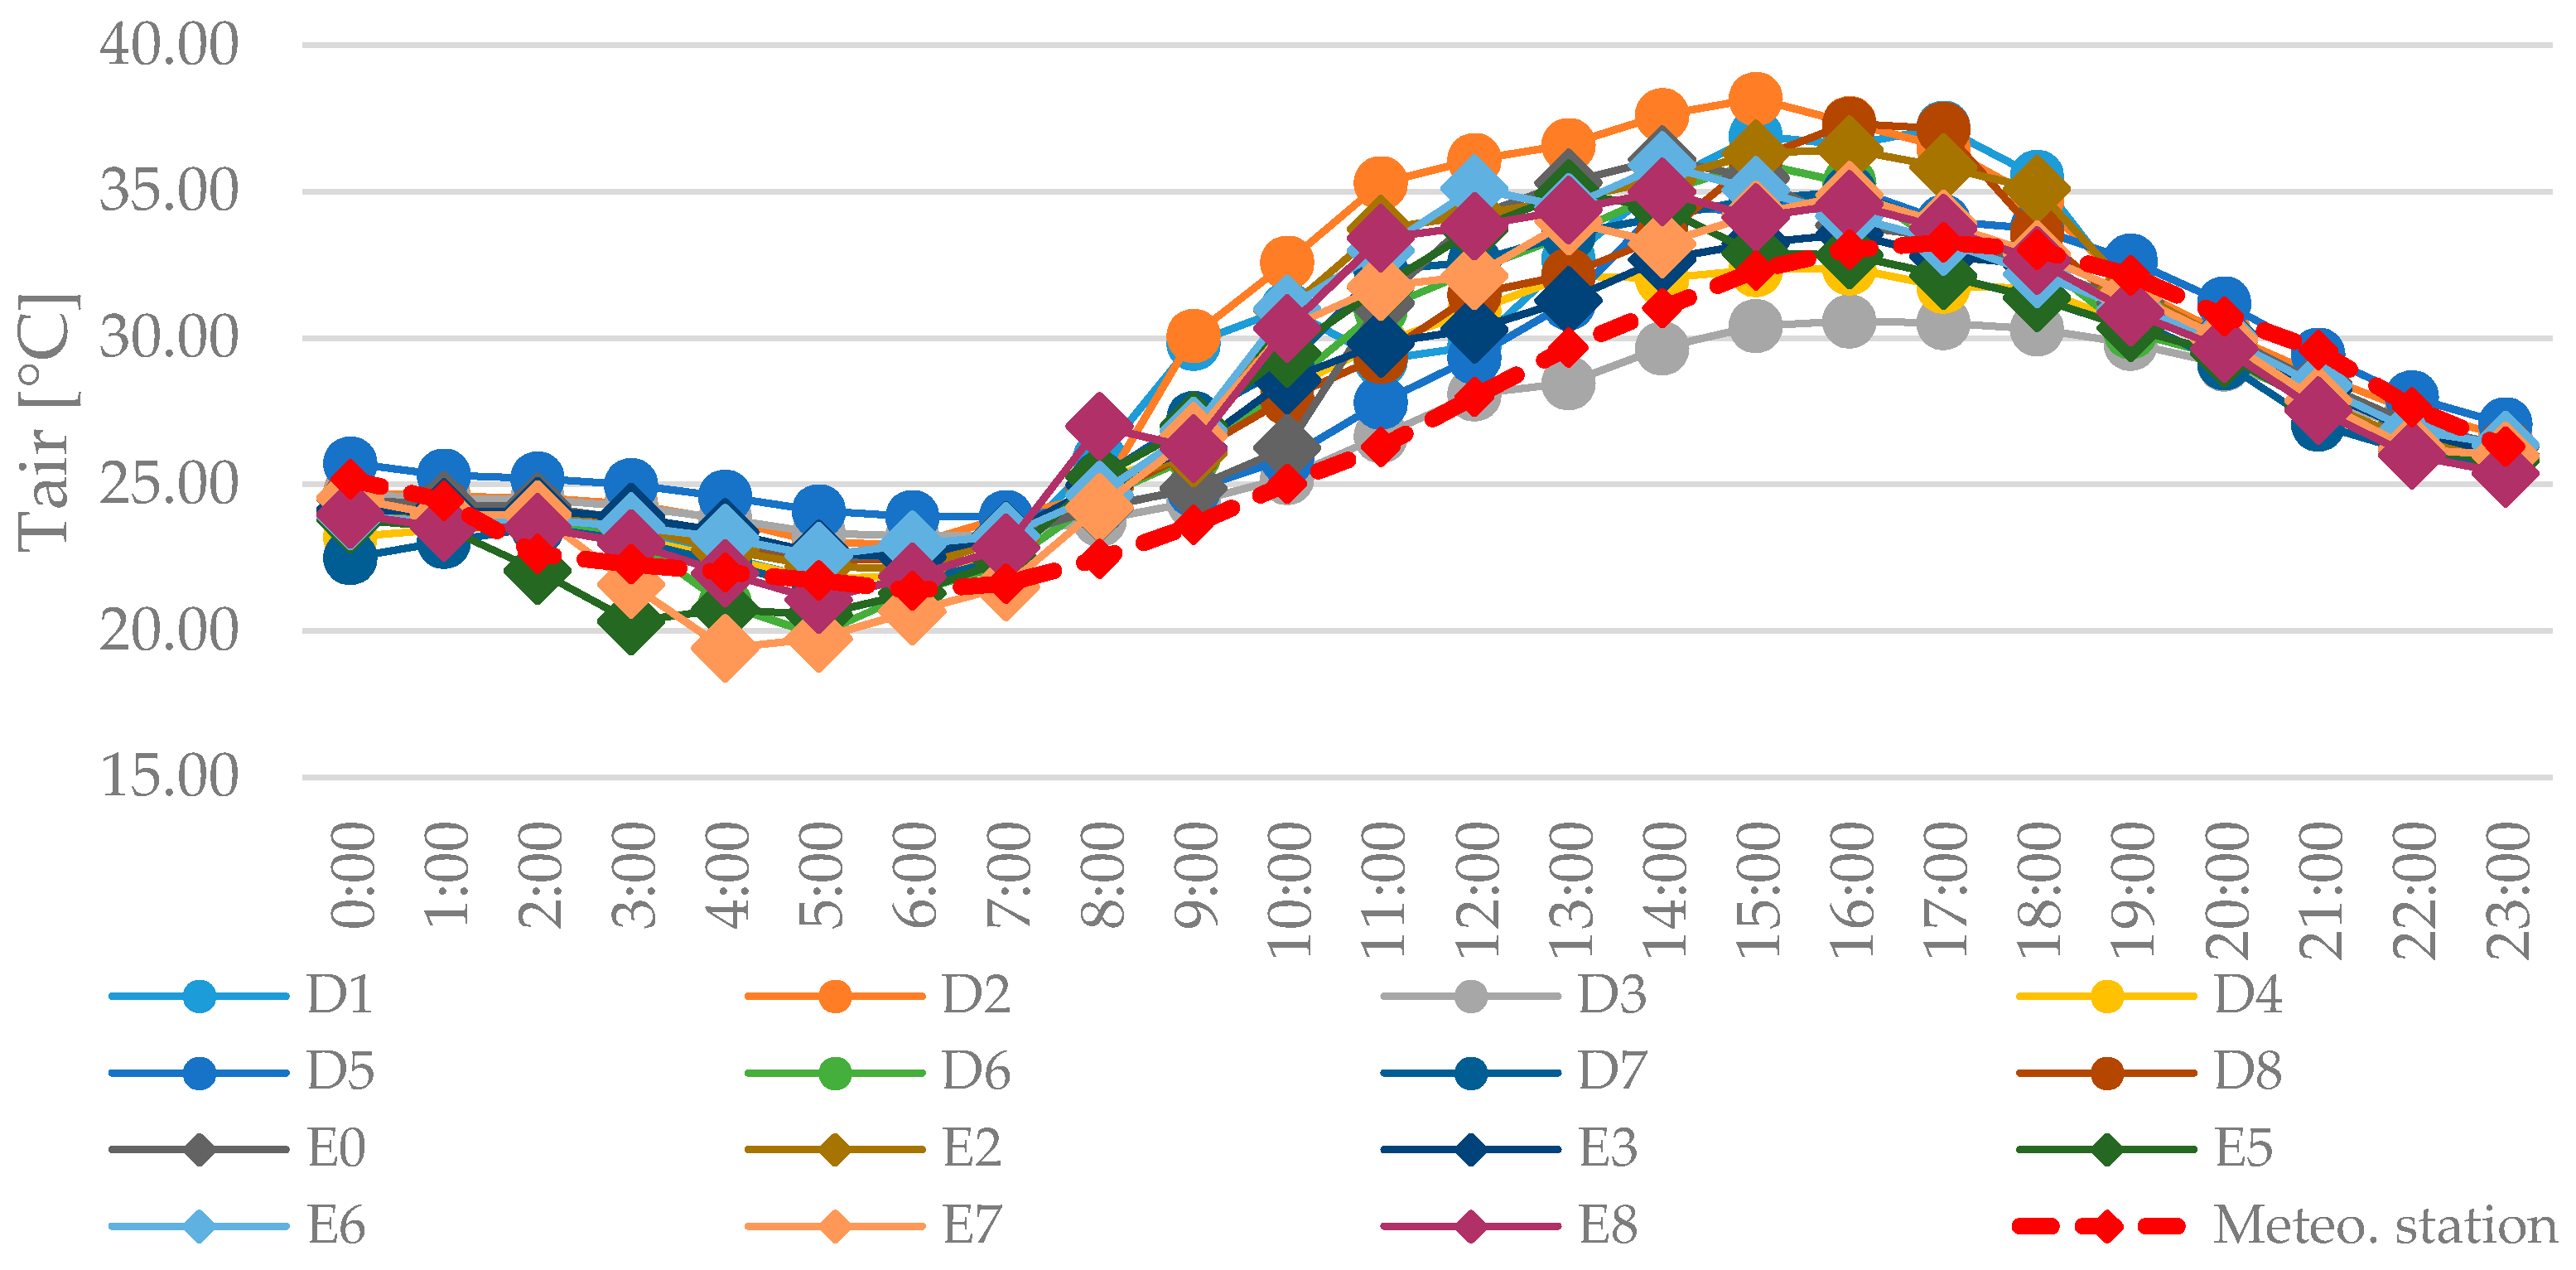
Figure 3 presents the daily trend of average hour Tair in all the measurement points and the measurements from the meteorological station, located around 2 km NNW. Almost all sensors have recorded higher Tair compared to the meteorological station, with a difference of up to 10 °C in the central hours of the day, which demonstrates the intensity of UHI phenomena in the area.
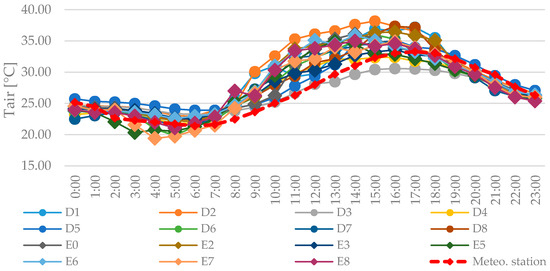
Figure 3.
Time series from the WSN (wireless sensor networks) nodes (solid) and from the meteorological station (dashed).
3.2. Numerical Simulation Results
3.2.1. ENVI-Met Model Evaluation
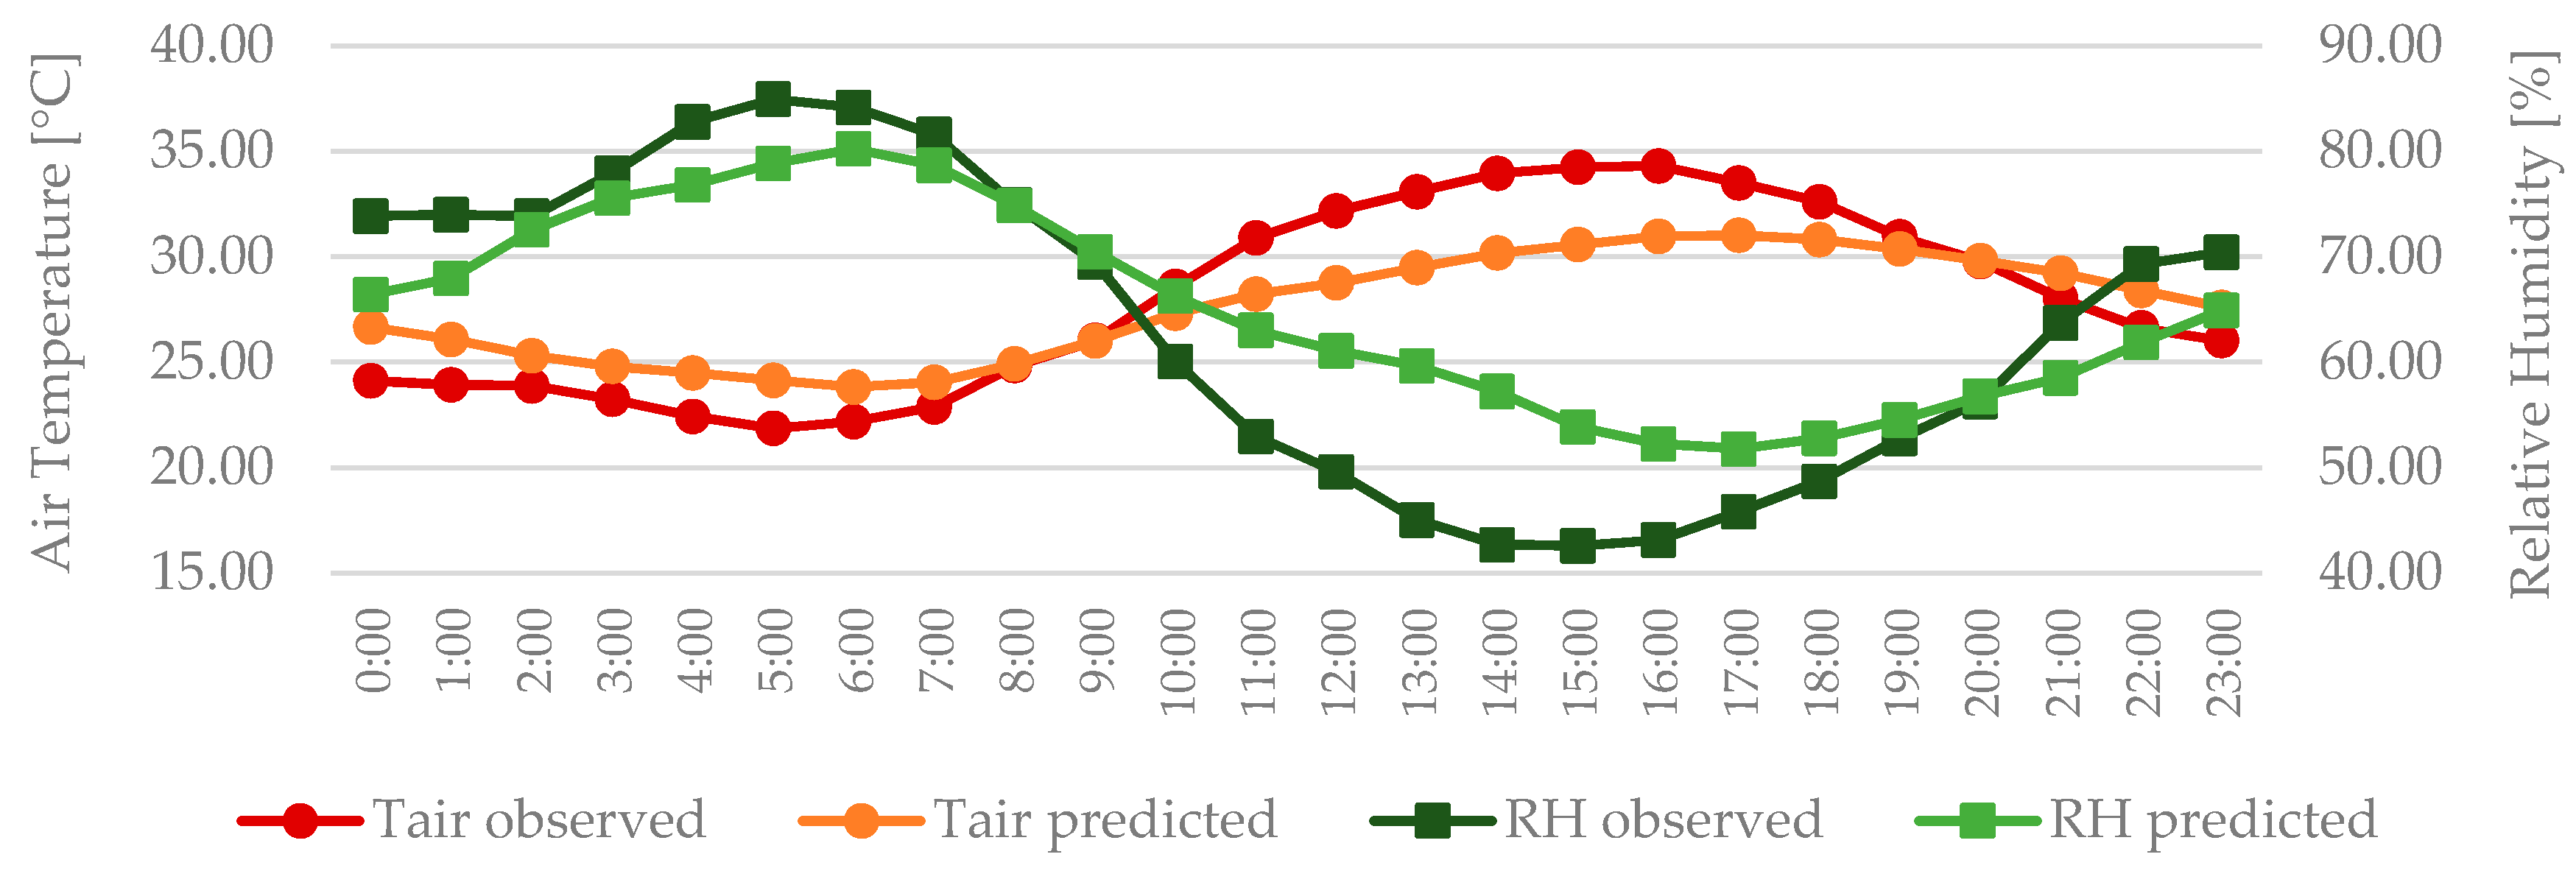
In order to develop a representative model of the case study area and obtain reliable outcomes, the outcome from the numerical simulations has been compared against the experimentally measured values (Figure 4).
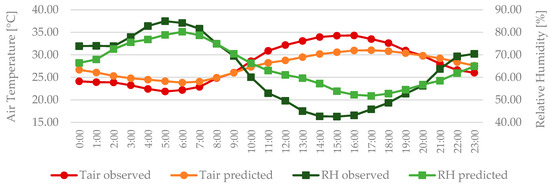
Figure 4.
ENVI-met hourly average results compared with on-site measured values.
As can be seen from the plot, the model tends to underestimate daytime and overestimate nighttime values of Tair. These discrepancies may have the following reasons: (a) the urban heat island (UHI) effect and the subsequent higher value of Tair values inside the NOI Techpark are not considered by the model since the input data are from a meteorological station located outside the district, and (b) the anthropogenic heat fluxed from transportations, air conditioners, other human influences are not taken into account in the model. In terms of relative humidity, a similar trend is discernable. Consistent deviations up to 15% occur for a few time steps during the central hours of the day. This can be attributed to the ENVI-met limitations in evaluating wind fluxes, as the boundary conditions for wind speed and directions are kept constant throughout the entire simulation [5].
To estimate the differences between measured and simulated data, the Mean Absolute Error (MAE), Root Mean Square Error (RMSE), and the Index of Agreement (d) are calculated. Based on the different errors for the full list of observed and predicted hourly values for the selected day, the MAE and RMSE for Tair are 1.92 and 2.21, respectively. The performance of ENVI-met in the estimation of the RH shows higher uncertainties, with MAE and RMSE equal to 7.27 and 6.03 correspondingly. Although discrepancies are observed between simulation outputs and measured parameters, the values of the indexes are in accordance with previous studies [5,6,7]. Furthermore, considering the spatial resolution of the computation grid (i.e., 3 × 3 m) and accuracy of the sensors (± 0.5 °C and ± 4% for Tair and RH, respectively), these deviations can be regarded as acceptable and the models as representative of the local climate conditions. The index of the agreement is 0.89 for Tair and 0.90 for RH, which indicates that the results of ENVI-met simulations are reasonably approximate to field measurements.
3.2.2. Simulation Outcome and Outdoor Thermal Comfort Conditions
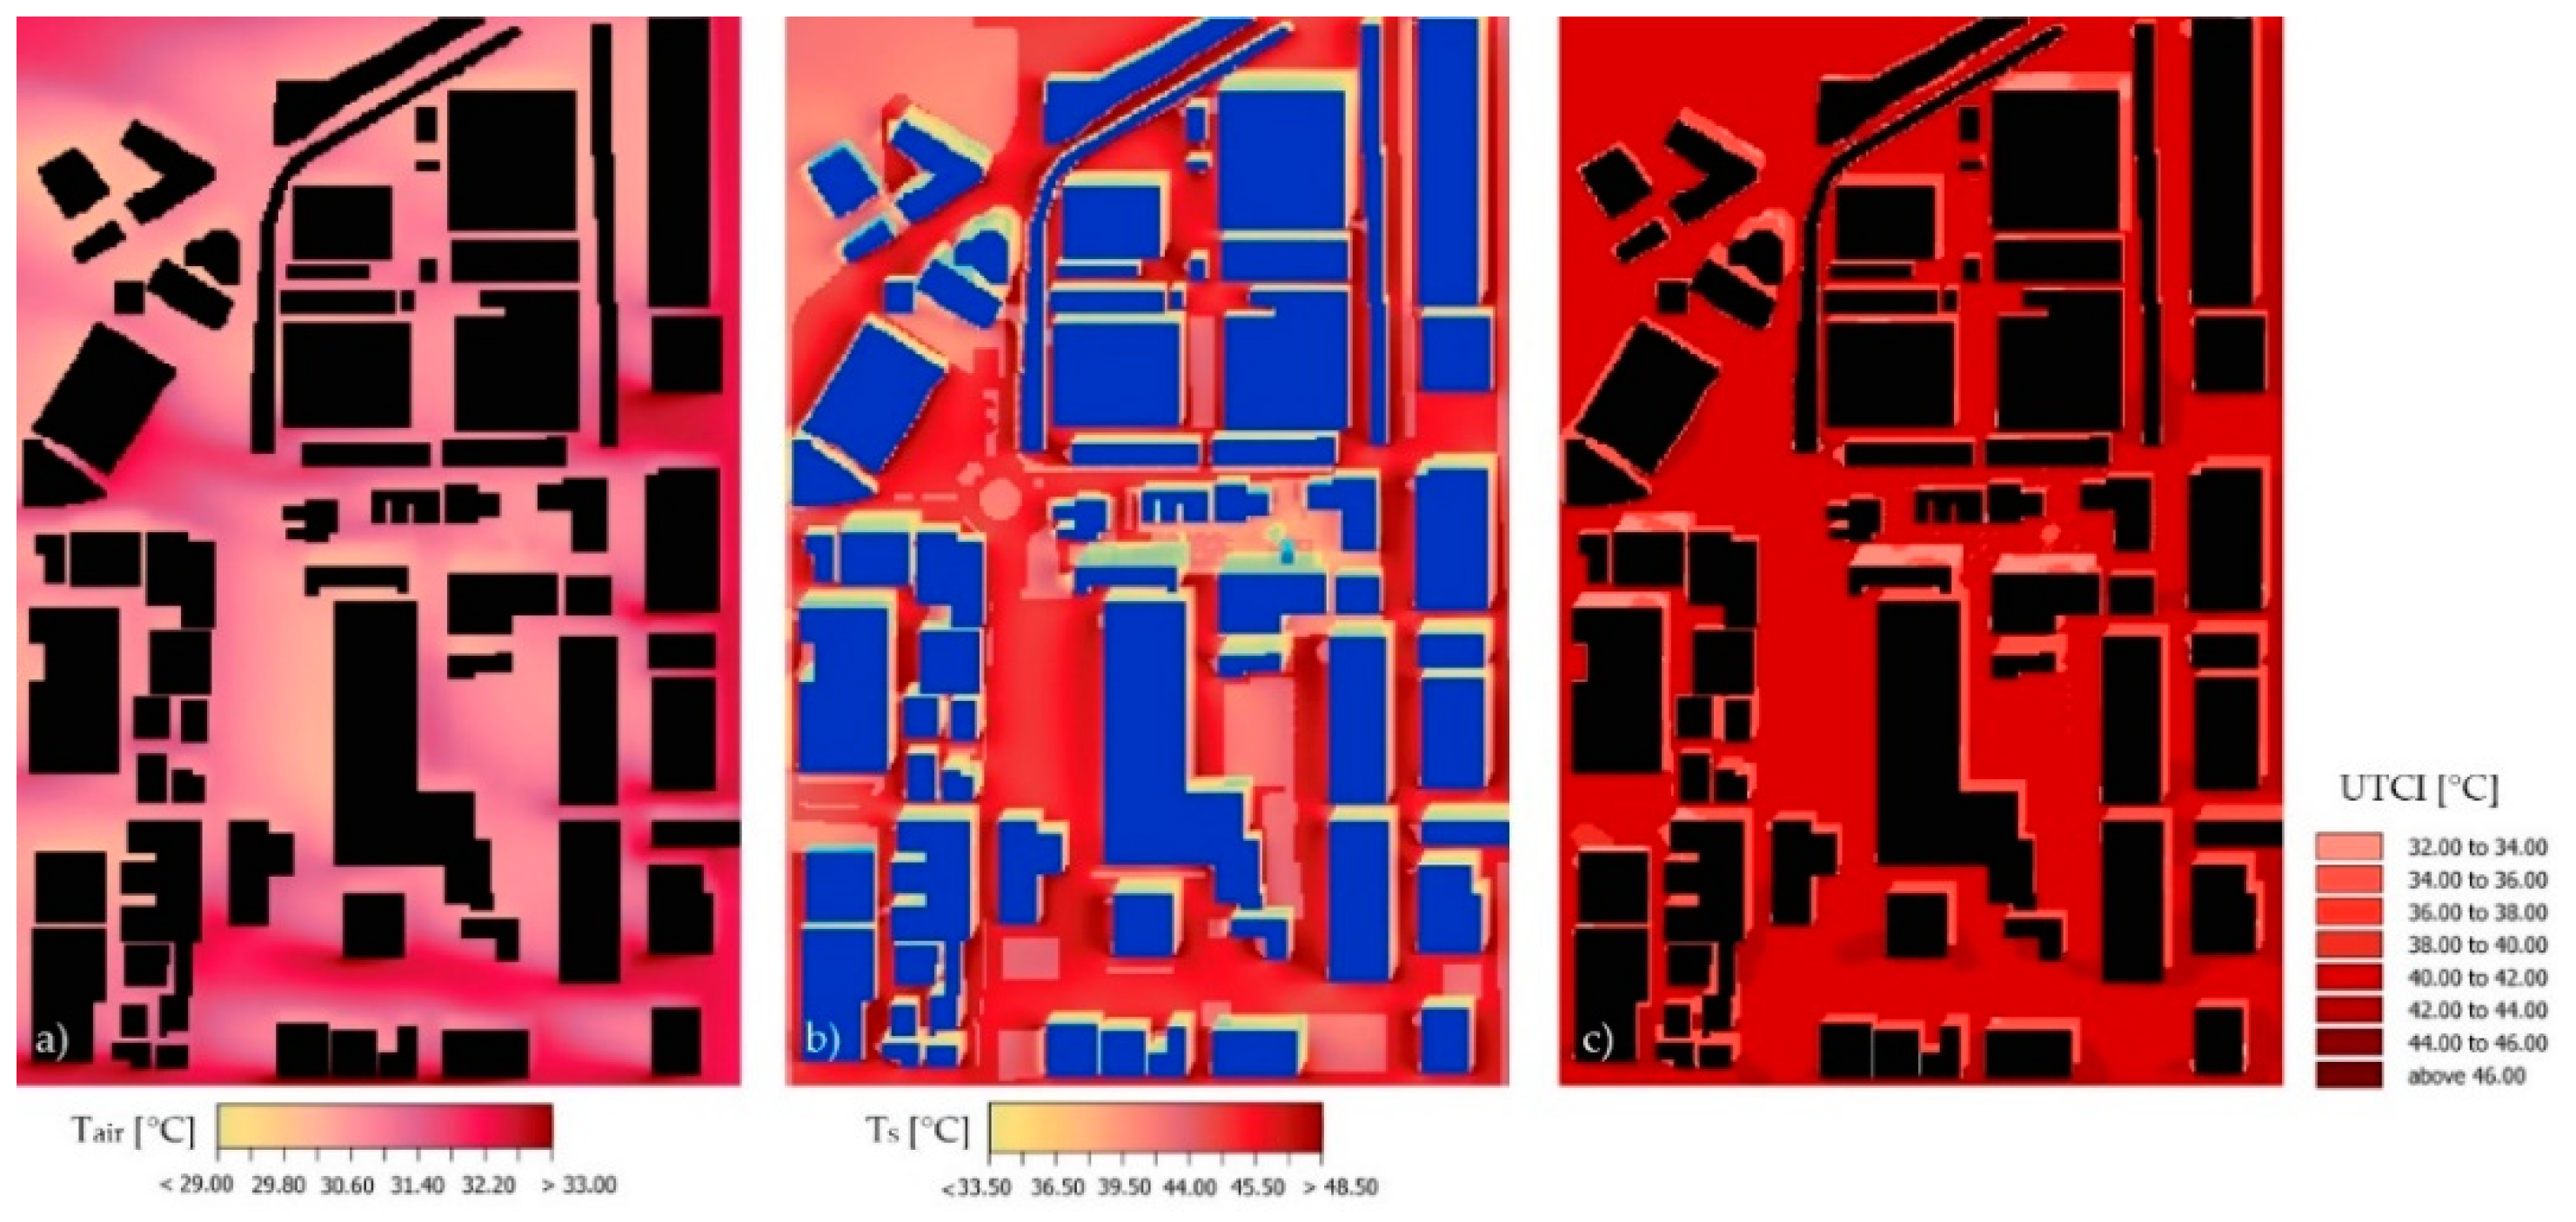
Figure 5 presents some of the outputs of the numerical simulation at 15:00, when the peak of thermal stress is achieved with UTCI values around 43.0 °C in the whole area, corresponding to a thermal perception of strong heat stress. Tair reaches maximum values up to 34.0 °C, while the temperature of the ground surfaces (Ts) rises up to 51.0 °C on the asphalt roads and paved areas. The colder areas are those covered by grass (Ts = 38.5 °C).
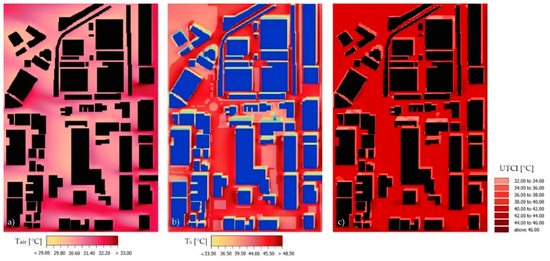
Figure 5.
Numerical simulations output at 15:00 of 21 August 2020. (a) Air temperature at 1.5 m a.g.l.; (b) Ground surface temperature; (c) UTCI (universal thermal climate index) at the pedestrian level.
4. Conclusions
The study demonstrates the importance of calibrating and understanding the performance and limitations of the numerical models as they are often applied not only for the investigation of current microclimatic conditions but also for the comparative assessment of various mitigation strategies for UHI reduction. The work carried out so far opens up many further developments. The data management flow has been designed according to interoperability principles, which make the collected information possibly available to any decision-support systems for the benefit of planners and policymakers. In addition, the open-source nature of the network allows for a sustainable scaling-up, along with the chance to integrate it with co-creation and citizen science initiatives. Finally, the simulation of the microclimatic conditions can be exploited to address heat island intensity reduction strategies in extensive urban areas.
Author Contributions
Conceptualization, S.C.; methodology, S.C.; validation, S.T.; formal analysis, S.C.; investigation, S.C.; resources, S.T.; data curation, S.T.; writing—original draft preparation, S.C.; writing—review and editing S.T.; visualization, S.C. All authors have read and agreed to the published version of the manuscript.
Funding
The research leading to these results has received funding from the European Union’s Seventh Programme for research, technological development, and demonstration under grant agreement No. 609019. The European Union is not liable for any use that may be made of the information contained in this document.
Acknowledgments
The authors thank Daniele Vettorato and Roberto Monsorno for the supervision, the project administration, and the acquisition of funding for the present work.
Conflicts of Interest
The authors declare no conflict of interest. The funders had no role in the design of the study; in the collection, analyses, or interpretation of data; in the writing of the manuscript, or in the decision to publish the results.
References
- LoRaWAN@NOI Web Portal. Available online: https://lorawan.beacon.bz.it/ (accessed on 11 October 2020).
- Tondini, S.; Tritini, S.; Amatori, M.; Croce, S.; Seppi, S.; Monsorno, R. LoRa-based wireless sensor networks for urban scenarios using an open-source approach. Sens. Trasnd. 2019, 238, 64–71. [Google Scholar]
- Bruse, M.; Fleer, H. Simulating surface–plant–air interactions inside urban environments with a three dimensional numerical model. Environ. Model. Softw. 1998, 13, 373–384. [Google Scholar] [CrossRef]
- Bröde, P.; Fiala, D.; Blazejczyk, K. Calculating UTCI equivalent temperature. In Proceedings of the 13th International Conference on Environmental Ergonomics, Boston, MA, USA, 2–7 August 2009; pp. 1–5. [Google Scholar]
- Tsoka, S.; Tsikaloudaki, A.; Theodosiou, T. Analyzing the ENVI-met microclimate model’s performance and assessing cool materials and urban vegetation applications—A review. Sustain. Cities Soc. 2018, 43, 55–76. [Google Scholar] [CrossRef]
- Salata, F.; Golasi, I.; Petitti, D.; de Lieto Vollaro, E.; Coppi, M.; de Lieto Vollaro, A. Relating microclimate, human thermal comfort and health during heat waves: An analysis of heat island mitigation strategies through a case study in an urban outdoor environment. Sustain. Cities Soc. 2017, 30, 79–96. [Google Scholar] [CrossRef]
- Duarte, D.H.S.; Shinzato, P.; dos, S. Gusson, C.; Alves, C.A. The impact of vegetation on urban microclimate to counterbalance built density in a subtropical changing climate. Urban Clim. 2015, 14, 224–239. [Google Scholar] [CrossRef]
Publisher’s Note: MDPI stays neutral with regard to jurisdictional claims in published maps and institutional affiliations. |
© 2020 by the authors. Licensee MDPI, Basel, Switzerland. This article is an open access article distributed under the terms and conditions of the Creative Commons Attribution (CC BY) license (https://creativecommons.org/licenses/by/4.0/).

