Abstract
Increased electrical activity in the brain causes epilepsy, which causes seizures, resulting in various medical complications that can sometimes be fatal. Doctors use electroencephalography (EEG) for the profiling and diagnosis of epilepsy. According to the World Health Organization (WHO), approximately 50 million people worldwide have epilepsy, making it one of the most common neurological disorders globally. This number represents about 0.7% of the global population. The conventional method of EEG analysis employed by medical professionals is a visual investigation that is time-consuming and requires expertise because of the variability in EEG signals. This paper describes a method for detecting epileptic seizures in EEG signals by combining signal processing and machine learning techniques. SVM and other machine learning techniques detect anomalies in the input EEG signal. To extract features, DWT is used for decomposition to sub-bands. The proposed method aims to improve the accuracy of the machine learning model while using as few features as possible. The classification results show an accuracy of 100% with just one feature, mean absolute value, from datasets A and E. With additional features, the overall accuracy remains high at 99%, with specificity and sensitivity values of 97.2% and 99.1%, respectively. These results outperform previous research on the same dataset, demonstrating the effectiveness of our approach. This research contributes to developing more accurate and efficient epilepsy diagnosis systems, potentially improving patient outcomes.
1. Introduction
The brain is an essential part of the body that controls and coordinates nearly all the functions of the human body, ranging from motor functions that enable us to perform daily tasks to the management of hormones in the body, which is essential for the development of the body [1]. The highly complex workings of the brain make it an exciting field of study focusing on neurological disorder profiling, emotion analysis, and brain–computer interface (BCI) as seen in Figure 1. The constituent elements of the brain neurons, the human brain, contain 100 billion neurons with a hundred thousand kilometers of connections between them. This level of complexity in the brain makes us achieve nearly unlimited cognitive capabilities [2]. Electrical pulses are responsible for the communication between neurons, which are interpreted by an electroencephalogram (EEG), which is analogous to ECG in the heart. Hence, EEG is the source of information whose analysis enables researchers to develop advanced technological systems to correlate brain activities with the body and extend them to external devices.
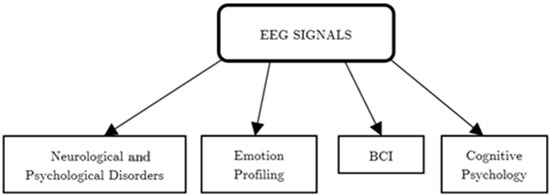
Figure 1.
Applications of EEG signal analysis.
This paper mainly focuses on the neurological disorder part of the EEG analysis and developing a model which can efficiently predict the abnormality in brain activity using machine learning methods.
2. Literature Survey
EEG signal analysis for epilepsy detection is an exciting area of research that is expanding every year. The researchers for epilepsy detection have discussed various methods and techniques based on signal processing and feature extraction mechanisms. Automating epileptic seizure detection methods became an area of research in the early 1970s [3].
A spike recognition method to recognize epileptic seizures by selective ictal and interictal epileptic activity was devised in 1991. However, this method posed low accuracy due to false detections. Further studies on epileptic seizure detection emphasize feature extraction methods for pattern identification in EEG signals [4]. Carlos Guerrero-Mosquera et al. discuss dimensionality reduction for EEG classification, which focuses on reducing the dimensionality of the dataset required for identifying epileptic seizures. Feature extraction requires computational cost hence using fewer features with more accuracy is more efficient [5].
Pari Jahankhani et al. discuss a “Wavelet feature extraction-based feature extraction for EEG signals”, which proposes wavelet transform as an efficient technique for the feature extraction process to obtain spectral features of EEG signals; this model with a neural network classifier achieved 97% accuracy in the detection of seizures [6]. Riaz et al. discussed a model to predict seizures using empirical mode decomposition and SVM, achieving 82.5% accuracy using the Bonn EEG dataset [7]. Another study by Acharya et al. in 2013 used continuous wavelet transform and SVM for classification, achieving 96% accuracy. Padmashree et al. in 2022 proposed emotional recognition capabilities of EEG signals as a research area [8].
Tajmirriahi et al. in 2021 used stochastic diff equation-based modeling and SVM to attain an overall accuracy of 99% with four features [9]. In most of the studies discussed so far, there is a clear tradeoff between the performance of the model and the number of features used for classification [10]. The more features, the higher the accuracy, but the computation cost also increases; therefore, further research in the field aims to achieve greater accuracy for a given model by using a smaller number of features [11]. The features mean, standard deviation, variance, maximum value, and band power are calculated for different decomposition coefficients of a raw signal applied to DWT. The last column signifies the prediction values of the classification learner. Moreover, 0 implies normal and 1 implies abnormal patient data. MATLAB’s classification learner toolbox trains and tests the model on different SVMs. The trained/validation model is checked for prediction accuracy with combinations of data points and several features used. The confusion matrix for the model is also able to obtain the values of accuracy, sensitivity, and specificity.
3. Methodology
This section discusses the methodology followed in the development of the system. Various subsystems are discussed below, and Figure 2 depicts the steps involved in the EEG prediction model.
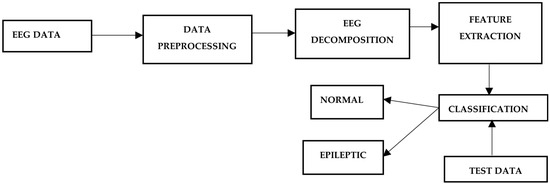
Figure 2.
Epileptic seizure detection methodology.
EEG data acquisition methods are classified into two major categories: invasive and non-invasive. The invasive method requires a surgical procedure and placing a device inside the brain to collect EEG data. This method is not commonly used because of its complexity and cost. Another popular method to acquire EEG data is the non-invasive method of EEG extraction.
The non-invasive method requires the placement of electrodes on the scalp; these electrodes capture the brain’s electrical activity and provide timely resolution. An international 10–20 system is used for electrode placement over the scalp (the electrodes are placed over the cerebral cortex) and 10–20 refers to the separation of adjacent electrodes in percent as the front–back or left–right distance of the head [12]. The EEG data obtained from different electrodes is called raw EEG data. Further processing, called preprocessing, is required to analyze the obtained data further. The EEG data were obtained from the Epileptology Department at the University of Bonn. The dataset is open for public use and contains 100 raw EEG signals taken in different scenarios, e.g., eyes open, eyes closed, seizure free, and seizure. For each individual, brain activity was recorded for 23.5 s; these recordings are represented by 4096 evenly spaced, consecutive data points (i.e., every 0.0057 s). Filtering of the data was carried out using LPF to eliminate noise and unwanted frequencies. Low pass FIR filter at 64 Hz was used to restrict the signal frequencies up to the Gamma frequency range and avoid noise. Preprocessed EEG data obtained after filtering and before feature extractions require decomposition because raw data does not contain essential information for pattern matching. EEG data features provide a more precise pattern for EEG analysis. Different methods can decompose EEG signals, e.g., FFT, STFT, WT, and DWT. Fourier transform can be used to decompose EEG data, but it lacks temporal resolution and is unsuitable. Wavelet transforms were used to provide time precision for decomposition. Wavelet transform decomposes the input signal into a set of wavelets; wavelets are time-bounded waves. The scale and position of the wavelet are changed to obtain the decomposition coefficients. The essential value to obtain is the part of the wave a wavelet contains. Different wavelets can be chosen for decomposition. The LPF provides the decomposed signal approximate coefficients, and HPF gives complex coefficients. The filtered EEG signal is subjected to Discrete Wavelet Transform, which is used with db8 wavelet to decompose the EEG signal into alpha, beta, gamma, delta, and theta bands. DWT gives approximate and detailed coefficients, which are used to obtain features. In this case, a level 3 detailed coefficient is used for feature extraction. After decomposing the EEG into sub-bands, features are extracted from each sub-band. Multiple statistical or non-statistical features are extracted from the input EEG signal. The following characteristics are calculated: mean absolute value, variance, standard deviation, skewness, kurtosis, peak values, average power, and entropy. Classification techniques are used to classify the data based on features computed in the previous steps. A support vector machine (SVM) is used to classify data into normal or abnormal categories. Different datasets and features can be used in this step to see the effect on the model’s accuracy.
4. Results
Eighty values from sets A and E out of one hundred are taken as training data with all the features extracted from the previous steps and are trained for multiple SVMs, i.e., linear, quadratic, Gaussian, and the confusion matrix for each are obtained to find accuracy, specificity, and sensitivity. The rest are taken as testing data making an 80:20 split.
The models are trained for the different number of features used. Initially, only one feature is used, i.e., the mean absolute value followed by a combination of mean and variance, and finally, the model is trained with all the available features. The results obtained after the validation are shown in the tables. From the analysis, it is found that Gaussian SVM has the most accurate predictions for the given dataset and the number of features used. Hence, All the other cases are seen for only Gaussian SVM; the results are shown in Table 1. From the results obtained after applying a Gaussian SVM to a combination of the different datasets, it is found that the accuracy of the model is maximum when three variables, i.e., mean, variance, and standard deviation, are used together. The overall average accuracy of the model for different data combinations was found to be 98.8%, with sensitivity and specificity of 97.2 and 99.1%. It is also observed that the sensitivity of the model degrades as the number of variables increases, which means the model becomes prone to false negative values with increased variables. Table 2 shows the summary of the results obtained after the classification.

Table 1.
Summary of results.
Table 2.
Summary of results.
5. Conclusions and Future Scope
The classification results imply that the model has an accuracy of 100% when datasets A and E are used with only one feature: mean absolute value. Upon the further classification of the data and an increasing number of features, the overall accuracy was found to be nearly 99%, and the values for specificity and sensitivity were found to be 97.2% and 99.1%, respectively. When compared to previous research conducted on the same dataset, the accuracies improved, as seen in Table 3. The significant observations from the results are as follows: Feature extraction is the essential component of a machine learning model and should be chosen with care to prevent redundancy and save computation costs. EEG decomposition into sub-bands is an essential requirement for feature extraction since raw data have spectral information, which need to be extracted from the data. As the data volume increases, the accuracy of the model degrades due to the increased number of variables. Hence, it is necessary to have a careful selection of features and datasets for a given model.
Table 3.
Comparison of results.
In the future, the proposed machine learning model can be tested for more features to increase the accuracy further. The mode of decomposition iterations in choosing the coefficient for feature extraction can improve the system’s accuracy. Furthermore, the real-world implementation of the system of FPGA can be carried out using MATLAB’s HDL coder, which enables the system to do fast computations and work as a standalone system. The subsystems of the model used, e.g., filters, wavelet transforms, and feature extractors, can also be realized in Verilog HDL for the physical implementation of the system.
Author Contributions
S.H. was responsible for the conceptualization and methodology of the paper. The design and simulation of the experiment manuscript drafting were conducted by S.H. as well. V.G. performed the manuscript review, proofreading, and reference collection for the research. All authors have read and agreed to the published version of the manuscript.
Funding
This research received no external funding.
Institutional Review Board Statement
Not applicable.
Informed Consent Statement
Not applicable.
Data Availability Statement
The data available in this article are openly available at https://physionet.org/content/mitdb/1.0.0/ (accessed on 17 January 2023).
Conflicts of Interest
The authors declare no conflicts of interest.
References
- Akyol, K. Stacking ensemble based deep neural networks modeling for effective epileptic seizure detection. Expert Syst. Appl. 2020, 148, 113239. [Google Scholar] [CrossRef]
- World Health Organization. Epilepsy: A Public Health Imperative. World Health Organization. 1970. Available online: https://apps.who.int/iris/handle/10665/325293 (accessed on 17 January 2023).
- Ibrahim, S.; Djemal, R.; Alsuwailem, A. Electroencephalography (EEG) signal processing for epilepsy and autism spectrum disorder diagnosis. Biocybern. Biomed. Eng. 2018, 38, 16–26. [Google Scholar] [CrossRef]
- Mert, A.; Akan, A. Seizure onset detection based on frequency domain metric of empirical mode decomposition. Signal Image Video Process. 2018, 12, 1489–1496. [Google Scholar] [CrossRef]
- Mulla, Z.A.; Reddy, S.; Lakshmi, V.V.; Maturi, S.C. Epileptic Seizure Detection System using Single Hidden Layer Extreme Learning Machine (ELM). In Proceedings of the 2022 9th International Conference on Computing for Sustainable Global Development (INDIACom), New Delhi, India, 23–25 March 2022. [Google Scholar]
- Jahankhani, P.; Kodogiannis, V.; Revett, K. EEG Signal Classification Using Wavelet Feature Extraction and Neural Networks. In Proceedings of the IEEE John Vincent Atanasoff 2006 International Symposium on Modern Computing (JVA’06), Sofia, Bulgaria, 3–6 October 2006; pp. 120–124. [Google Scholar] [CrossRef]
- Riaz, F.; Hassan, A.; Rehman, S.; Niazi, I.K.; Dremstrup, K. EMD-based temporal and spectral features for the classification of EEG signals using supervised learning. IEEE Trans. Neural Syst. Rehabil. Eng. 2016, 24, 28–35. [Google Scholar] [CrossRef] [PubMed]
- Padhmashree, V.; Bhattacharyya, A. Human emotion recognition based on time-frequency analysis of multivariate EEG signal. Knowl.-Based Syst. 2022, 238, 107867. [Google Scholar]
- Tajmirriahi, M.; Amini, Z. Modeling of seizure and seizure-free EEG signals based on stochastic differential equations. Chaos Solitons Fractals 2021, 150, 111104. [Google Scholar] [CrossRef]
- Lian, J.; Shi, Y.; Zhang, Y.; Jia, W.; Fan, X.; Zheng, Y. Revealing false positive features in epileptic EEG identification. Int. J. Neural Syst. 2020, 30, 2050017. [Google Scholar] [CrossRef] [PubMed]
- Gupta, V.; Pachori, R.B. Epileptic seizure identification using entropy of FBSE based EEG rhythms. Biomed. Signal Process. Control 2019, 53, 101569. [Google Scholar] [CrossRef]
- Kumar, N.; Alam, K.; Siddiqi, A.H. Wavelet Transform for Classification Of EEG Signal Using SVM and ANN. Biomed. Pharmacol. J. 2017, 10, 2061–2069. [Google Scholar] [CrossRef]
- Zhou, D.; Li, X. Epilepsy EEG signal classification algorithm based on improved RBF. Front. Neurosci. 2020, 14, 606. [Google Scholar] [CrossRef] [PubMed]
- Wang, X.; Wang, Y.; Liu, D.; Wang, Y.; Wang, Z. Automated recognition of epilepsy from EEG signals using a combining space–time algorithm of CNN-LSTM. Sci. Rep. 2023, 13, 14876. [Google Scholar] [CrossRef]
Disclaimer/Publisher’s Note: The statements, opinions and data contained in all publications are solely those of the individual author(s) and contributor(s) and not of MDPI and/or the editor(s). MDPI and/or the editor(s) disclaim responsibility for any injury to people or property resulting from any ideas, methods, instructions or products referred to in the content. |
© 2024 by the authors. Licensee MDPI, Basel, Switzerland. This article is an open access article distributed under the terms and conditions of the Creative Commons Attribution (CC BY) license (https://creativecommons.org/licenses/by/4.0/).