
ODIN TS: A Tool for the Black-Box Evaluation of Time Series Analytics †


Abstract
:1. Introduction
- Forecasting: predicting future event/s. An example is to predict the future energy consumption of an appliance based on historical data [7].
- Predictive Maintenance: predicting when a piece of equipment is likely to fail and deciding which maintenance activity to perform to obtain a good tradeoff between maintenance frequency and cost [10]. This objective could be pursued with classification approaches (identify if the appliance will fail within n days) or regression approaches (predict the Remaining Useful Life, RUL, of an appliance).
- We summarize the most widely used metrics for time series analysis.
- We describe their implementation in ODIN TS, an extensible framework for time series analytics error diagnosis.
- We introduce the novel analysis and visualizations supported by ODIN TS and exemplify them in an anomaly detection and a predictive maintenance task.
2. Related Work
3. The ODIN TS Framework
3.1. Dataset Input and Output Formats
- Anomaly Detection Task
- –
- Time Series data: a CSV file with the column “timestamp” of the observation and one additional column for each “signal”.
- –
- Ground Truth: a JSON file containing a list of the “timestamp” in which the anomalies appear.
- –
- Predictions: a CSV file where the first column specifies the “timestamp” and the following column(s) the “confidence” value, or the reconstructed/predicted “signal” values.
- Predictive Maintenance Task
- –
- Time Series data: a CSV with the columns “observation_id” for the unique identifier of the observation, “unit_id” for the machine or appliance identifier, and one additional column for each “signal”.
- –
- Ground Truth: it is embedded in the previous CSV file as an additional column (“label”) with a Boolean value denoting if the machine is going to fail within n timestamps (for classification) or with the RUL value (for regression).
- –
- Predictions: a CSV file (named “unit_id.csv”) for each machine or appliance mentioned in the ground truth. The file contains one column with the identifier of the observation and one column with the “confidence” score (for classification) or with the RUL value (for regression).
3.2. Supported Types of Dataset Analysis
3.3. Supported Types of Prediction Analysis
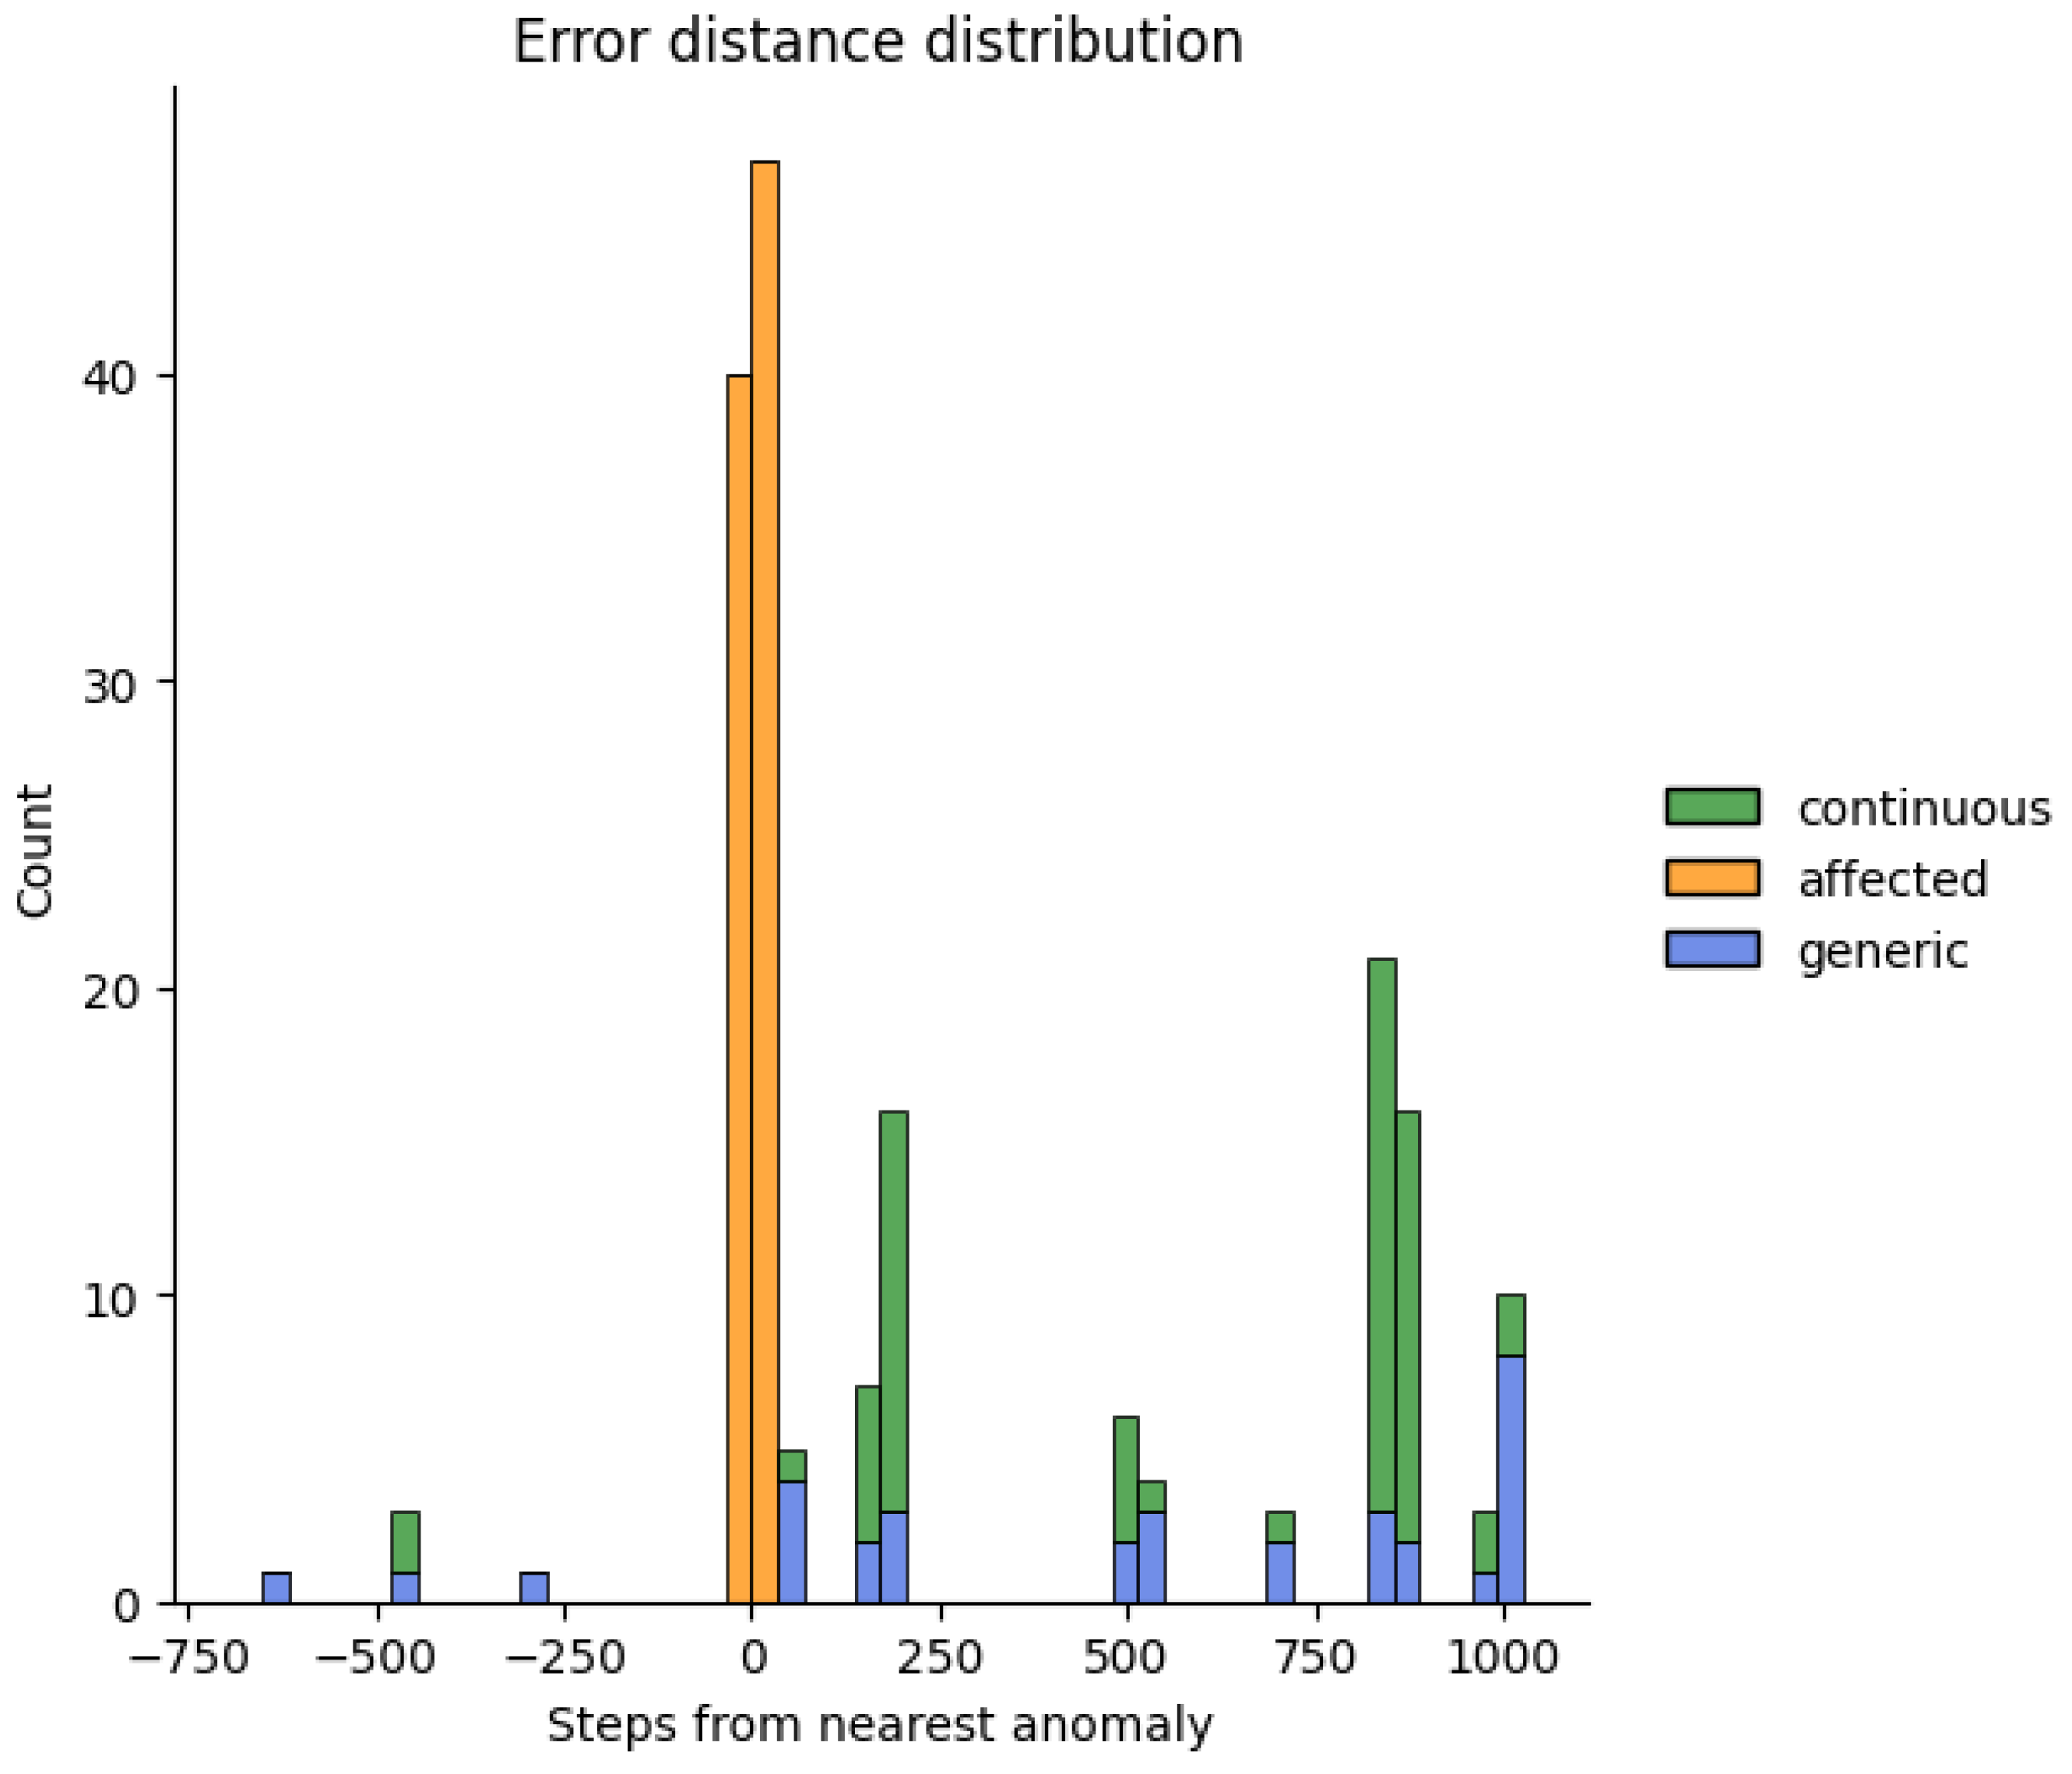
- Affected: an FP anomaly prediction is assigned to this category if its timestamp lies within an anomaly window. The anomaly window, introduced in [13], is an interval centered at the GT anomaly timestamp. The window extension (i.e., between, number of points) is a customizable parameter set by default to 10% of the data points divided by the number of anomalies.
- Continuous: this category contains FP anomalies that occur at contiguous timestamps outside the anomaly window.
- Generic: all the other FP anomalies.
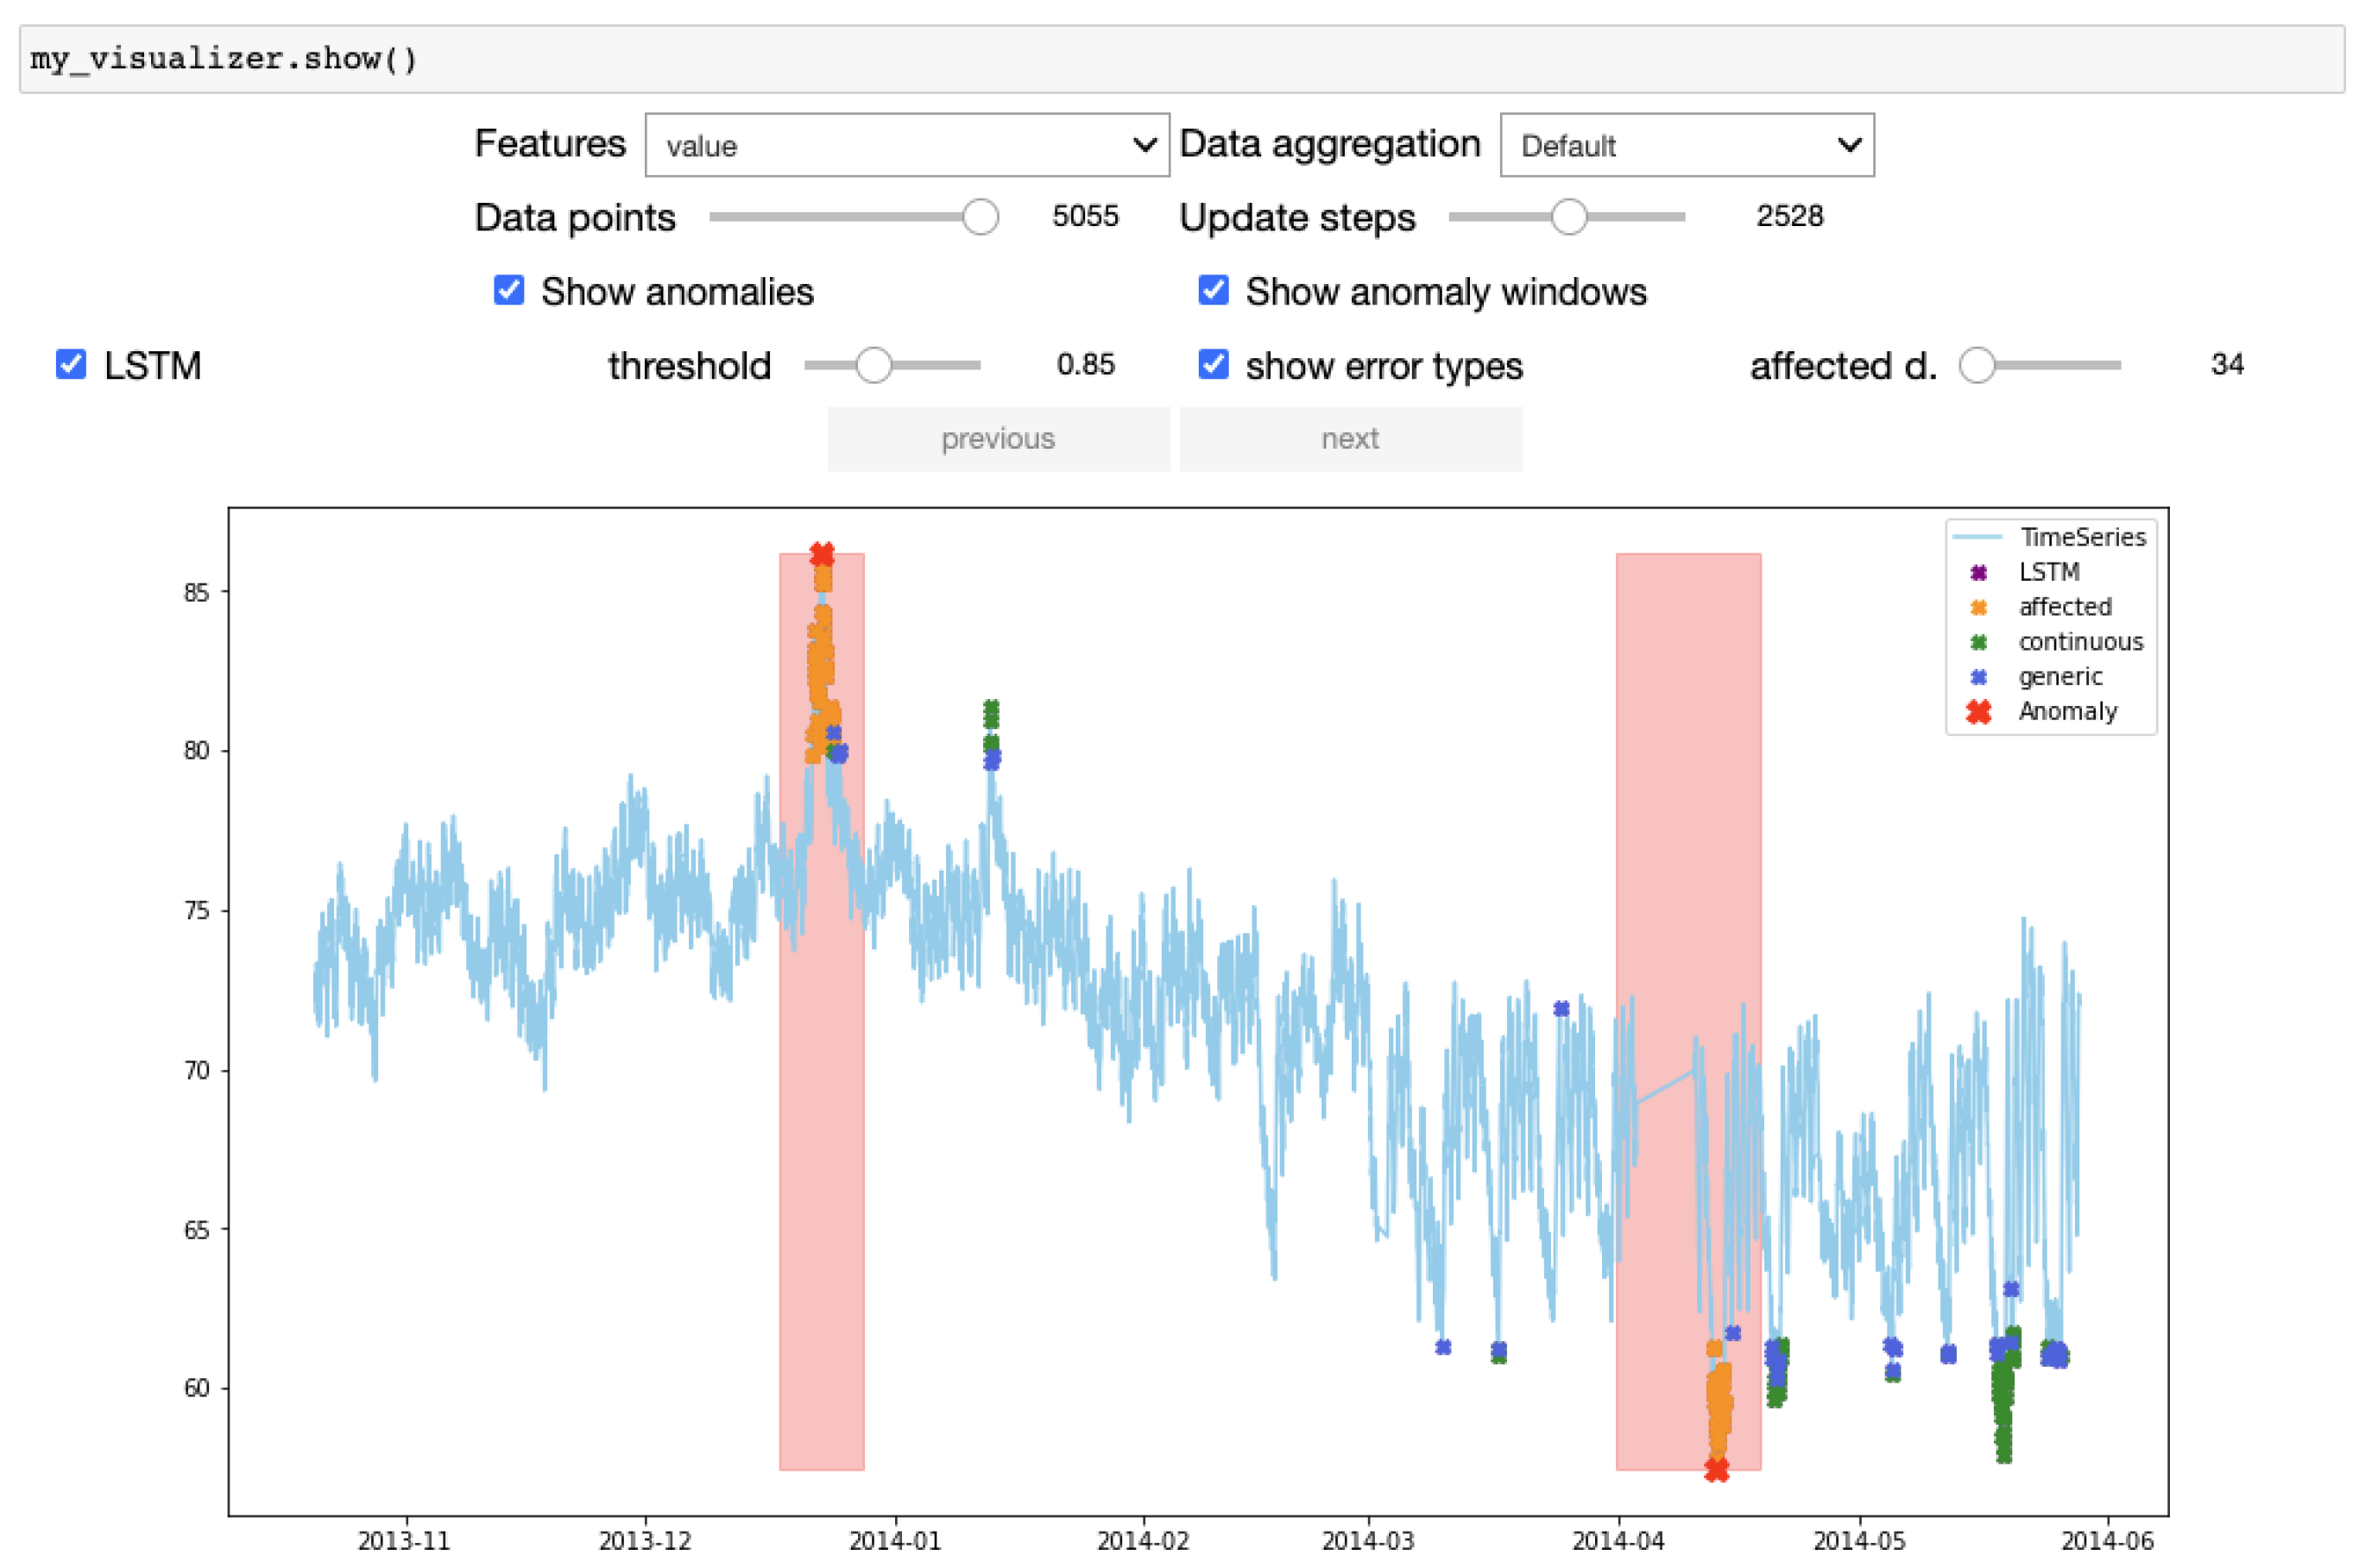
3.4. Supported Visualizations
- Feature filter: one can choose which features to visualize of a multivariate dataset.
- Aggregation: data can be aggregated by minute, hour, day, week, month, or year and visualized at different granularity.
- Pagination: some datasets span a large interval. A pagination function with custom data points size and step can be used to browse the dataset.
- GT display toggle: the GT annotations can be shown or hidden. For anomaly detection, it can be a single point or an anomaly window. For predictive maintenance, it can be the class labels or the RUL values.
- Predictions’ visualization and model comparison: the predictions are visualized along with the GT. If multiple models are selected, their predictions are color-coded.
- FP errors’ visualization: the FP predictions are displayed and, in the case of FP anomalies, color-coded by their type.
4. ODIN TS in Action
5. Conclusions
Author Contributions
Funding
Institutional Review Board Statement
Informed Consent Statement
Data Availability Statement
Conflicts of Interest
References
- Brockwell, P.J.; Davis, R.A. Time Series: Theory and Methods; Springer Science & Business Media: Berlin/Heidelberg, Germany, 2009. [Google Scholar]
- Centoni, M.; Cubadda, G. Modelling Comovements of Economic Time Series: A Selective Survey; Statistica: Bologna, Italy, 2011. [Google Scholar]
- Radhakrishnan, N.; Gangadhar, B. Estimating regularity in epileptic seizure time-series data. IEEE Eng. Med. Biol. Mag. 1998, 17, 89–94. [Google Scholar] [CrossRef] [PubMed]
- Qiao, H.; Wang, T.; Wang, P.; Qiao, S.; Zhang, L. A time-distributed spatiotemporal feature learning method for machine health monitoring with multi-sensor time series. Sensors 2018, 18, 2932. [Google Scholar] [CrossRef] [PubMed] [Green Version]
- Fawaz, H.I.; Forestier, G.; Weber, J.; Idoumghar, L.; Muller, P.A. Deep learning for time series classification: A review. Data Min. Knowl. Discov. 2019, 33, 917–963. [Google Scholar] [CrossRef] [Green Version]
- Kampouraki, A.; Manis, G.; Nikou, C. Heartbeat time series classification with support vector machines. IEEE Trans. Inf. Technol. Biomed. 2008, 13, 512–518. [Google Scholar] [CrossRef] [PubMed]
- Ahmad, A.S.; Hassan, M.Y.; Abdullah, M.P.; Rahman, H.A.; Hussin, F.; Abdullah, H.; Saidur, R. A review on applications of ANN and SVM for building electrical energy consumption forecasting. Renew. Sustain. Energy Rev. 2014, 33, 102–109. [Google Scholar] [CrossRef]
- Choi, K.; Yi, J.; Park, C.; Yoon, S. Deep Learning for Anomaly Detection in Time-Series Data: Review, Analysis, and Guidelines. IEEE Access 2021, 9, 120043–120065. [Google Scholar] [CrossRef]
- Braei, M.; Wagner, S. Anomaly detection in univariate time-series: A survey on the state-of-the-art. arXiv 2020, arXiv:2004.00433. [Google Scholar]
- Ran, Y.; Zhou, X.; Lin, P.; Wen, Y.; Deng, R. A survey of predictive maintenance: Systems, purposes and approaches. arXiv 2019, arXiv:1912.07383. [Google Scholar]
- Beghi, A.; Brignoli, R.; Cecchinato, L.; Menegazzo, G.; Rampazzo, M.; Simmini, F. Data-driven fault detection and diagnosis for HVAC water chillers. Control Eng. Pract. 2016, 53, 79–91. [Google Scholar] [CrossRef]
- Torres, R.N.; Milani, F.; Fraternali, P. ODIN: Pluggable Meta-annotations and Metrics for the Diagnosis of Classification and Localization. In Proceedings of the International Conference on Machine Learning, Optimization, and Data Science, Grasmere, UK, 4–8 October 2021; pp. 383–398. [Google Scholar]
- Lavin, A.; Ahmad, S. Evaluating real-time anomaly detection algorithms–the Numenta anomaly benchmark. In Proceedings of the 2015 IEEE 14th International Conference on Machine Learning and Applications (ICMLA), Miami, FL, USA, 9–11 December 2015; pp. 38–44. [Google Scholar]
- Gomes, G.; Dias, L.; Correia, M. CryingJackpot: Network flows and performance counters against cryptojacking. In Proceedings of the 2020 IEEE 19th International Symposium on Network Computing and Applications (NCA), Cambridge, MA, USA, 24–27 November 2020; pp. 1–10. [Google Scholar]
- Herzen, J.; Lässig, F.; Piazzetta, S.G.; Neuer, T.; Tafti, L.; Raille, G.; Van Pottelbergh, T.; Pasieka, M.; Skrodzki, A.; Huguenin, N.; et al. Darts: User-friendly modern machine learning for time series. arXiv 2021, arXiv:2110.03224. [Google Scholar]
- Zoppi, T.; Ceccarelli, A.; Bondavalli, A. Evaluation of Anomaly Detection algorithms made easy with RELOAD. In Proceedings of the 2019 IEEE 30th International Symposium on Software Reliability Engineering (ISSRE), Berlin, Germany, 28–31 October 2019; pp. 446–455. [Google Scholar]
- Hossin, M.; Sulaiman, M.N. A review on evaluation metrics for data classification evaluations. Int. J. Data Min. Knowl. Manag. Process 2015, 5, 1. [Google Scholar]
- An, N.; Weber, S. Impact of sample size on false alarm and missed detection rates in PCA-based anomaly detection. In Proceedings of the 2017 51st Annual Conference on Information Sciences and Systems (CISS), Baltimore, MD, USA, 22–24 March 2017; pp. 1–6. [Google Scholar]
- Pokrywka, R. Reducing false alarm rate in anomaly detection with layered filtering. In International Conference on Computational Science; Springer: Berlin/Heidelberg, Germany, 2008; pp. 396–404. [Google Scholar]
- Chicco, D.; Jurman, G. The advantages of the Matthews correlation coefficient (MCC) over F1 score and accuracy in binary classification evaluation. BMC Genom. 2020, 21, 6. [Google Scholar] [CrossRef] [PubMed] [Green Version]
- Miao, J.; Zhu, W. Precision–recall curve (PRC) classification trees. Evol. Intell. 2021, 1–25. [Google Scholar] [CrossRef]
- Jaffery, T.; Liu, S.X. Measuring campaign performance by using cumulative gain and lift chart. In Proceedings of the SAS Global Forum, Washington, DC, USA, 22–25 March 2009; p. 196. [Google Scholar]
- Sheather, S. A Modern Approach to Regression with R; Springer Science & Business Media: Berlin/Heidelberg, Germany, 2009. [Google Scholar]
- Cheung, Y.W.; Lai, K.S. Lag order and critical values of the augmented Dickey–Fuller test. J. Bus. Econ. Stat. 1995, 13, 277–280. [Google Scholar]
- Hyndman, R.J.; Athanasopoulos, G. Forecasting: Principles and Practice; OTexts: Melbourne, Australia, 2018. [Google Scholar]
- DeGroot, M.H.; Fienberg, S.E. The comparison and evaluation of forecasters. J. R. Stat. Soc. Ser. D 1983, 32, 12–22. [Google Scholar] [CrossRef]
- Guo, C.; Pleiss, G.; Sun, Y.; Weinberger, K.Q. On calibration of modern neural networks. In International Conference on Machine Learning; JMLR: Brookline, MA, USA, 2017; pp. 1321–1330. [Google Scholar]
- Saxena, A.; Goebel, K. Turbofan engine degradation simulation data set. NASA Ames Progn. Data Repos. 2008, 1551–3203. [Google Scholar]
- Song, Y.; Shi, G.; Chen, L.; Huang, X.; Xia, T. Remaining useful life prediction of turbofan engine using hybrid model based on autoencoder and bidirectional long short-term memory. J. Shanghai Jiaotong Univ. (Sci.) 2018, 23, 85–94. [Google Scholar] [CrossRef]


| Classification | Forecasting | Anomaly Detection | Predictive Maintenance | ||
|---|---|---|---|---|---|
| Classification | Regression | ||||
| Accuracy [17] | yes | n/a | yes | yes | n/a |
| Precision [17] | yes | n/a | yes | yes | n/a |
| Recall [17] | yes | n/a | yes | yes | n/a |
| F1 Score [17] | yes | n/a | yes | yes | n/a |
| Miss Alarm Rate [18] | yes | n/a | yes | yes | n/a |
| False Alarm Rate [19] | yes | n/a | yes | yes | n/a |
| NAB Score [13] | n/a | n/a | yes | n/a | n/a |
| Mean Absolute Error (MAE) [15] | n/a | yes | n/a | n/a | yes |
| Mean Squared Error (MSE) [15] | n/a | yes | n/a | n/a | yes |
| Root Mean Squared Error (RMSE) [15] | n/a | yes | n/a | n/a | yes |
| Matthews Coefficient [20] | yes | n/a | yes | yes | n/a |
| Mean Absolute Percentage Error (MAPE) [15] | n/a | yes | n/a | n/a | yes |
| Precision–Recall Curve [21] | yes | n/a | yes | yes | n/a |
| ROC Curve [17] | yes | n/a | yes | yes | n/a |
| Gain and Lift Analysis [22] | yes | n/a | yes | yes | n/a |
| Residuals Analysis [23] | n/a | yes | n/a | n/a | yes |
| Coefficient of Variation [15] | n/a | yes | n/a | n/a | yes |
| Mean Absolute Ranged Relative Error (MARRE) [15] | n/a | yes | n/a | n/a | yes |
| Mean Absolute Scaled Error (MASE) [15] | n/a | yes | n/a | n/a | yes |
| Overall Percentage Error (OPE) [15] | n/a | yes | n/a | n/a | yes |
| Coefficient of Determination R2 [15] | n/a | yes | n/a | n/a | yes |
| Rho-risk [15] | n/a | yes | n/a | n/a | yes |
| Root Mean Squared Log Error (RMSLE) [15] | n/a | yes | n/a | n/a | yes |
| Symmetric Mean Absolute Percentage Error (sMAPE) [15] | n/a | yes | n/a | n/a | yes |
| Anomaly Detection | Predictive Maintenance | |||||
|---|---|---|---|---|---|---|
| Format | Row Identifier | Signals/Values | Format | Row identifier | Signals/Values | |
| Time Series | CSV | timestamp | a column per signal | CSV | observation_id, unit_id | a column per signal |
| Ground Truth | JSON | n/a | list of timestamps when the anomalies occur | embedded in TS CSV | n/a | label column (class) or RUL column (regr) |
| Properties | CSV | timestamp | a column per property | CSV | observation_id, unit_id | a column per property |
| Predictions | CSV | timestamp | confidence column or a column per signal | CSV | observation_id | confidence column (class) or RUL column (regr) |
| Anomaly Detection | Predictive Maintenance | ||
|---|---|---|---|
| Classification | Regression | ||
| Summary report | yes | yes | yes |
| Performance per threshold value | yes | yes | n/a |
| Per property analysis | yes | yes | yes |
| FP anomaly categorization | yes | n/a | n/a |
| Error distance distribution | yes | n/a | n/a |
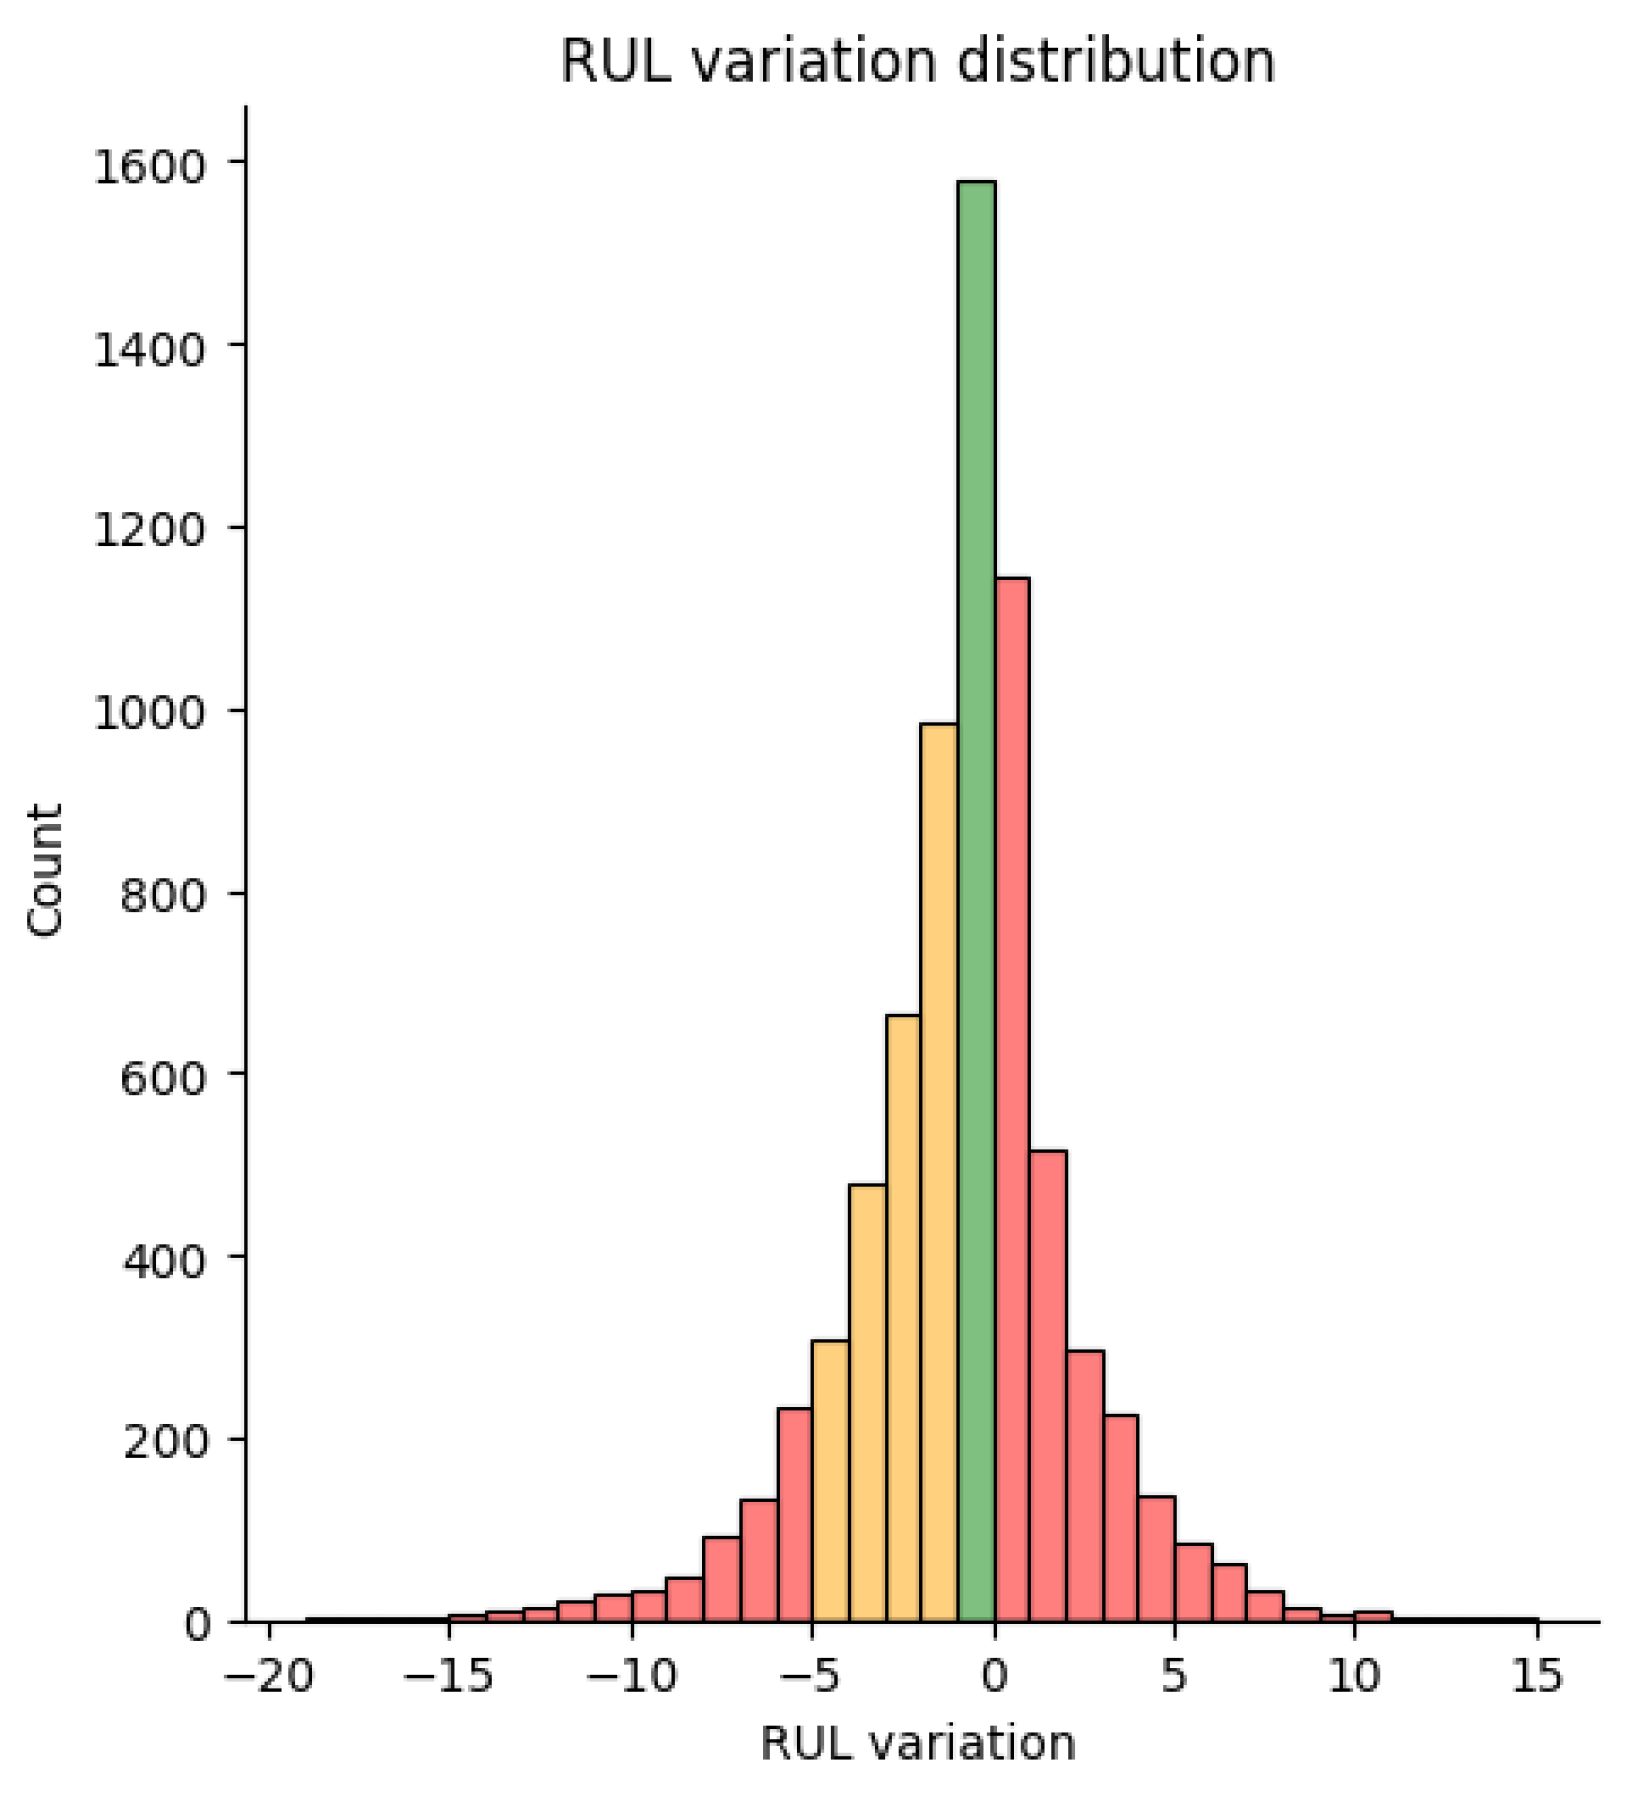
| RUL variation distribution | n/a | n/a | yes |
| Calibration analysis | yes | yes | n/a |
Publisher’s Note: MDPI stays neutral with regard to jurisdictional claims in published maps and institutional affiliations. |
© 2022 by the authors. Licensee MDPI, Basel, Switzerland. This article is an open access article distributed under the terms and conditions of the Creative Commons Attribution (CC BY) license (https://creativecommons.org/licenses/by/4.0/).
Share and Cite
Zangrando, N.; Torres, R.N.; Milani, F.; Fraternali, P. ODIN TS: A Tool for the Black-Box Evaluation of Time Series Analytics. Eng. Proc. 2022, 18, 4. https://doi.org/10.3390/engproc2022018004
Zangrando N, Torres RN, Milani F, Fraternali P. ODIN TS: A Tool for the Black-Box Evaluation of Time Series Analytics. Engineering Proceedings. 2022; 18(1):4. https://doi.org/10.3390/engproc2022018004
Chicago/Turabian StyleZangrando, Niccolò, Rocio Nahime Torres, Federico Milani, and Piero Fraternali. 2022. "ODIN TS: A Tool for the Black-Box Evaluation of Time Series Analytics" Engineering Proceedings 18, no. 1: 4. https://doi.org/10.3390/engproc2022018004
APA StyleZangrando, N., Torres, R. N., Milani, F., & Fraternali, P. (2022). ODIN TS: A Tool for the Black-Box Evaluation of Time Series Analytics. Engineering Proceedings, 18(1), 4. https://doi.org/10.3390/engproc2022018004