Abstract
Since the outbreak of the COVID-19 pandemic, great emphasis has been placed on the development of rapid virus detection devices, the principle of operation of many of which is the detection of the virus structural protein spike. Although several such devices have been developed, most are based on the visual observation of the result, without providing the possibility of its electrical processing. This paper presents a biosensor platform for the rapid detection of spike proteinboth in laboratory conditions and in swab samples from hospitalized patients. The platform consists of a microcontroller-based readout circuit, which measures the capacitance change generated in an interdigitated electrode transducer by the presence of the spike protein. The circuit efficiency is calibrated by its correlation with the capacitance measurement of an LCR meter. The test result is made available in less than 2 min through the microcontroller’s LCD screen, and at the same time, the collected data are sent wirelessly to a mobile application interface. In this way, the continuous and effective screening of SARS-CoV-2 patients is facilitated and enhanced, providing big data statistics of COVID-19 in terms of space and time.
Keywords:
biosensor; SARS-CoV-2; spike; screening; readout; smartphone; portable; interdigitated electrodes 1. Introduction
The COVID-19 pandemic has proven to be a major threat to humanity. Scientists all over the world are fighting against it, which includes developing new technologies for the detection of SARS-CoV-2.
The standard method for virus detection is real-time PCR. Despite its high efficiency, real-time PCR is a time-consuming and costly method. Therefore, it is important to develop reliable devices for point of care (PoC) virus detection [1]. The most common devices used for PoC virus screening are rapid antigen tests, which, however, show poor performance, as they are based on visual observation of the results, meaning they only provide qualitative results that cannot be automatically processed [2]. This gap is proposed to be filled by biosensors that can provide an electrical measurement, meaning a faster response time, improved sensitivity and the possibility of electronic processing of the results [3].
Even though the development of various biosensors has been reported [4,5,6,7,8,9], few have been used as complete SARS-CoV-2 screening devices.
In our previous work, we developed a label-free SARS-CoV-2 electrochemical biosensor based on the binding of the virus structural spike (S) protein to ACE2 protein [10]. ACE2 is immobilized in an interdigitated electrode (IDE) transducer [11], and the binding of the S protein (or the virus through S protein) to ACE2 [12] results in a change in the IDE electrical properties [13], hence its effective capacitance.
This paper presents the process of the evolution of the biosensor into a portable screening device for SARS-CoV-2 with smartphone readout. A portable microcontroller-based electronic readout circuit is developed, which performs effective capacitance measurements. The screening test results are acquired within 2 min and are made available via wireless transmission to a mobile application.
2. Materials and Methods
2.1. Biosensor Preparation
The biosensor preparation procedure has been previously reported [10]. In brief, gold interdigitated electrodes with an electrode length of 7 mm and an electrode surface area of 8.45 mm2 were purchased from DropSens (Asturias, Spain). On top of the electrodes, ACE2 protein was immobilized. To verify the functionality of the device, S protein was placed on top of the biosensor, resulting in its binding to ACE2 and therefore a change in the electrical characteristics. ACE2 and S protein were purchased from InvivoGen (San Diego, CA, USA). All the chemicals used were purchased from Sigma-Aldrich (St. Louis, MO, USA).
2.2. Readout Circuit
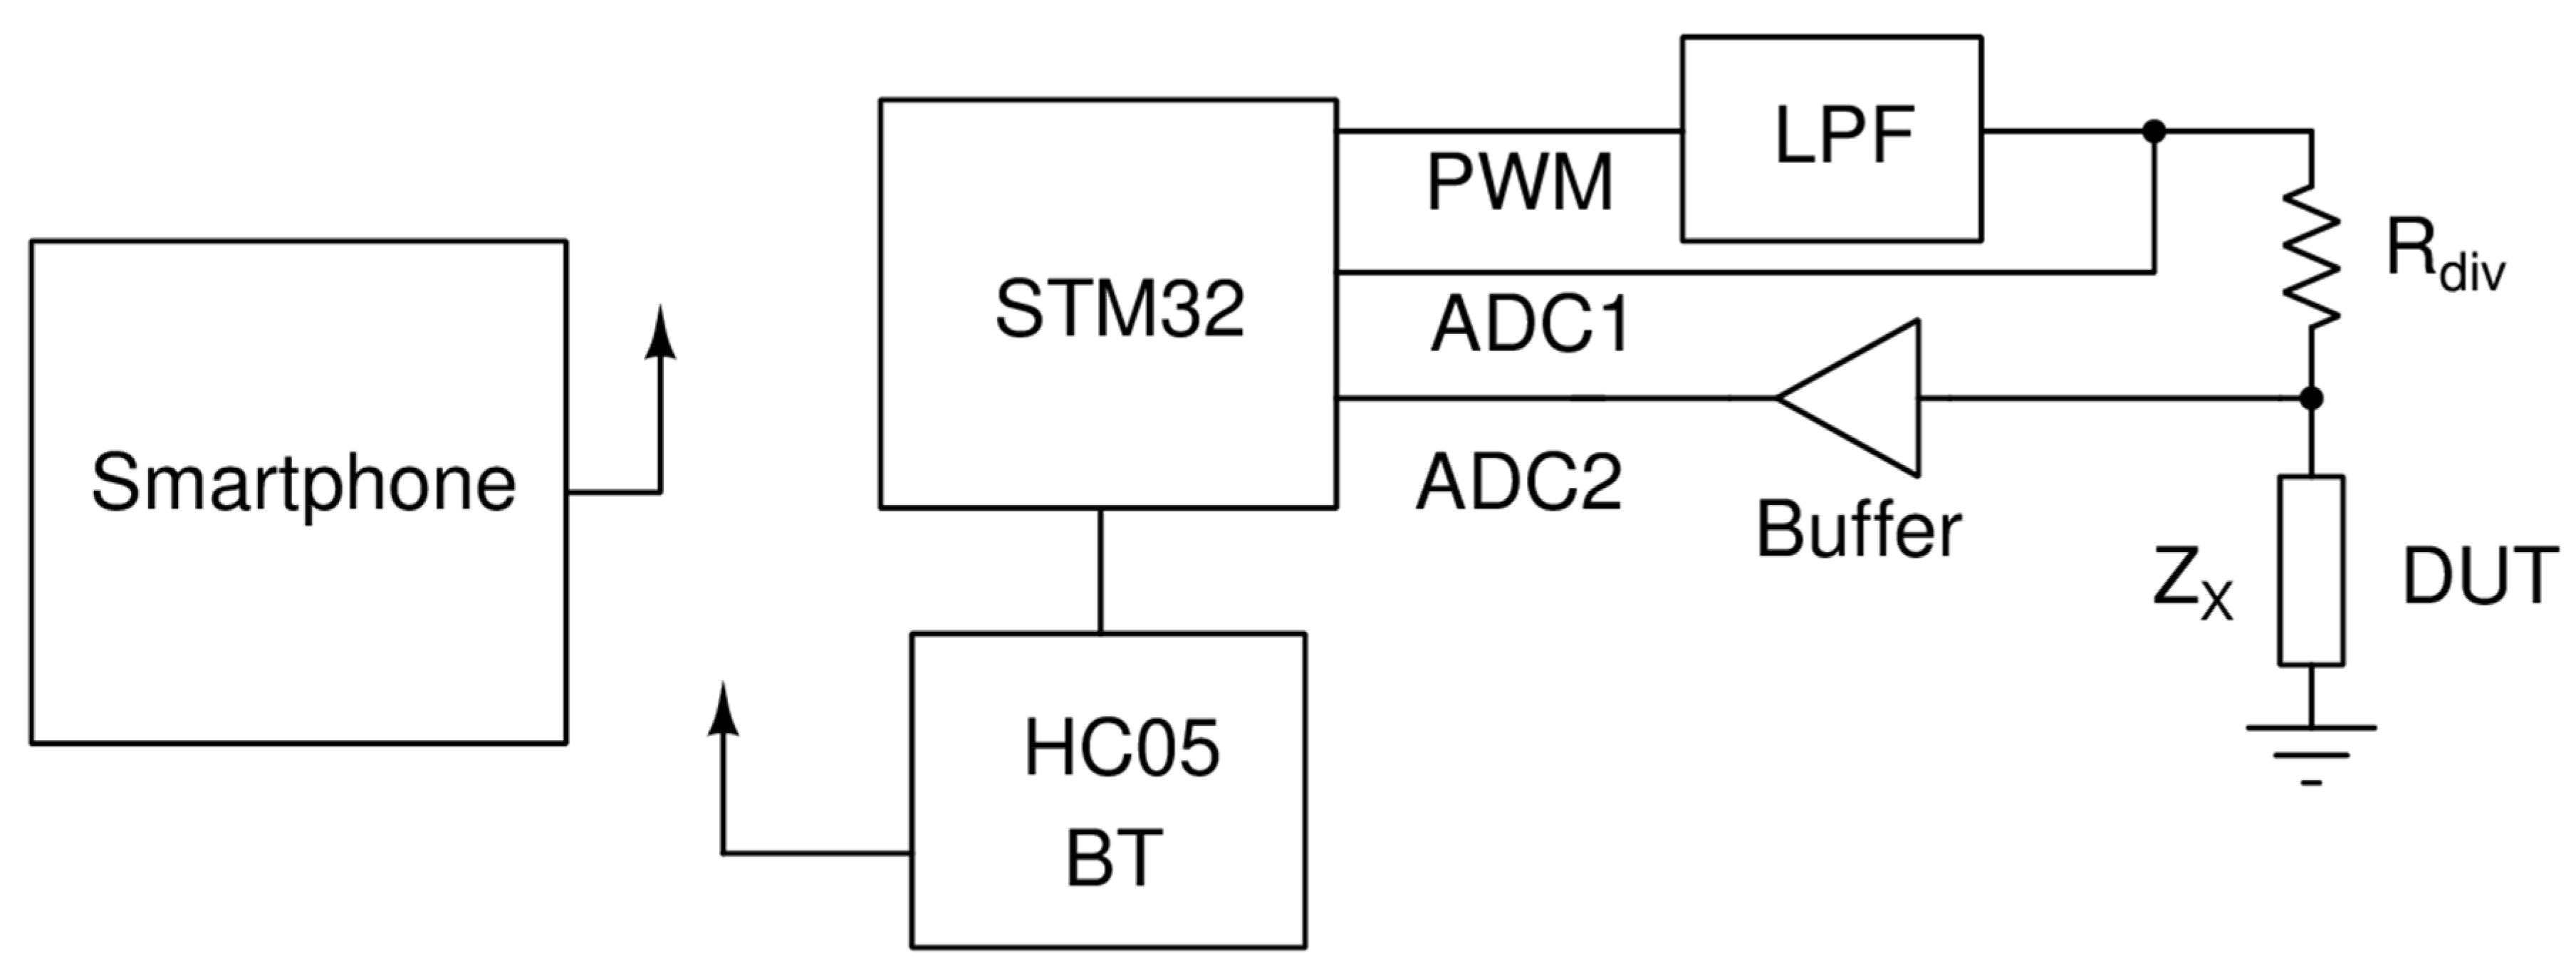
An LCR meter was designed for the reading of the biosensor. The circuit could measure capacitance ranging from 1 pF up to 3 μF. It was based on the principle illustrated in Figure 1.

Figure 1.
Working principle of the circuit.
A microcontroller unit (MCU) of the STM32 (STM32F103C8T6) family produced a high-frequency PWM signal that is then passed to a low pass filter (LPF). The LPF was a second-order Butterworth filter [14] with a cutoff frequency of 13 kHz. The output of the LPF, which was either 1 kHz or 10 kHz sinewave, drove a voltage divider consisting of a known resistor and the device under test (DUT). By measuring the amplitudes of the ADC1 and ADC2 voltages, as well as their phase difference, we could compute the impedance of DUT based on the following formulas:
where V1 is the voltage measured by ADC1, V2 is the voltage measured by ADC2, φ is the phase of V2 and the phase of V1 is 0.
In order to reduce the noise of the measurement, the amplitudes and phases of the fundamental frequency were computed using the formula of Fourier transform. The result was then calculated by averaging the readings over 512 measurements and normalized by dividing every measurement with the maximum measured value.
2.3. Mobile Application
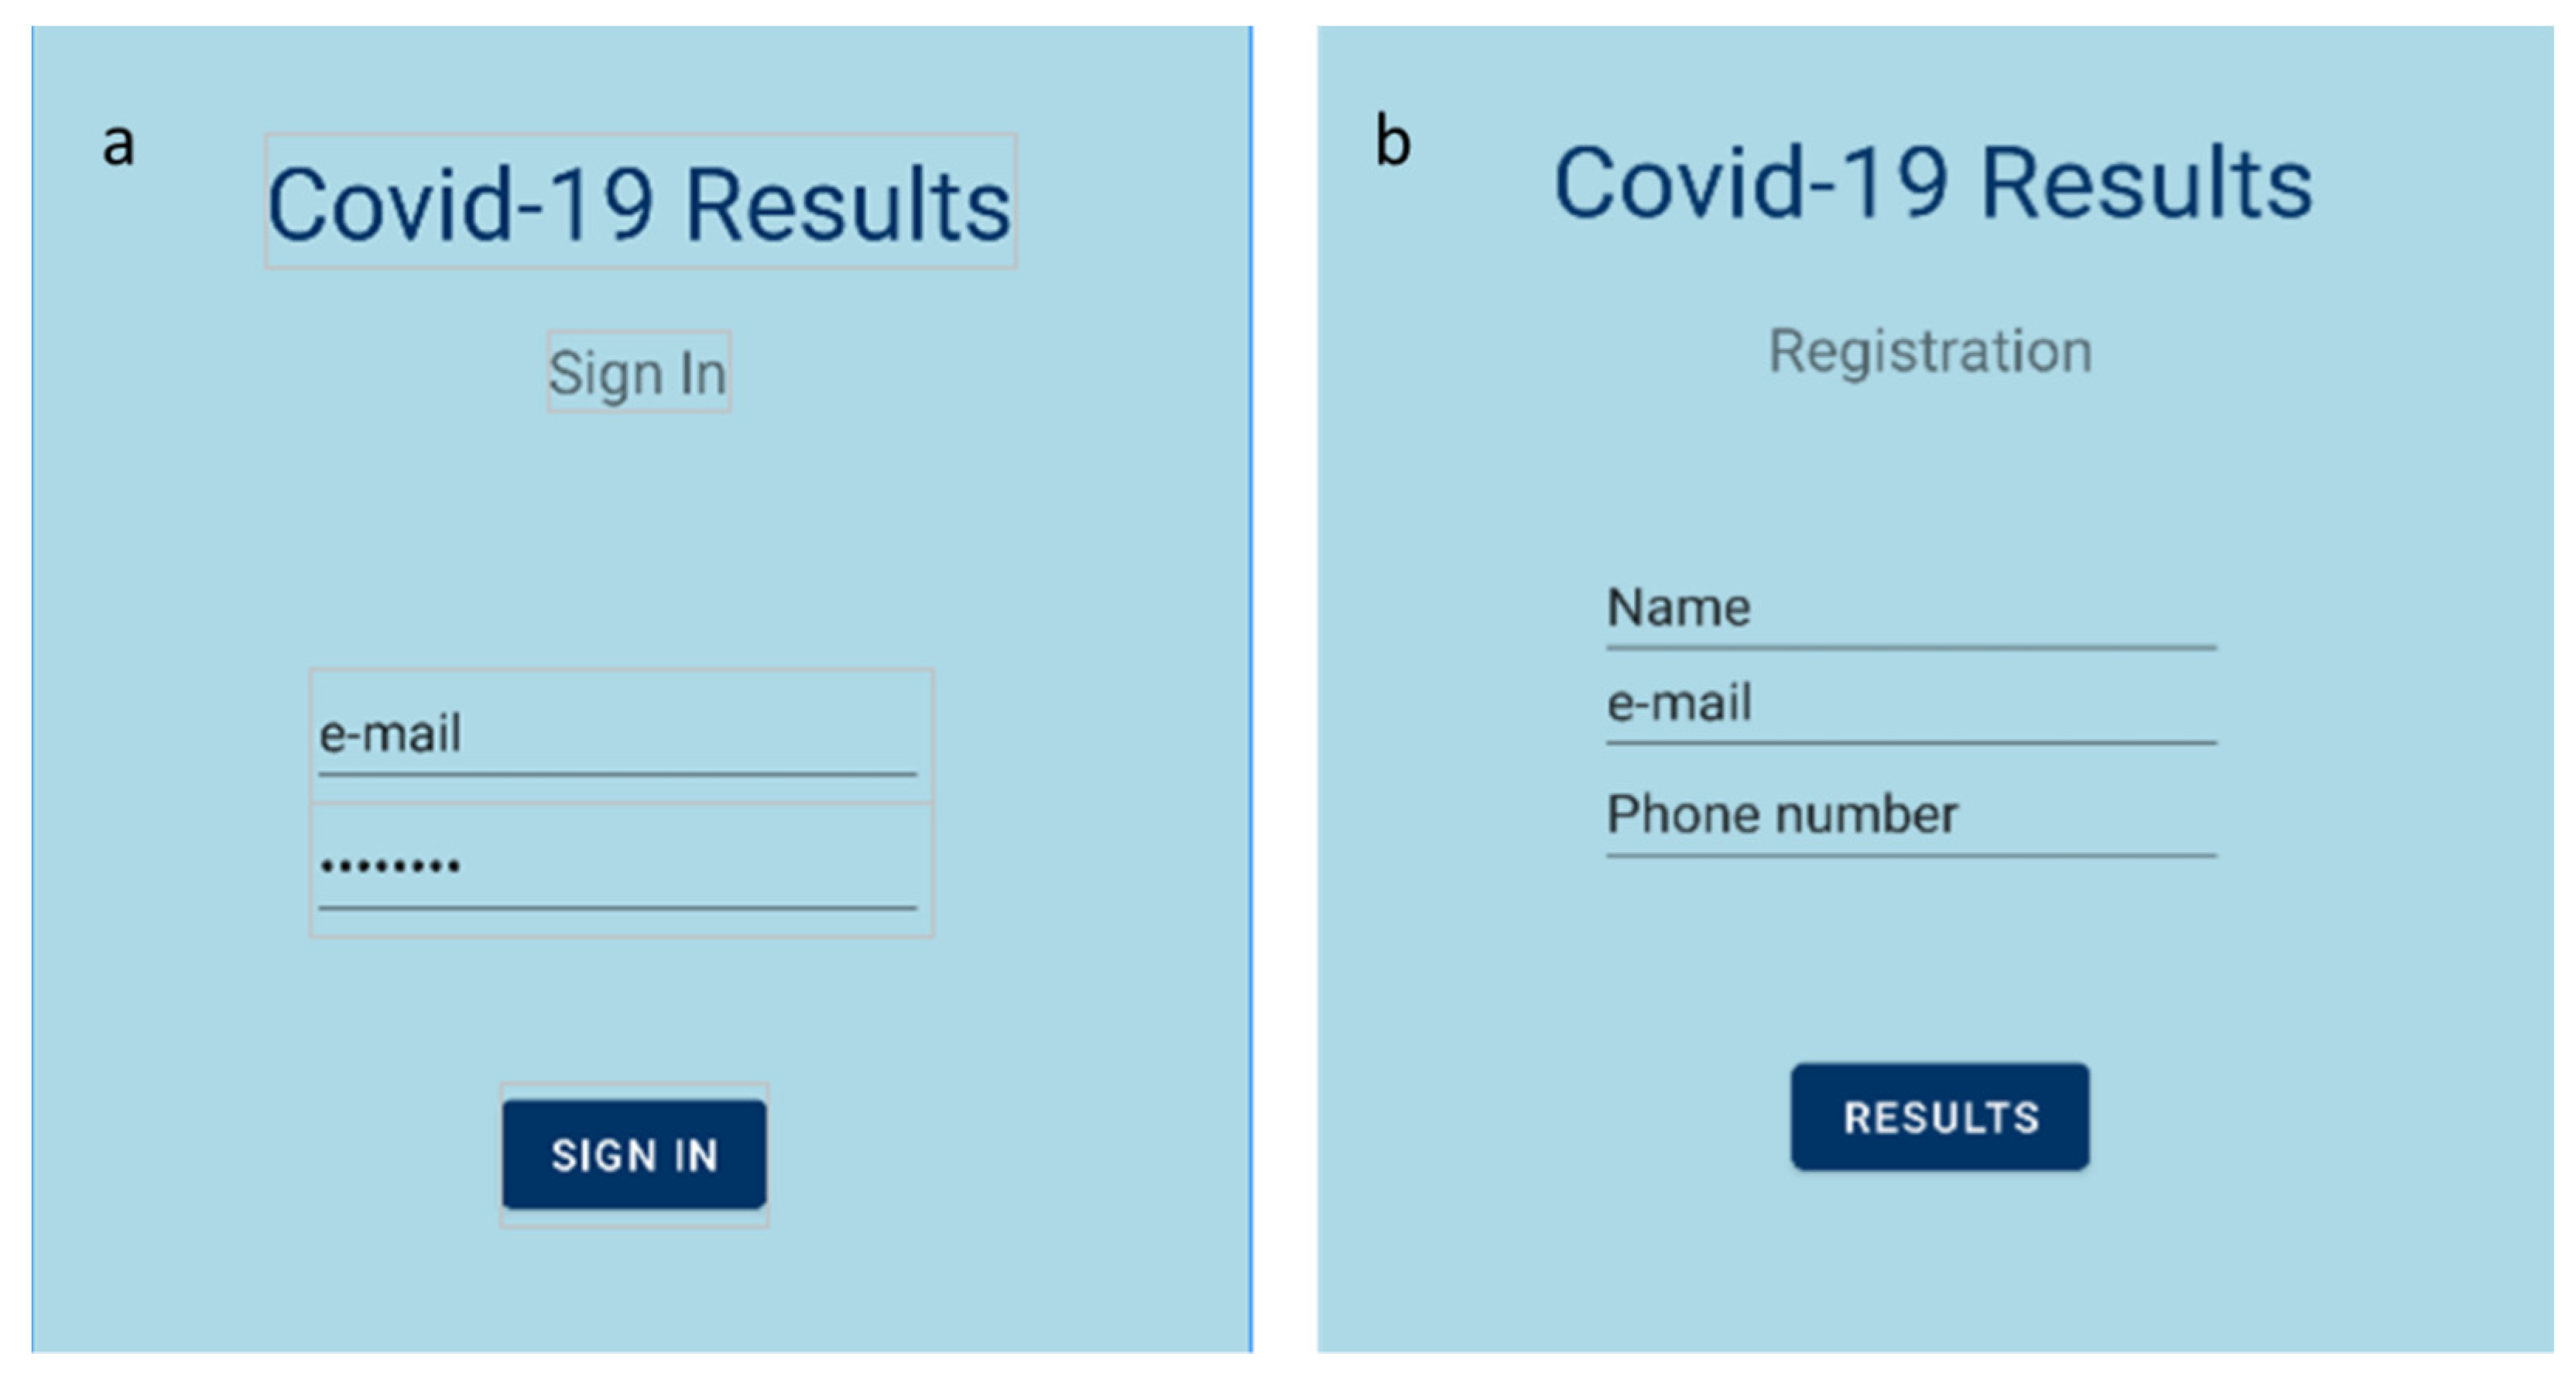
The deployment of a mobile application for easy, simple and direct access to the data provided by the sensor is considered necessary. In this project, a Bluetooth-based application for Android smartphones was designed. The Android platform includes support for the Bluetooth network stack, which allows a device to wirelessly exchange data with other Bluetooth-compatible devices over short distances. A Bluetooth transceiver module (HC-05), which is able to transmit data to the mobile application using the standard Bluetooth protocol, was added to the readout circuit. As a result, the Android application displayed the detection of S protein in the tested sample in real time. A mockup of the developed application is illustrated in Figure 2.
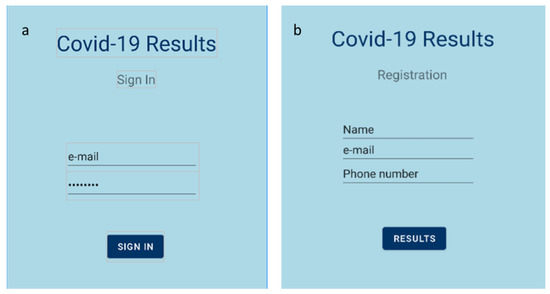
Figure 2.
Mobile application’s homepage; (a) sign in page; (b) registration page.
Google Android Studio was used for the development of the mobile application. Java was chosen to be used as the programming language, as it is the most popular language at the time of writing [15]. Regarding the graphical interface, the XML language was used.
First, the Android application allowed us to choose the appropriate Bluetooth device (i.e., the HC-05 module). When the connection was established, the application received the appropriate data packets in JSON format, sent from the readout circuit. Those data packets contained the outcome of the measurement, as well as the measured value and a timestamp. Finally, the result (positive or negative) was displayed on the screen.
3. Results and Discussion
3.1. Readout Circuit Calibration
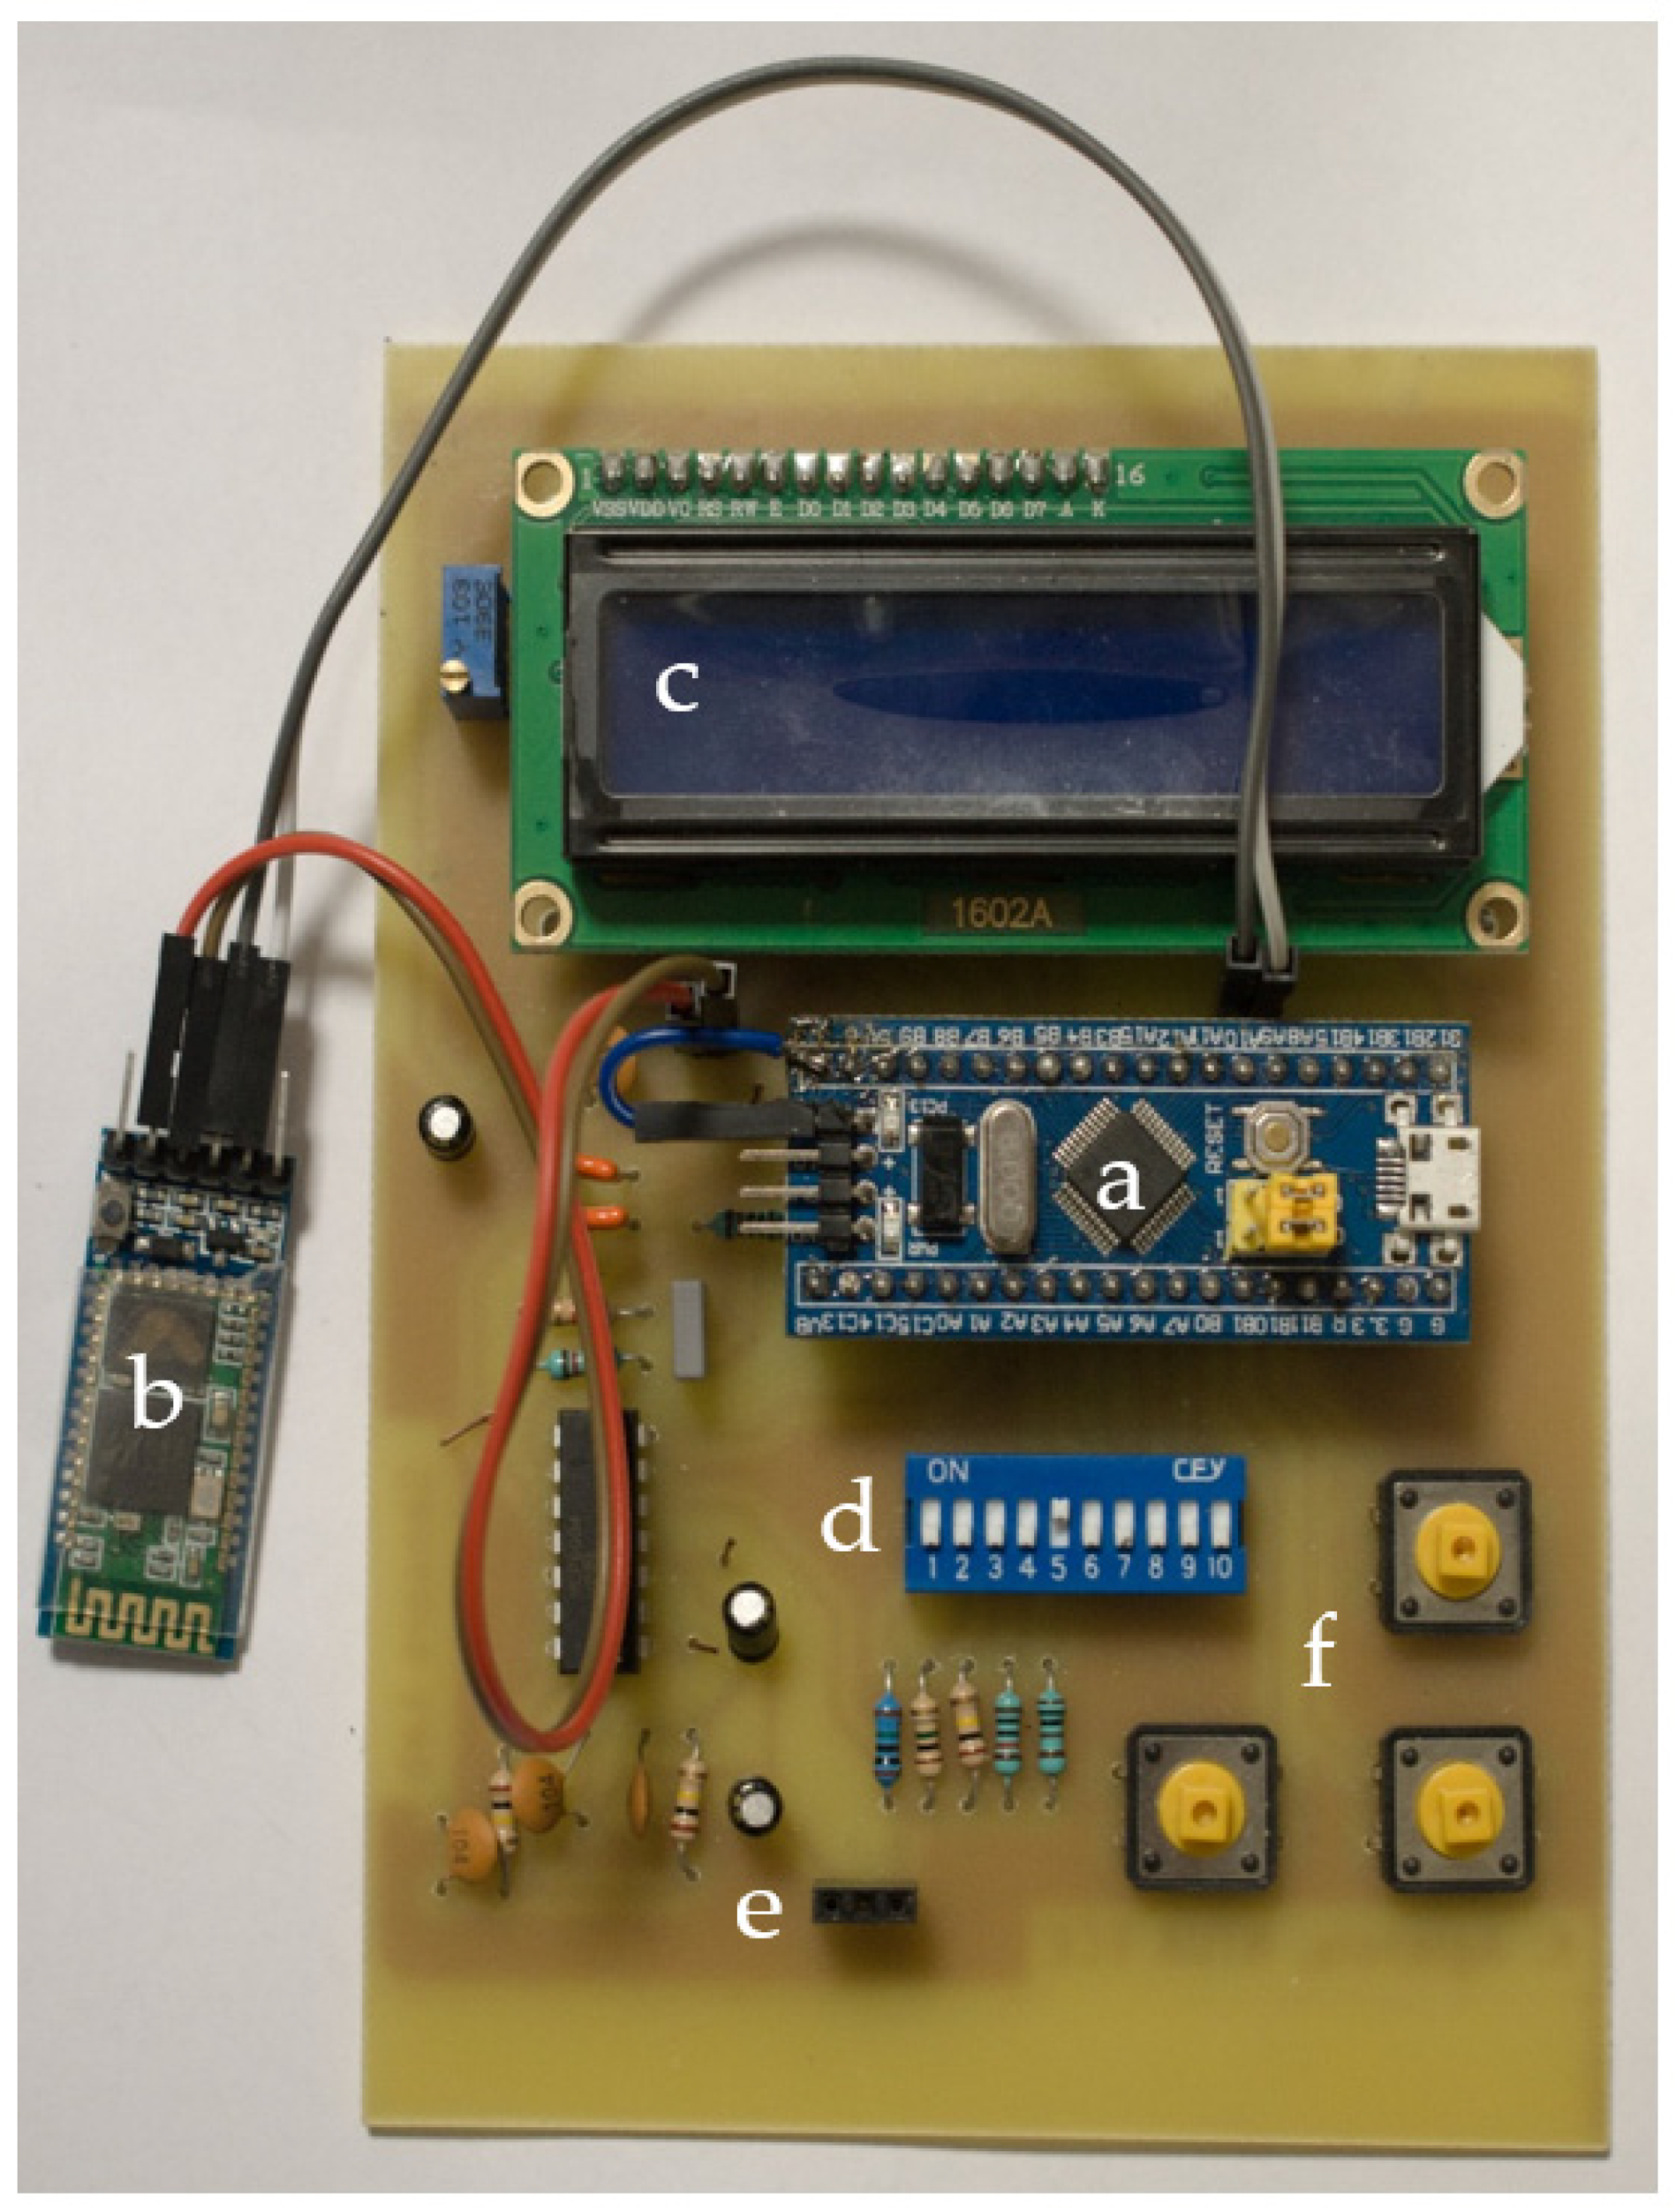
The developed prototype board is illustrated in Figure 3. In the middle of the PCB, the Blue Pill STM32 development board was placed, along with the HC-05 BT module on the left, the LCD screen on top and the DIP switches for selecting the suitable range below it. The device under test was connected on the left and right female pins of the three-pin connector at the bottom. Lastly, on the bottom right, there are three buttons responsible for specifying frequency and current range and for performing open circuit calibration.

Figure 3.
The prototype PCB; (a) Blue Pill STM32 development board; (b) HC-05 BT module; (c) LCD screen; (d) DIP switches; (e) input pins; (f) settings buttons.
The measuring circuit was calibrated by measuring commercially available capacitors and resistors and comparing the results with those of specialized instruments. For capacitance measurement calibration, an Extech LCR Meter (Extech, model 380193) was used. For resistance measurements, a Keithley multimeter (Keithley 2000 Series) was used. Capacitance measurement results are illustrated in Table 1, and resistance measurement results are illustrated in Table 2. It is shown that the developed circuit can measure capacitance and resistance with high accuracy.

Table 1.
Capacitance measurements.
Table 2.
Resistance measurements.
3.2. Device Operation with S Protein
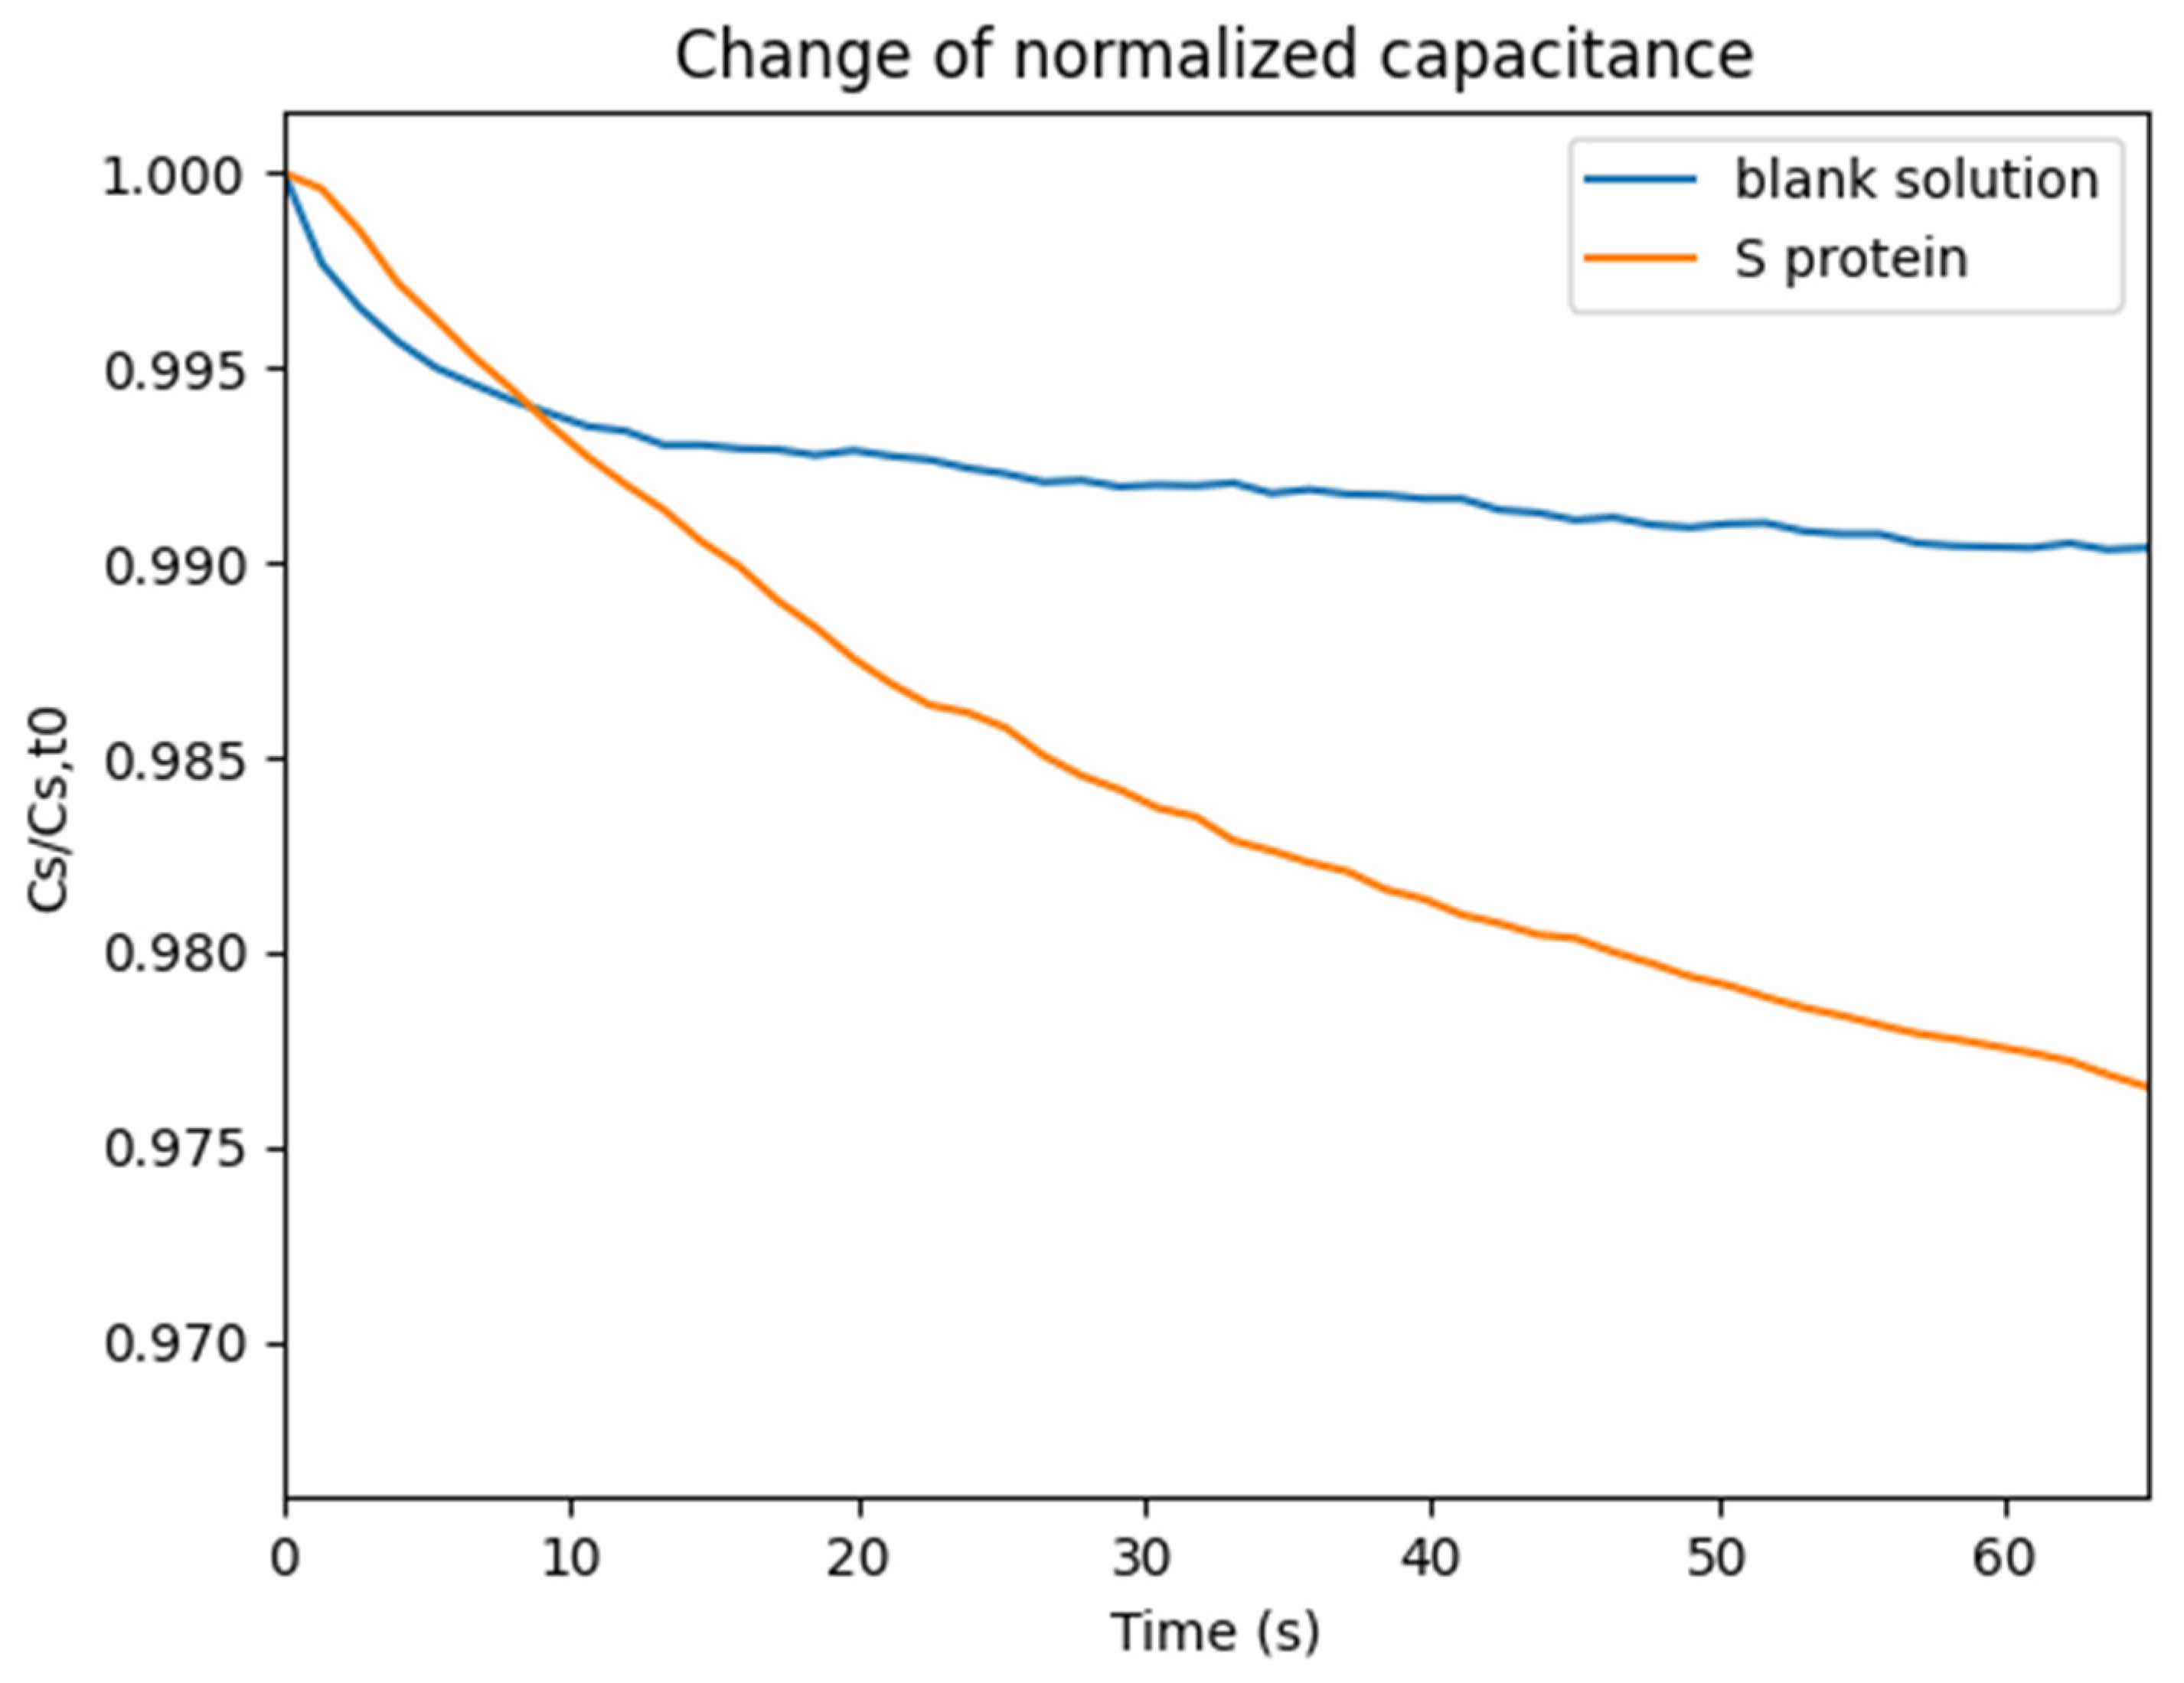
Experiments with S protein were conducted. A 20 μL solution containing S protein (2.5 ng/μL) in Phosphate-Buffered Saline (PBS) was placed on top of the sensor, and the effective capacitance change over time was monitored. A second experiment was conducted, where a 20 μL solution containing only PBS was placed on the sensor in order to calculate the blank solution response. The normalized capacitance change over time is illustrated in Figure 4.
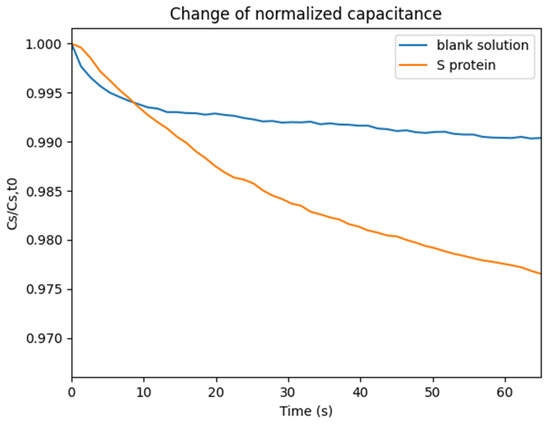
Figure 4.
Normalized capacitance change over time.
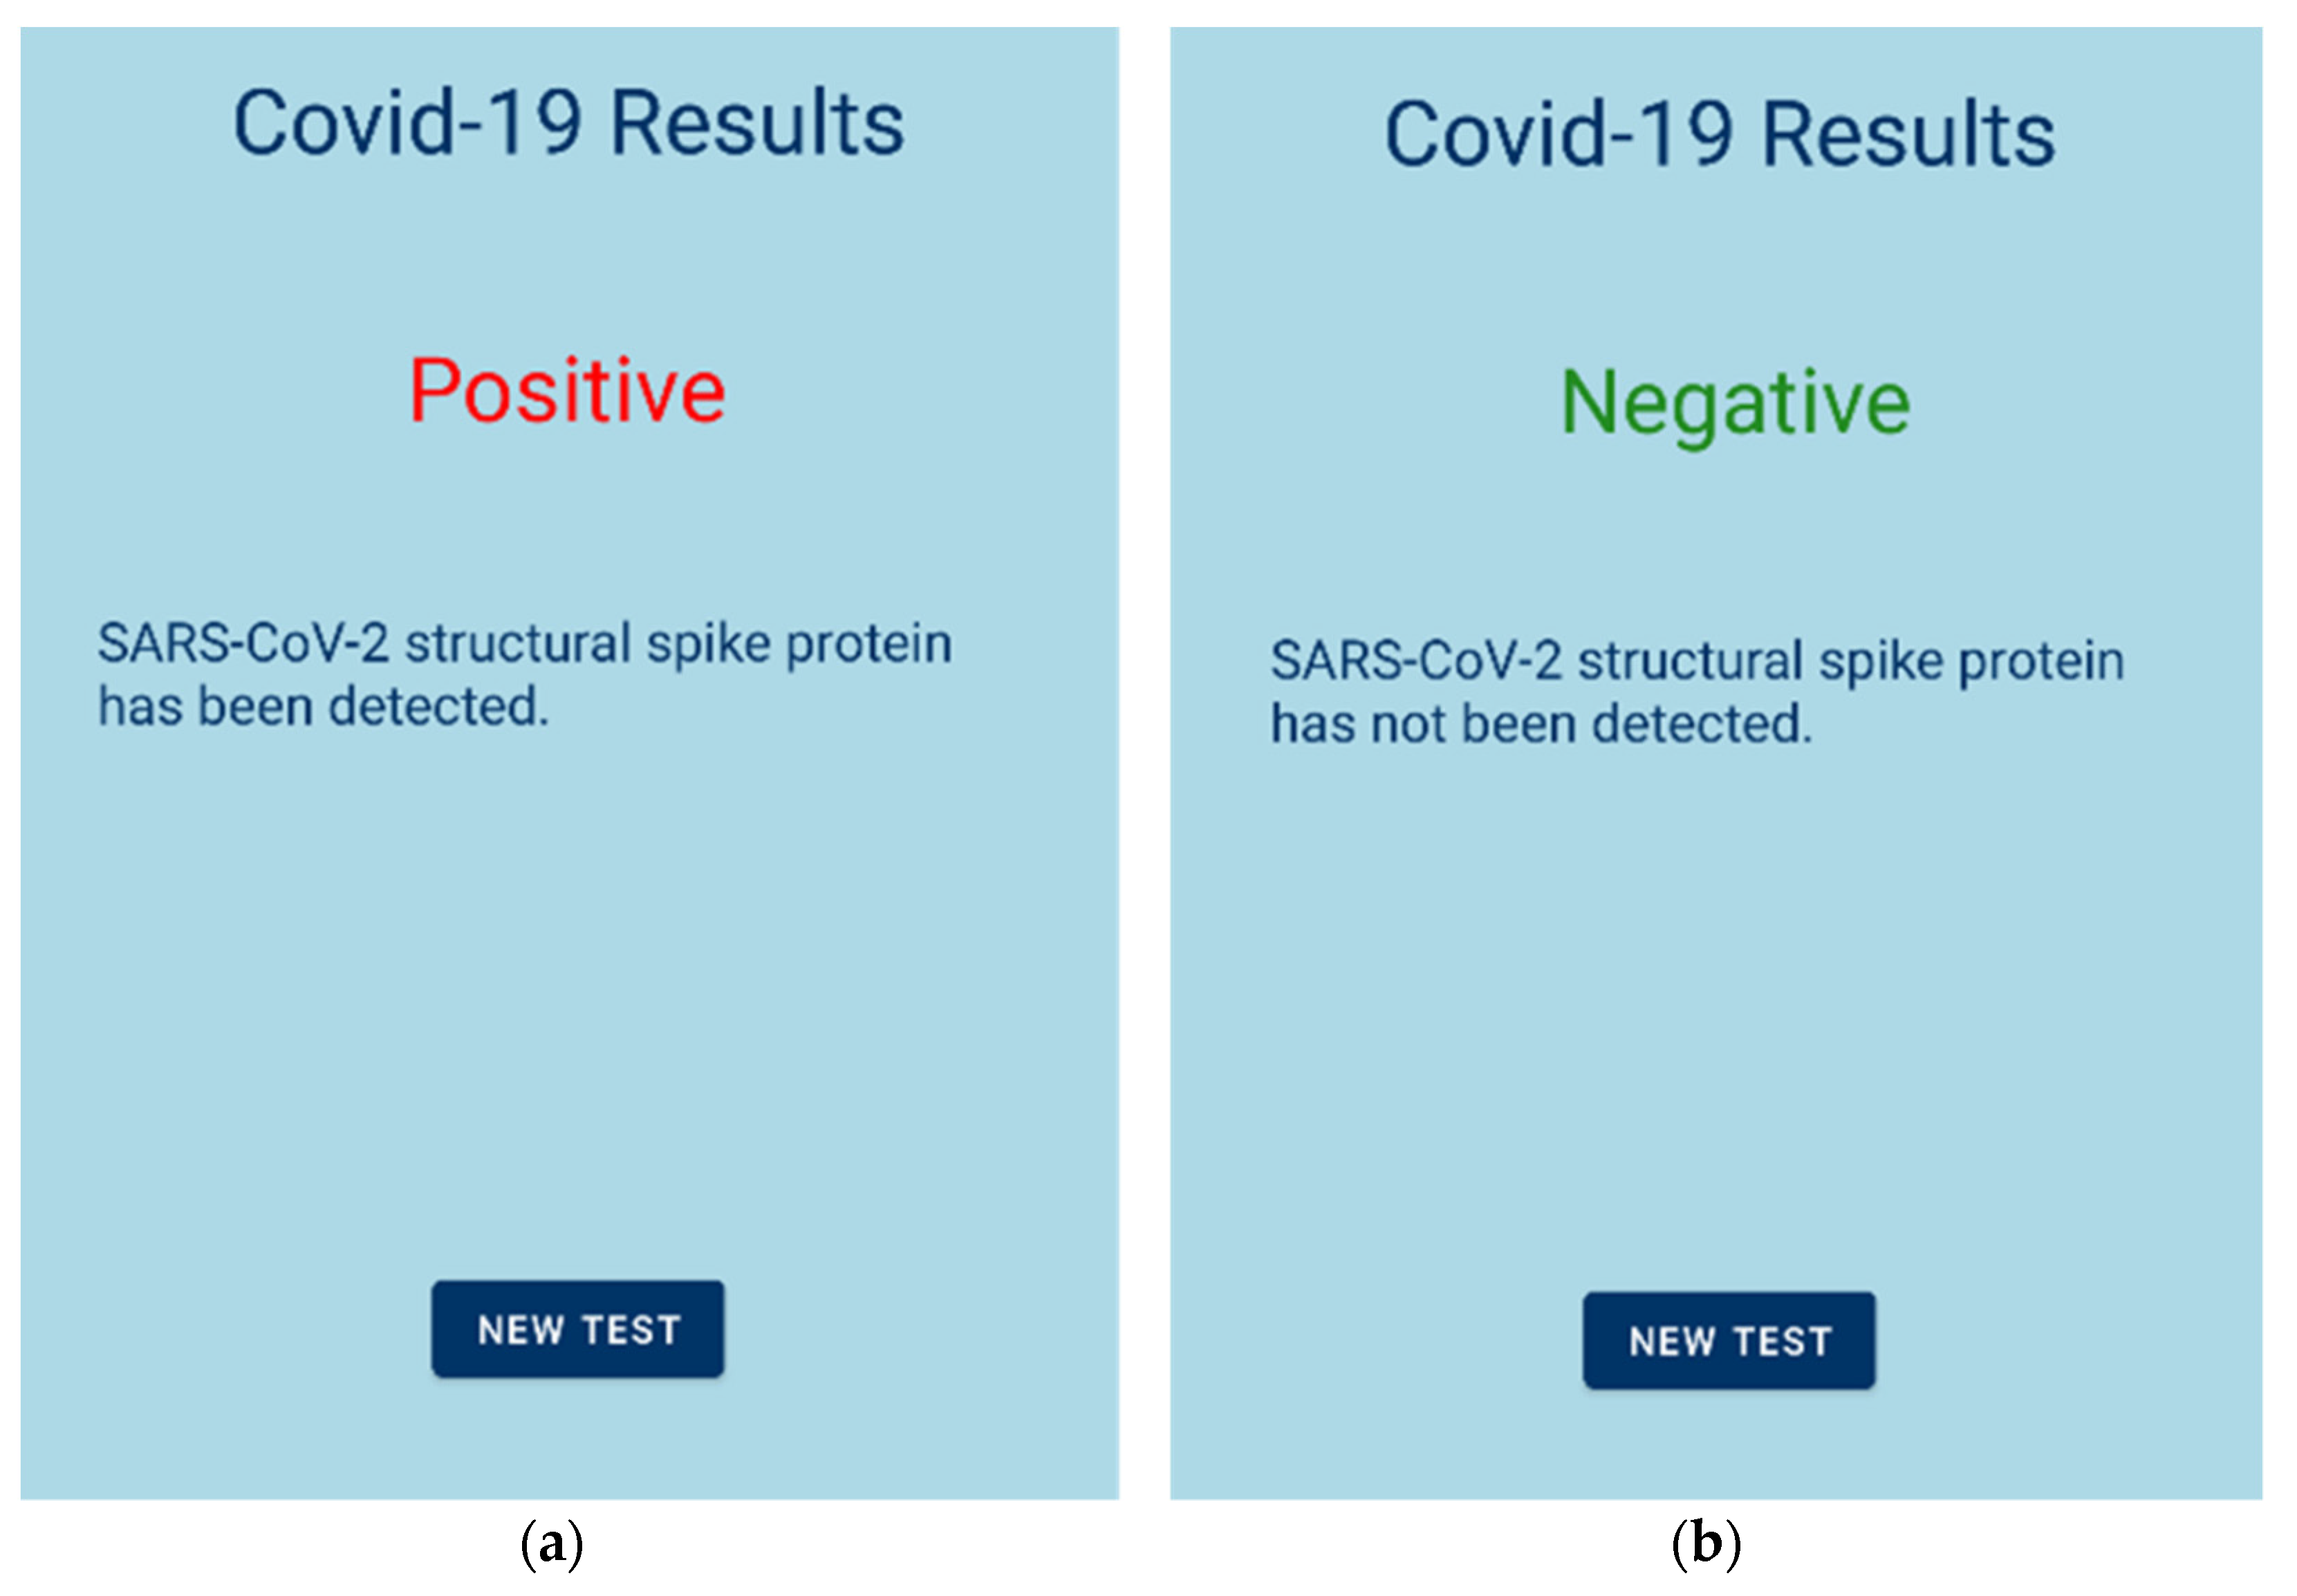
The measurement procedure was the following: The user has to open the Android application and register by entering some personal information (Figure 2b) or sign in, if the user has previously registered (Figure 2a). Then, the testing procedure begins. After 60 s of measuring with a rate of 1 sample per second, the resulting value is transmitted to the Android application via Bluetooth. If the total capacitance change exceeds 1%, the test is listed as positive for the SARS-CoV-2 S protein and the user receives the appropriate response (Figure 5a). Otherwise, if the total capacitance change is below 1%, the test is listed as negative, and the user is informed as well (Figure 5b).
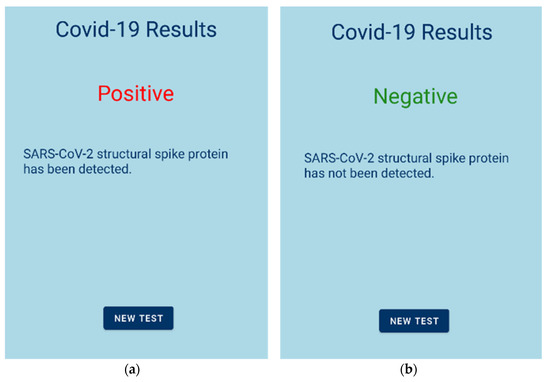
Figure 5.
Mobile application results; (a) test positive to S protein; (b) test negative to S protein.
4. Conclusions
In this project, a SARS-CoV-2 S protein detecting device was developed using the ACE2-based capacitance sensor for rapid native SARS-CoV-2 detection [10]. The device consists of a microcontroller-based electronic circuit that, as shown, can measure capacitance and resistance change with high accuracy, and an Android application, where the test results are transmitted via Bluetooth. In our future work, we want to conduct more experiments and expand the device measurements to SARS-CoV-2 patient clinical samples that have been correlated with real-time PCR.
Author Contributions
A.G. conceptualized this study, performed experiments and wrote the first draft. K.A. implemented the electronic readout circuit and performed experiments. V.P. implemented the mobile application. S.A. performed experiments and coordinated the group. A.F. co-conceived the sensor with E.H. and supervised the biosensor preparation. E.H. co-conceived the sensor with A.F. and supervised the whole work. All authors have read and agreed to the published version of the manuscript.
Funding
This research was funded by Galenica SA (Kifisia, Greece) and Katharsis Technologies Inc. (Vancouver, BC, Canada).
Acknowledgments
We would like to thank the doctors of Konstantopoulio General Hospital E. Lampas and S. Patsilinakos for their guidance in this project.
Conflicts of Interest
The authors declare no conflict of interest. The funders had no role in the design of the study; in the collection, analyses, or interpretation of data; in the writing of the manuscript, or in the decision to publish the results.
References
- Morales-Narváez, E.; Dincer, C. The impact of biosensing in a pandemic outbreak: COVID-19. Biosens. Bioelectron. 2020, 163, 112274. [Google Scholar] [CrossRef] [PubMed]
- Eshghifar, N.; Busheri, A.; Shrestha, R.; Beqaj, S. Evaluation of Analytical Performance of Seven Rapid Antigen Detection Kits for Detection of SARS-CoV-2 Virus. Int. J. Gen. Med. 2021, 14, 435–440. [Google Scholar] [CrossRef] [PubMed]
- Imran, S.; Ahmadi, S.; Kerman, K. Electrochemical biosensors for the detection of SARS-CoV-2 and other viruses. Micromachines 2021, 12, 174. [Google Scholar] [CrossRef] [PubMed]
- Mavrikou, S.; Tsekouras, V.; Hatziagapiou, K.; Paradeisi, F.; Bakakos, P.; Michos, A.; Koutsoukou, A.; Konstantellou, E.; Lambrou, G.I.; Koniari, E.; et al. Clinical Application of the Novel Cell-Based Biosensor for the Ultra-Rapid Detection of the SARS-CoV-2 S1 Spike Protein Antigen: A Practical Approach. Biosensors 2021, 11, 224. [Google Scholar] [CrossRef] [PubMed]
- Fathi-Hafshejani, P.; Azam, N.; Wang, L.; Kuroda, M.A.; Hamilton, M.C.; Hasim, S.; Mahjouri-Samani, M. Two-Dimensional-Material-Based Field-Effect Transistor Biosensor for Detecting COVID-19 Virus (SARS-CoV-2). ACS Nano 2021, 15, 11461–11469. [Google Scholar] [CrossRef] [PubMed]
- Rashed, M.Z.; Kopechek, J.A.; Priddy, M.C.; Hamorsky, K.T.; Palmer, K.E.; Mittal, N.; Valdez, J.; Flynn, J.; Williams, S.J. Rapid detection of SARS-CoV-2 antibodies using electrochemical impedance-based detector. Biosens. Bioelectron. 2020, 171, 112709. [Google Scholar] [CrossRef] [PubMed]
- Seo, G.; Lee, G.; Kim, M.J.; Baek, S.H.; Choi, M.; Ku, K.B.; Lee, C.S.; Jun, S.; Park, D.; Kim, H.G.; et al. Rapid Detection of COVID-19 Causative Virus (SARS-CoV-2) in Human Nasopharyngeal Swab Specimens Using Field-Effect Transistor-Based Biosensor. ACS Nano 2020, 14, 5135–5142. [Google Scholar] [CrossRef] [PubMed] [Green Version]
- Garg, M.; Sharma, A.L.; Singh, S. Advancement in biosensors for inflammatory biomarkers of SARS-CoV-2 during 2019–2020. Biosens. Bioelectron. 2021, 171, 112703. [Google Scholar] [CrossRef] [PubMed]
- Sharma, P.K.; Kim, E.-S.; Mishra, S.; Ganbold, E.; Seong, R.-S.; Kaushik, A.K.; Kim, N.-Y. Ultrasensitive and Reusable Graphene Oxide-Modified Double-Interdigitated Capacitive (DIDC) Sensing Chip for Detecting SARS-CoV-2. ACS Sens. 2021, 6, 3468–3476. [Google Scholar] [CrossRef] [PubMed]
- Georgas, A.; Lampas, E.; Houhoula, D.P.; Skoufias, A.; Patsilinakos, S.; Tsafaridis, I.; Patrinos, G.P.; Adamopoulos, N.; Ferraro, A.; Hristoforou, E. ACE2-based capacitance sensor for rapid native SARS-CoV-2 detection in biological fluids and its correlation with real-time PCR. Biosens. Bioelectron. 2022, 202, 114021. [Google Scholar] [CrossRef] [PubMed]
- Mazlan, N.S.; Ramli, M.M.; Abdullah, M.M.A.B.; Halin, D.S.C.; Isa, S.S.M.; Talip, L.F.A.; Danial, N.S.; Murad, S.A.Z. Interdigitated electrodes as impedance and capacitance biosensors: A review. AIP Conf. Proc. 2017, 1885, 20276. [Google Scholar] [CrossRef]
- Lan, J.; Ge, J.; Yu, J.; Shan, S.; Zhou, H.; Fan, S.; Zhang, Q.; Shi, X.; Wang, Q.; Zhang, L.; et al. Structure of the SARS-CoV-2 spike receptor-binding domain bound to the ACE2 receptor. Nature 2020, 581, 215–220. [Google Scholar] [CrossRef] [PubMed] [Green Version]
- Shang, J.; Ye, G.; Shi, K.; Wan, Y.; Luo, C.; Aihara, H.; Geng, Q.; Auerbach, A.; Li, F. Structural basis of receptor recognition by SARS-CoV-2. Nature 2020, 581, 221–224. [Google Scholar] [CrossRef] [PubMed] [Green Version]
- Karki, J. Active Low-Pass Filter Design; Texas Instruments Application Report; Texas Instruments: Dallas, TX, USA, 2000. [Google Scholar]
- Cheon, Y. Multiplatform Application Development for Android and Java. In Proceedings of the 2019 IEEE 17th International Conference on Software Engineering Research, Management and Applications (SERA), Honolulu, HI, USA, 29–31 May 2019; pp. 1–5. [Google Scholar] [CrossRef] [Green Version]
Publisher’s Note: MDPI stays neutral with regard to jurisdictional claims in published maps and institutional affiliations. |
© 2022 by the authors. Licensee MDPI, Basel, Switzerland. This article is an open access article distributed under the terms and conditions of the Creative Commons Attribution (CC BY) license (https://creativecommons.org/licenses/by/4.0/).