Proceeding Paper

An Experimental Setup for Collecting Physiological Data from Vehicle Drivers †

1
Department of Electronics, Faculty of Electronics and Automation, Technical University of Sofia, Plovdiv Branch, 25 “Tsanko Dyustabanov” Str., 4000 Plovdiv, Bulgaria
2
Center of Competence “Smart Mechatronic, Eco-and Energy-Saving Systems and Technologies”, 25 “Tsanko Dyustabanov” Str., 4000 Plovdiv, Bulgaria
*
Author to whom correspondence should be addressed.
Presented at the 15th International Scientific Conference TechSys 2026—Engineering, Technologies and Systems, Plovdiv, Bulgaria, 14–16 May 2026.
Eng. Proc. 2026, 150(1), 34; https://doi.org/10.3390/engproc2026150034
Published: 21 July 2026

Abstract

This paper presents an experimental framework for synchronizing multi-modal physiological data in a real-world driving environment. Research-grade sensors (CardioBAN, respiBAN) were integrated with consumer wearables (Huawei Watch D2, Oura, and Xmart smart rings) to monitor driver heart rate (HR) and respiration rate (RR). A custom MATLAB (version R2024a, 24.1.0)-based workflow was developed to align disparate data streams, using a nearest-neighbor principle to ensure temporal accuracy. The setup was validated through 60 min driving sessions, successfully correlating physiological responses with video feeds. Our results demonstrate that, with proper synchronization, consumer wearables can be compared with precise research-grade equipment for continuous driver state monitoring.

1. Introduction

Recent technological advancements in the automobile cabin are cutting-edge in the fields of electronics and sensors. However, these technologies are largely emerging and focus mainly on driver comfort rather than health monitoring [1]. Most vehicles worldwide remain unequipped with sensors for the acquisition of drivers’ physiological data. The existing technologies are still not able to classify the driver’s physiological state to alert for sudden illnesses and prevent collisions. The current research in real-world driving environments is presently very limited, leaving a gap in our understanding of how these technologies perform outside of the laboratory or simulators [2]. As a result, current systems cannot detect a medical emergency in a “critical mass” of drivers to effectively improve road safety.
To bridge this gap, it is necessary to explore how consumer-grade wearable technologies can be integrated into the driving task [3]. Although clinical equipment provides high accuracy in capturing physiological signals and determining physiological parameters, it is not applicable for daily use behind the steering wheel. Wearable devices such as smartwatches and smart rings offer a non-invasive alternative for continuous monitoring, but their reliability in the high-dynamic environment of a moving vehicle remains unproven [4]. Therefore, identifying specific physiological parameters that can be accurately captured by these devices is a critical step toward developing early warning systems.
Our choice to focus on HR and RR was based on their role as the primary indicators of sudden medical emergencies. In a driving environment, acute conditions like cardiac arrhythmia, syncope, or sudden onset of respiratory distress are often preceded by rapid changes in these two vital signs. HR provides a direct look at cardiovascular stability, and it is the most informative physiological parameter, while the RR is a sensitive marker for pulmonary or metabolic shifts. Monitoring both signals simultaneously allows for the identification of physiological predictors that occur before a driver loses control of the vehicle [5].
This study aims to describe the development of a specialized experimental setup designed to collect physiological data from vehicle drivers using various physiological sensors in real-road driving and different traffic conditions. The description of special hardware and software used to synchronize multiple sensor streams in a real vehicle environment is presented. Through this configuration, we aim to evaluate the accuracy of HR and RR measurements from the different sensors and how reliable the collected data is for further analysis.

2. Materials and Methods

2.1. Enrollment

Participation in this study is completely voluntary. Both the current participants involved in the validation of the experimental setup and all future participants have no known acute medical conditions that could lead to inadequate and unsafe driving. Our aim is to collect physiological data from vehicle drivers representing a diverse sample, including different genders, body mass indices (BMIs) and ages (24–70 years). The collected data are kept anonymous, as they represent sensitive personal medical data. This study was approved by the Ethics Committee for Research Involving Human Participants of the Technical University of Sofia (Protocol No. 4/20 October 2025). All volunteers were briefed on the purpose and details of the research before signing the informed consent form. So far, physiological data have been collected from 5 individuals in order to validate the proposed experimental setup.

2.2. Setup and Procedure

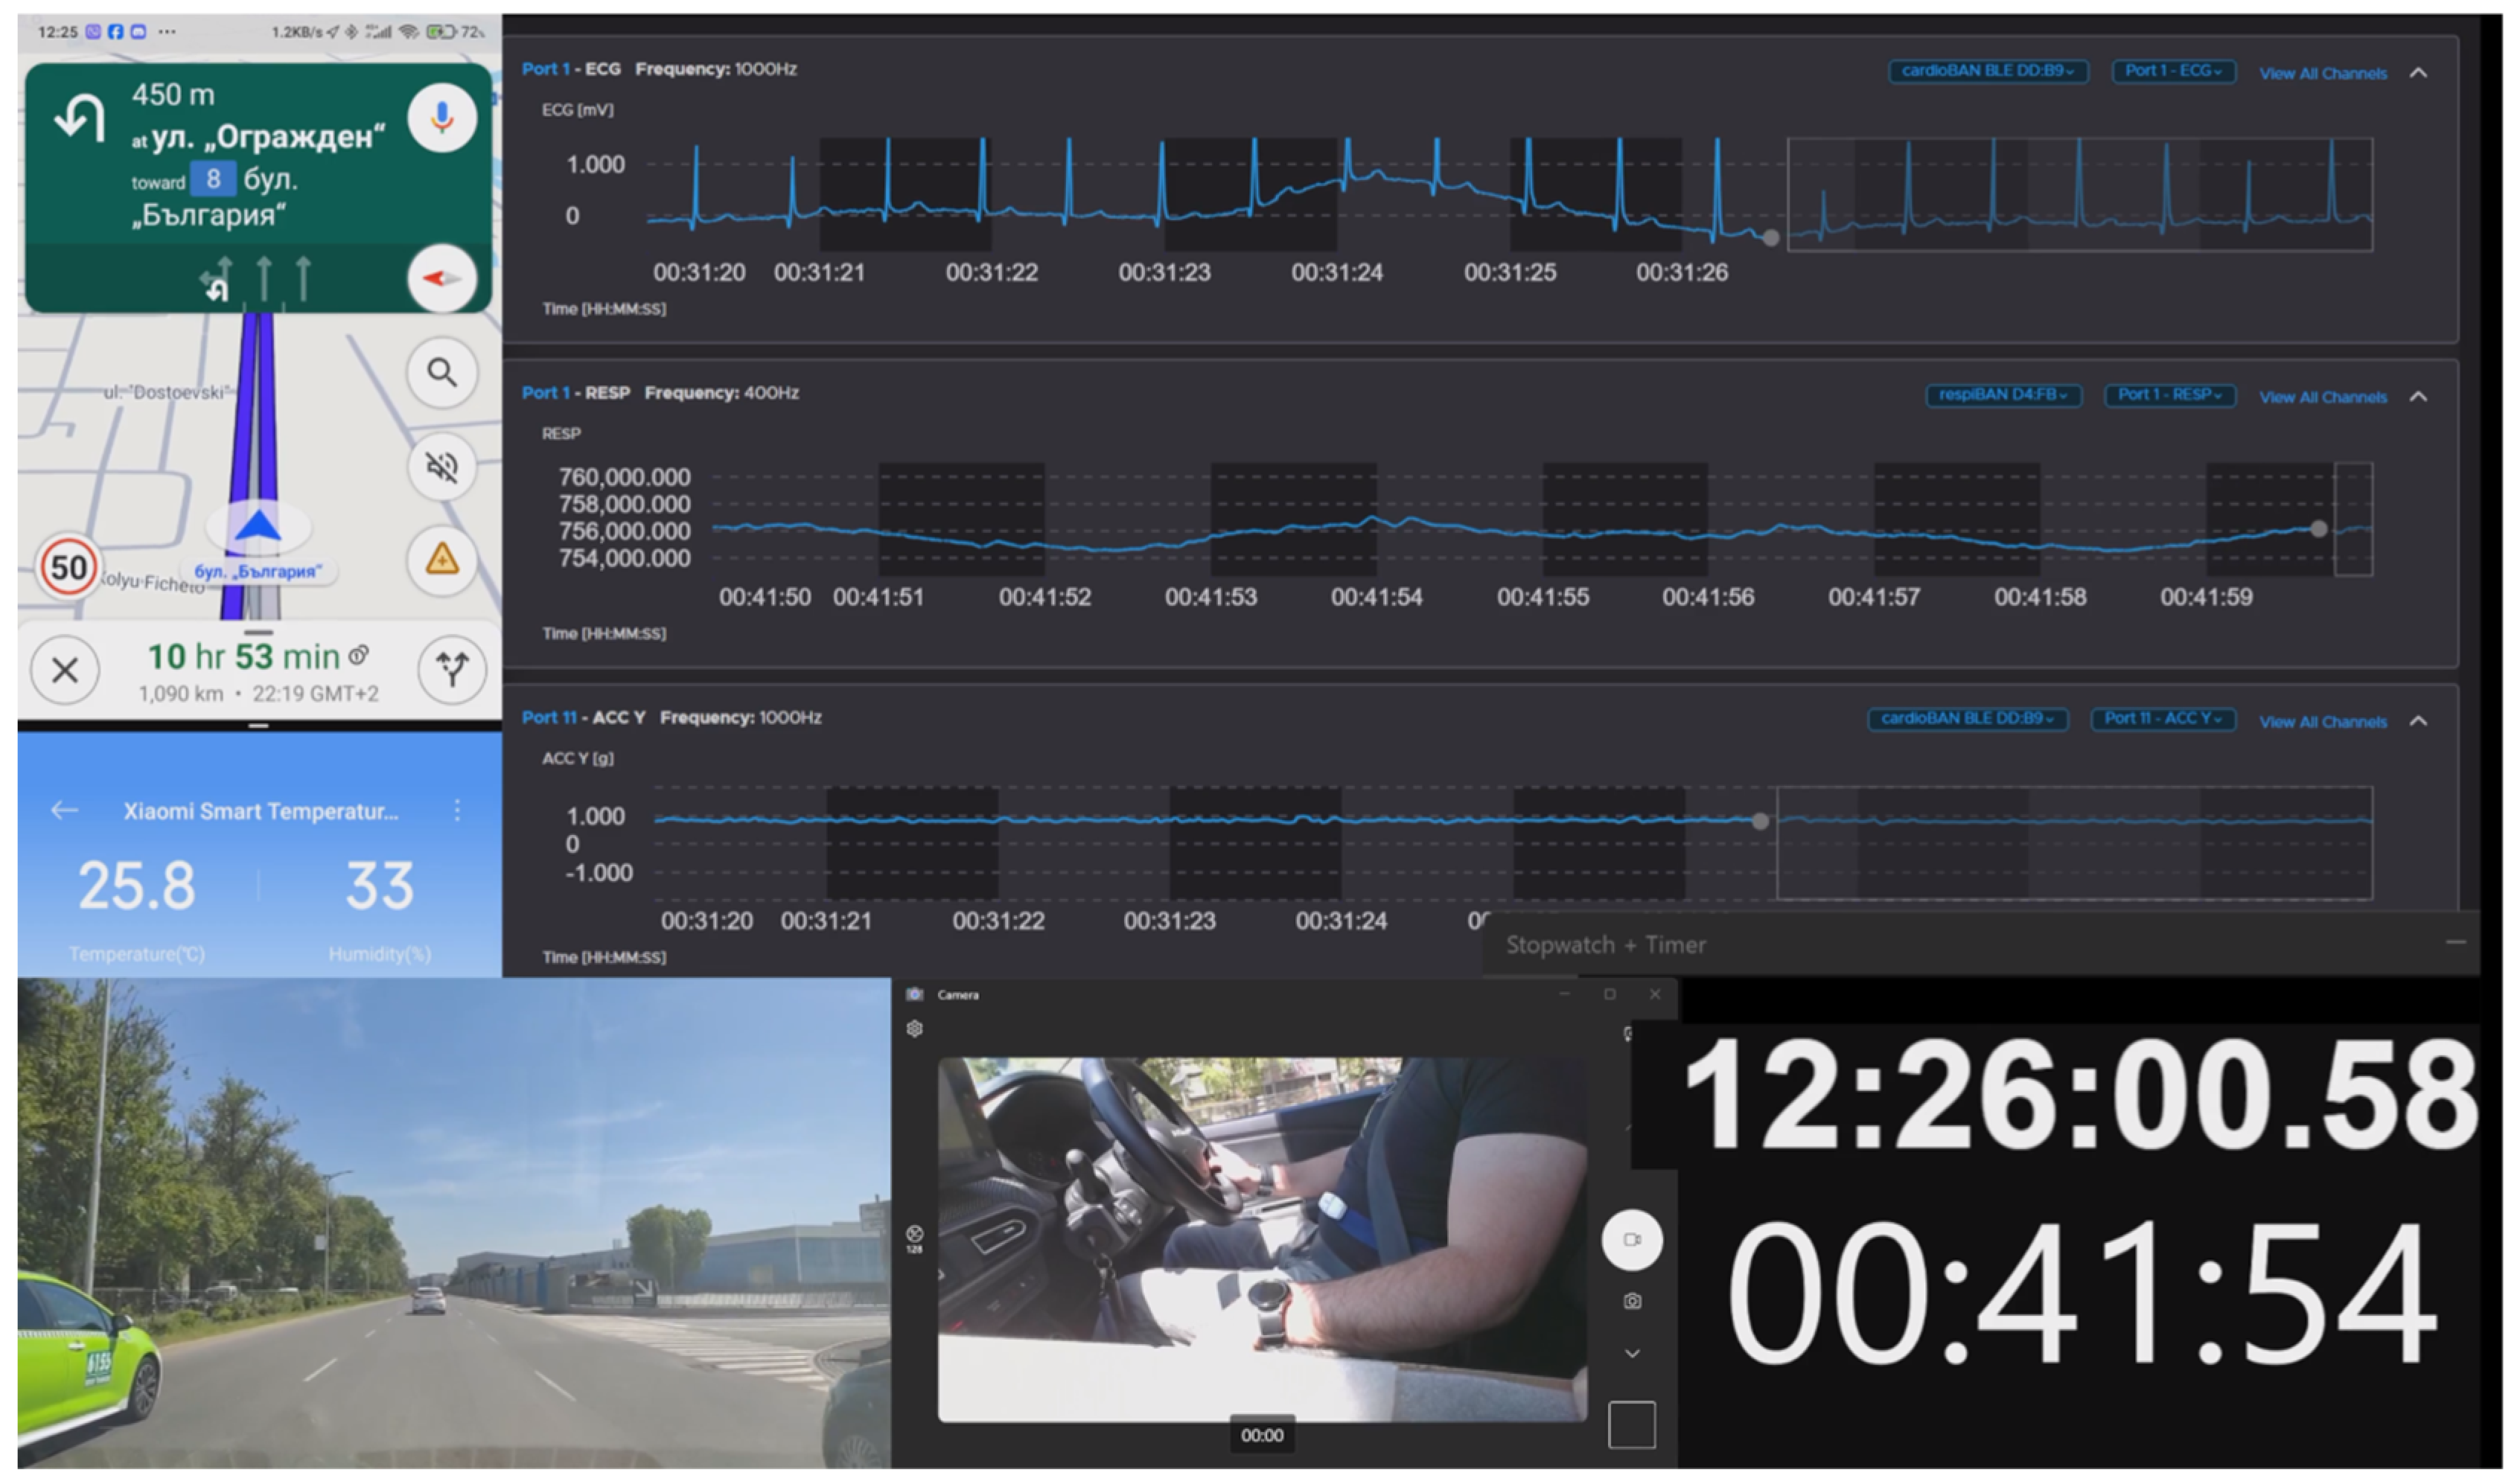
To ensure a familiar and safe environment for the best driving conditions, participants used their own vehicles for the sessions. All devices used in this study are battery-powered, ensuring the portability of the configuration in any vehicle. The setup was executed in three sequential phases: initial hardware configuration, subsequent software integration, and finally the placement and positioning of the sensors on the driver. Following the driving session, the same sequence was executed in reverse order during the concluding phase. To log the driving and its metrics, a video recording was performed. It integrates six data streams: the road ahead video; video of the driver’s movements; raw physiological signal visualization; ambient temperature and humidity inside the vehicle cabin; GPS route and speed of the vehicle; and current local time and a stopwatch for session time duration.
Before each driving session, the interior and driver setup followed a checklist protocol. The initial setup included a laptop and two Android smartphones. One smartphone camera, used as a dashcam, recorded the road ahead to log the traffic situations; outdoor conditions, such as weather and lighting; and the various road environments. A second laptop-integrated camera was positioned facing the driver, recording only the upper body and hands to ensure anonymity by avoiding facial capture. This arrangement allows for the identification of motion artifacts in the biosignal analysis and data processing. This can be achieved because of the simultaneous recording of all video streams. For example, an event captured on video, such as a driver drinking from a water bottle or turning the steering wheel sharply to avoid a potential collision, could result in a motion artifact in the raw signal at that exact moment. Thus, the video would explain the origin of the artifact. A portable temperature and humidity monitor, the Mi Temperature and Humidity Monitor 3 (Xiaomi, Beijing, China), recorded the ambient temperature and the humidity inside the vehicle. Its data was displayed on the video via Bluetooth synchronization with the second smartphone. A Google Maps (v7.3.7.1155)navigation screen was integrated into the video recording to track speed and route information. A digital on-screen clock and a timer were included in the laptop video recording; both served as a visual timestamp for data synchronization from different devices to supplement digital timestamps included in each individual data file. The driving route comprises three sections with different road traffic conditions. The starting point was located in the intensive urban traffic of Plovdiv, Bulgaria, during midday. This was followed by the city’s ring road, characterized by higher speeds, and subsequently a section of highway. The return route led back to the starting point in reverse order, passing through the opposite side of the city. The average duration of such a driving session was approximately 60 min, depending on the traffic conditions.

2.3. Instrumentation

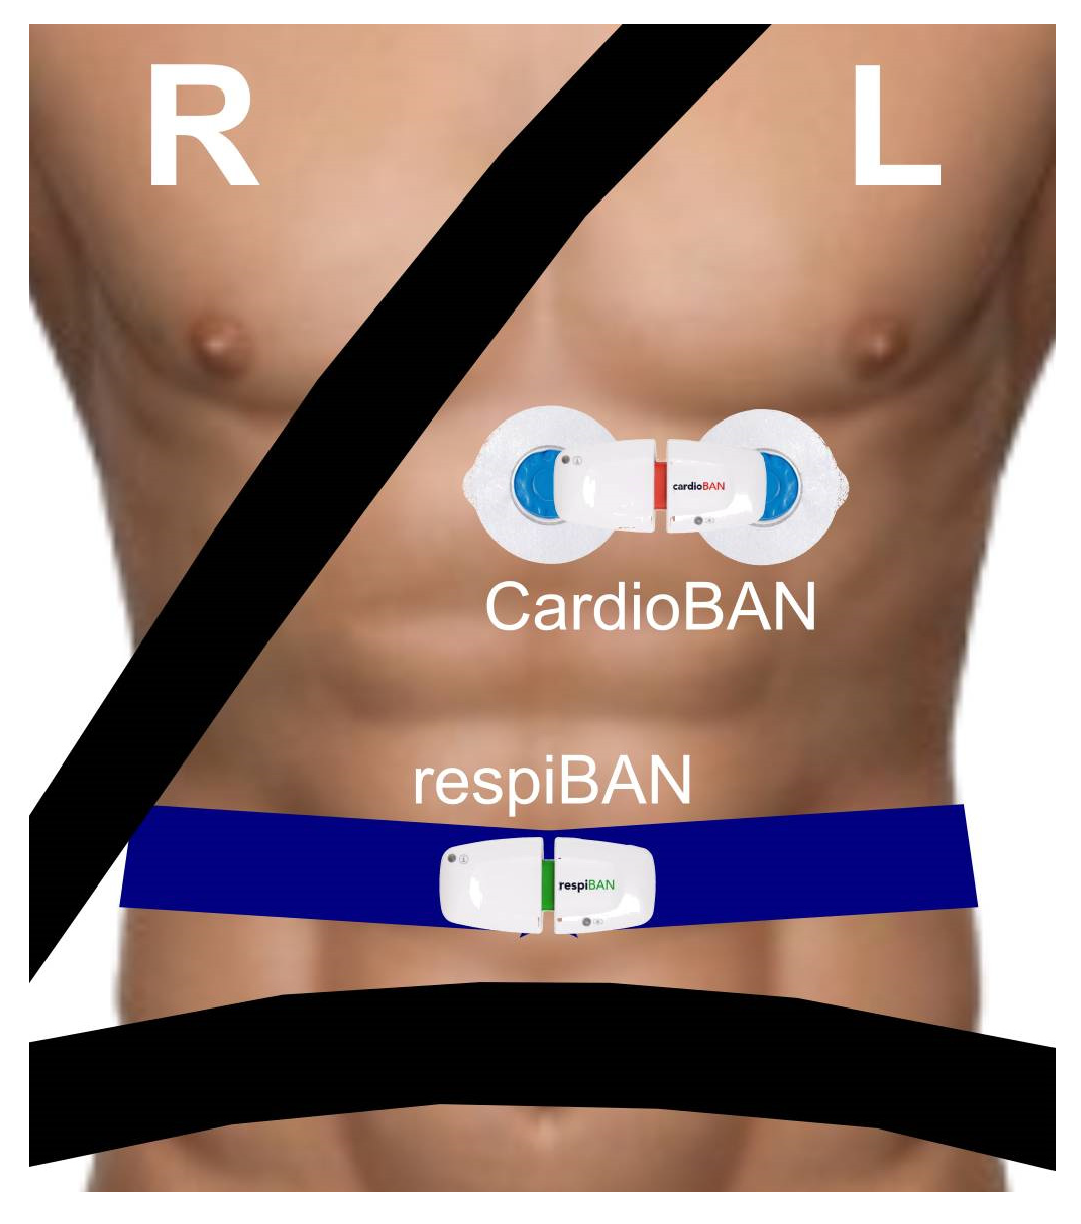
The driver setup incorporates five different sensor modalities for HR and RR monitoring. A CardioBAN BLE wearable Electrocardiogram (ECG) device (PLUX Wireless Biosignals S.A., Lisbon, Portugal) was attached to each participant to acquire a “Lead I” configuration signal. The negative electrode was placed at the level of the heart on the sternum, and the positive electrode was placed to the left (from the driver’s perspective), forming a horizontal alignment. Its selection and anatomical positioning were based on the findings of a previous study by the authors [6]. This 16-bit, high-resolution, research-grade device features a sampling rate of 1000 Hz and a default position below the chest line, making it suitable as a “gold-standard” reference benchmark. It was attached to the driver’s skin by two long-term, disposable, adhesive, electrodes (Ambu A/S, Ballerup, Denmark).
A respiBAN BLE wearable RR extraction device (PLUX Wireless Biosignals S.A., Lisbon, Portugal) was attached to the driver’s body with an inductive belt. It was positioned at the level of the diaphragm [6] over a thin layer of clothing, such as a lightweight T-shirt, to avoid direct contact with the skin and for hygiene reasons. The positioning of both devices was optimized to ensure maximum signal quality while accommodating the seatbelt of the vehicle, ensuring it did not exert pressure on the housing of each sensor or the electrodes, as shown in Figure 1.
The respiBAN raw signal was also used as a “gold standard”. The available high-resolution ECG data also allows for the comparison of various techniques for the extraction of the ECG-Derived Respiration (EDR) signal. The signals acquired by CardioBAN and respiBAN can be visualized and retrieved in real time using the Biosignals Studio software (version 1.0.3 Build 2026-01-27, PLUX Wireless Biosignals S.A., Lisbon, Portugal), integrated within the driving video stream. The raw signals are stored in output files in .h5 data format.
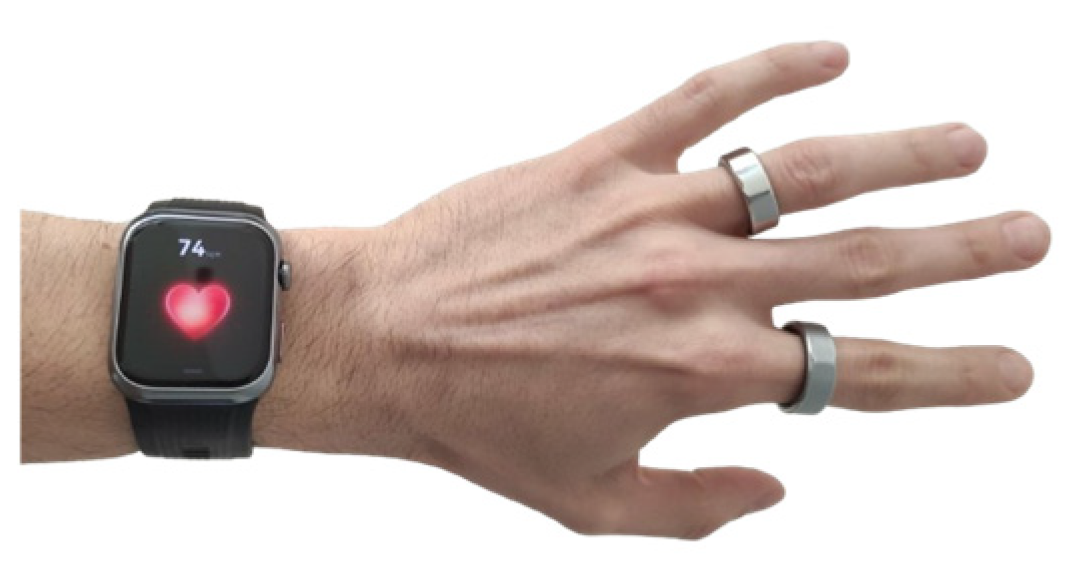
For consumer-grade tracking, a smartwatch Huawei Watch D2 (Huawei Device Co., Ltd., Shenzhen, China) was used for continuous HR data acquisition during driving. As the device is a certified medical-grade instrument for blood pressure and ECG monitoring, each participant’s baseline measurements were recorded in a resting state before the initiation of the driving task. After the driving session, the same measurements were obtained and recorded. Following the manufacturer’s clinical guidelines, the watch was positioned on each participant’s non-dominant wrist, approximately two centimeters above the ulnar styloid process, moving toward the forearm, as shown in Figure 2.
As wrist diameter varies among participants, the tightness of the strap was adjusted by the researcher to ensure optimal contact between watch sensors and the skin.
For comparative analysis, two distinct categories of smart rings were employed: a premium, clinically cited device “Oura ring Gen3” (Oura Health Oy, Oulu, Finland) [7,8] and a low-cost alternative “Xmart” smart ring (Xmart, Sofia, Bulgaria, manufactured in China). This study aims to assess their performance and accuracy in measuring HR compared to the reference devices described above. Both rings were positioned on fingers in accordance with the manufacturer’s recommendations. The alignment was maintained by ensuring that the sensors were positioned against the palmar side of the finger (Figure 2), providing stable contact with the digital vasculature while minimizing movement related noise. Due to anatomical variations among participants, a proper fit was not always achievable for the ring sizes used. If one of the rings did not fit tightly on the finger, it was not used in the driving session.
The corresponding smartphone application for the smartwatch and the Oura ring was used to initiate exercise mode. In this mode, the measurements of the two wearables were extracted every five seconds. Both applications support the exportation of the data to cloud services, enabling them to be downloaded as data files in .csv and .tcx formats. Those files are available for retrieval after the termination of the exercise mode at the end of the driving session. In contrast, the Xmart ring application was operated in normal mode, which records HR at 5 min sampling intervals and does not provide a native data export feature. To meet the privacy requirements, every participant’s data was stored in an anonymized research account for each application of the corresponding wearable device. All three downloaded files were converted into Excel format and stored in anonymized files.
Upon the completion of the session, each device generated a dedicated output file used as input for a MATLAB (version R2024a, 24.1.0) script. This script was developed to extract raw ECG and RR signals from the .h5 file, and we combined them with the data from the three wearables into a single spreadsheet. While the smartwatch is used by every driver by adjusting its strap, one or both rings can occasionally be omitted because of misalignment with finger sizes. For this reason, the smartwatch timestamp was selected as the reference for time synchronization. The script identifies the nearest timestamps in the rings’ data files to the reference one and aligns the corresponding measured HR values with the smartwatch data (matching date, hours, minutes and seconds where possible). This strategy yields four HR values and one RR value for each reference timestamp, enabling future direct data comparison and accuracy evaluation. If data from one or both rings is missing for a particular timestamp, the script fills the corresponding cells with Not a Number (NaN) values. This ensures that the spreadsheet structure remains consistent for the final data comparison and accuracy evaluation.


3. Results

3.1. Data Collection and Setup Validation

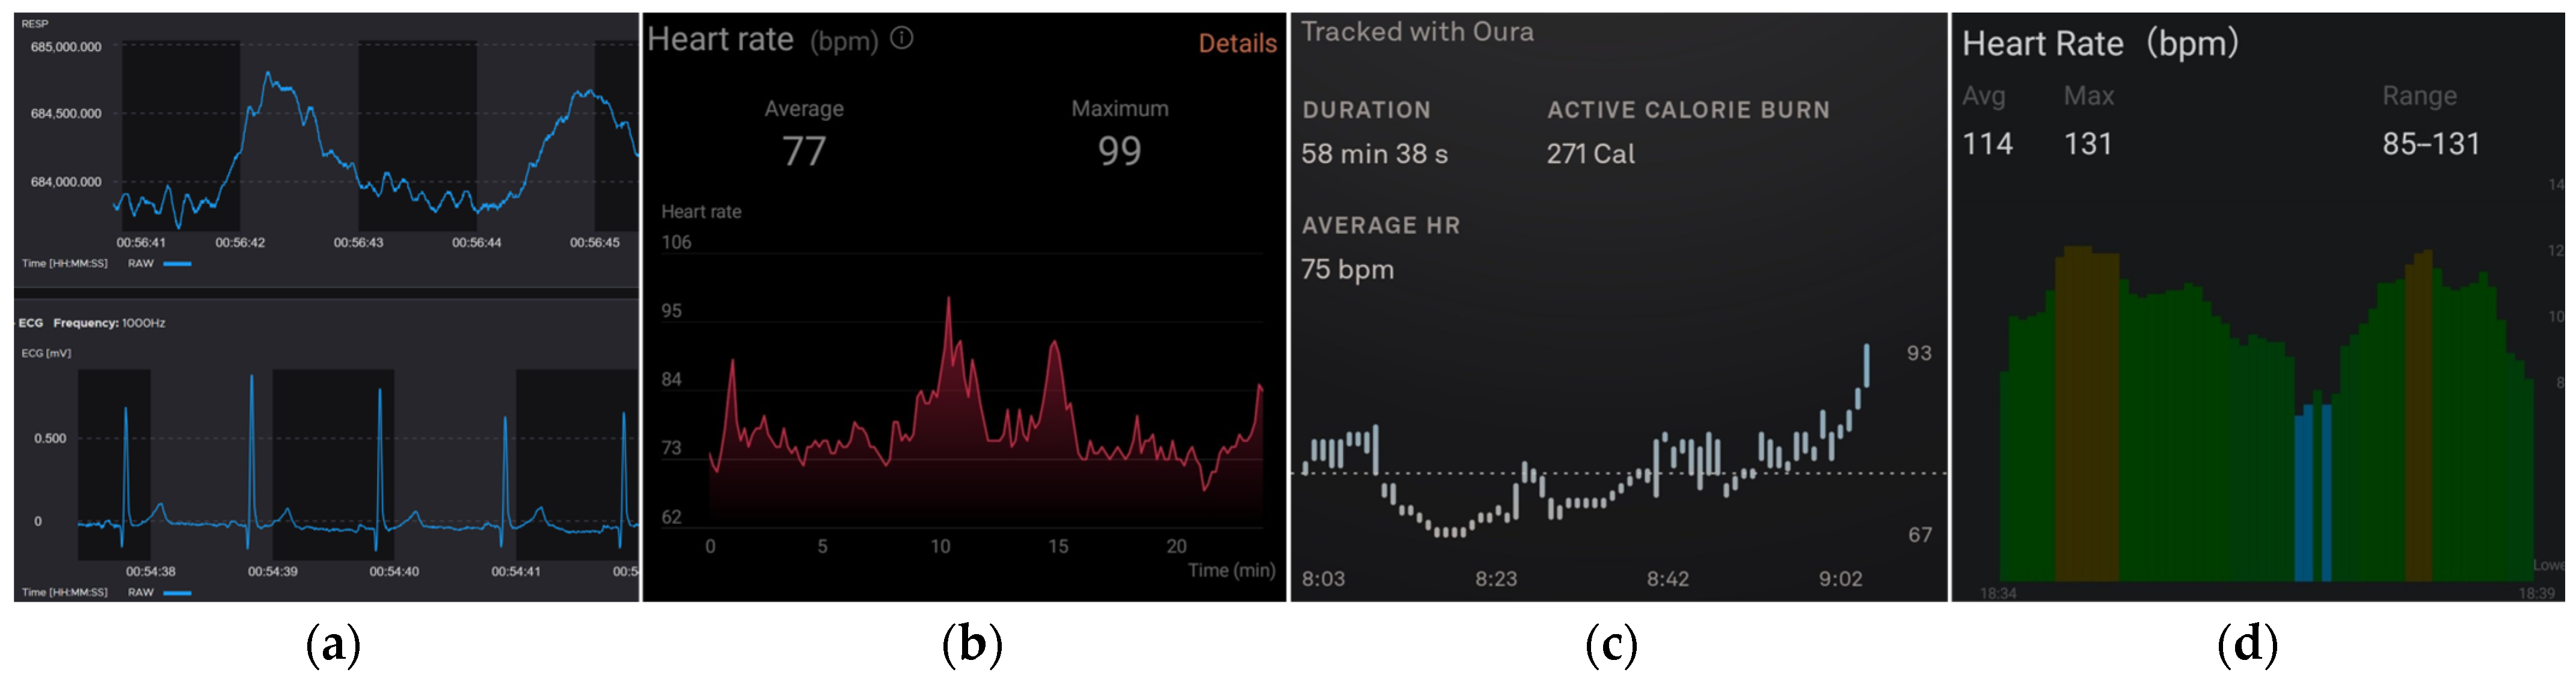
The experimental setup was validated through driving sessions with five participants, each lasting approximately 60 min. Out of the five planned sensor modalities, the CardioBAN, respiBAN and the Watch D2 provided continuous data streams throughout all sessions. In contrast, the use of smart rings was limited by anatomical variations. At least one ring was omitted in three sessions where a secure fit could not be achieved. During two of the sessions, all five data files were collected—Figure 3. Although five distinct data streams were recorded, only four interfaces are displayed, as Biosignals Studio (Figure 3a) serves as a unified platform for the simultaneous visualization of both ECG and respiration signals. These screenshots are provided for illustrative purposes to demonstrate the various proprietary environments from which the raw data were synchronized.
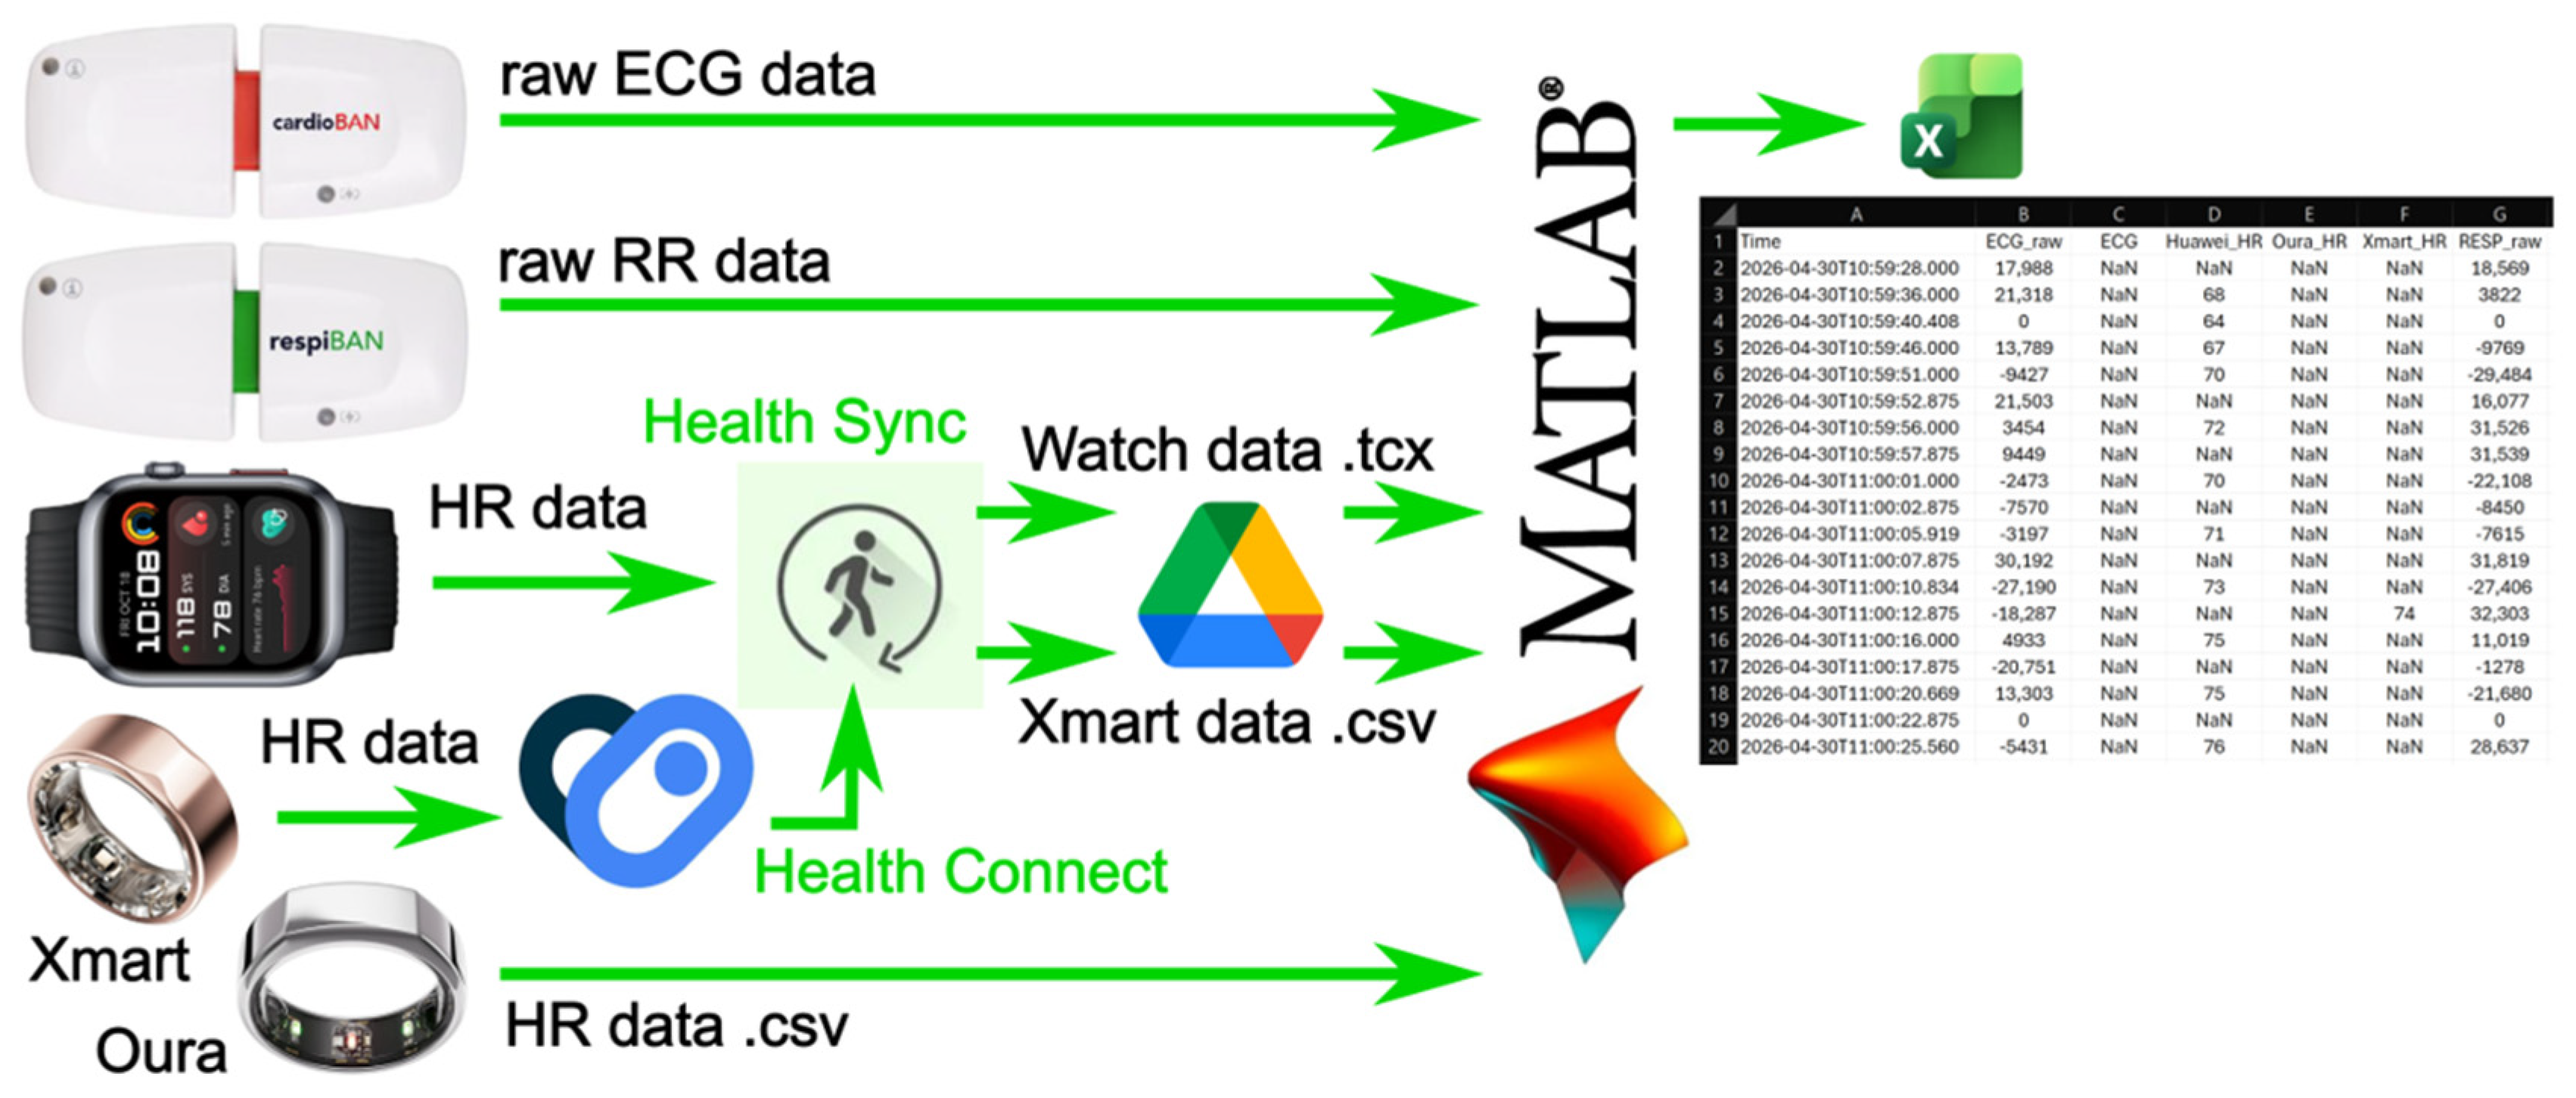
Table 1 summarizes the technical details for each device. Biosignals Studio generated .h5 files stored in the laptop’s local storage. However, there is no direct access to the data generated by the three wearables, as they are proprietary commercial devices. For instance, the Xmart ring uses the JCRingPro mobile application for data visualization and management. Since this application does not support direct data export, it was integrated with the Health Connect application to serve as a gateway. To handle the data limitations of the proprietary systems, we used Health Sync (Version 7.8.9.4, AppyHaps, The Netherlands) as a tool to bridge the gap between the different platforms. This approach effectively enabled the automated synchronization of health metrics from closed systems, such as Huawei Health and Health Connect, and their conversion into an accessible format for further analysis. Once synchronized, Health Sync offloaded the captured datasets to Google Drive, where they were stored as accessible and readable files (e.g., .tcx or .csv). Each file provided a detailed record of HR values mapped against precise digital timestamps, ensuring reliable data alignment for subsequent analysis. The Oura ring data were downloaded directly from their cloud service—Membership Hub. By using this software setup, we were able to bypass vendor-specific data restrictions and integrate the datasets into a single, unified environment—Figure 4.

3.2. Multi-Sensor Data Synchronization

For the data processing stage, the input files (excluding the .h5 format) were pre-formatted into Excel spreadsheets. A specific naming convention was applied to each file, consisting of the driving session number followed immediately by the device identifier (e.g., 1bio.xlsx for Biosignals Studio output of the first driving session, 1oura.xlsx for its Oura data, 1watch.xlsx for the smartwatch, and 1xmart.xlsx for the Xmart ring). These files were cleaned to retain only two columns: “time”, containing the digital timestamps, and “HR” for the heart rate values.
A custom-designed MATLAB script used these five files as inputs, using the smartwatch’s timestamps as the master reference. The synchronization process relied on the nearest neighbor principle. For the wearable sensors, the script mapped each obtained HR value to the nearest available timestamp from the smartwatch within one second. For the high-resolution ECG data, the alignment was strictly index-based, with 1-millisecond precision, ensuring that each smartwatch timestamp corresponded to the exact synchronized moment in the 1000 Hz biosignal stream. Any gaps in the recording or data points falling outside the overlapping session time were automatically treated as NaN to prevent misalignment. The final output was exported as a unified csv file for further analysis.
A successful attempt was made to bypass the standard 300 s reporting interval of the Xmart ring and reduce it to 1 or 5 s. To achieve this, we extracted the Bluetooth HCI snoop logs from the Android device using the Android Debug Bridge (ADB) utility. These raw log files were then processed with a second custom-built MATLAB script designed to parse the Bluetooth packets and extract the real-time HR data contained within the protocol. Although this method proved successful and provided a much higher data granularity, the authors decided not to implement it in the final study. The process requires a significantly more complex setup and manual data extraction, which would compromise the efficiency and scalability of the overall experimental protocol.
As a final result, the integration of multi-modal data streams—ranging from high-frequency ECG and respiration signals to synchronized video feeds and GPS telemetry—provided a unified temporal record of the driver’s physiological state in the real-world context, as shown in Figure 5.

4. Conclusions

In summary, the proposed experimental setup and the methodology serve to evaluate the potential use of affordable and widely available commercial wearable devices for detecting medical emergencies during real driving. By using this setup configuration, it is possible to compare the accuracy of the determination of the HR parameter of a commercial smartwatch and two types of smart rings with the accuracy of research-grade medical sensors in a real driving environment. This comparison may reveal the potential of such wearable devices for detecting early signs of sudden illnesses or trends indicating the emergence of acute medical conditions. Furthermore, the development of this specialized experimental setup will allow for the creation of a database of vital physiological parameters (HR, RR) obtained during real-world driving under different traffic conditions from various vehicle drivers. Based on this database, algorithms for classifying the physiological state of drivers will be developed and validated.

Author Contributions

Conceptualization, G.P. and H.R.; methodology, G.P. and H.R.; software, H.R.; validation, H.R.; resources, H.R. and G.P.; writing—original draft preparation, H.R.; writing—review and editing, G.P.; visualization, H.R.; supervision, G.P. All authors have read and agreed to the published version of the manuscript.

Funding

This research was funded by the European Regional Development Fund within the OP “Research, Innovation and Digitalization Programme for Intelligent Transformation 2021–2027”, Project No. BG16RFPR002-1.014-0005 Center of Competence “Smart Mechatronics, Eco- and Energy-Saving Systems and Technologies”.

Institutional Review Board Statement

This study was conducted in accordance with the Declaration of Helsinki and approved by the Ethics Committee for Research Involving Human Participants of the Technical University of Sofia (Protocol No. 4/20 October 2025).

Informed Consent Statement

Informed consent was obtained from all subjects involved in this study.

Data Availability Statement

The data presented in this study are available on request from the corresponding author.

Conflicts of Interest

The authors declare no conflicts of interest.

Abbreviations

The following abbreviations are used in this manuscript:
HRHeart Rate
RRRespiration Rate
ECGElectrocardiogram
EDRECG-Derived Respiration
NaNNot a Number
ADBAndroid Debug Bridge

References

  1. Visconti, P.; Rausa, G.; Del-Valle-Soto, C.; Velázquez, R.; Cafagna, D.; De Fazio, R. Innovative driver monitoring systems and on-board-vehicle devices in a smart-road scenario based on the internet of vehicle paradigm: A literature and commercial solutions overview. Sensors 2025, 25, 562. [Google Scholar] [CrossRef] [PubMed]
  2. Kundinger, T.; Sofra, N.; Riener, A. Assessment of the potential of wrist-worn wearable sensors for driver drowsiness detection. Sensors 2020, 20, 1029. [Google Scholar] [CrossRef] [PubMed]
  3. Dalmeida, K.M.; Masala, G.L. HRV features as viable physiological markers for stress detection using wearable devices. Sensors 2021, 21, 2873. [Google Scholar] [CrossRef] [PubMed]
  4. Melders, L.; Smigins, R.; Birkavs, A. Recent advances in vehicle driver health monitoring systems. Sensors 2025, 25, 1812. [Google Scholar] [CrossRef] [PubMed]
  5. Andersen, L.W.; Kim, W.Y.; Chase, M.; Berg, K.M.; Mortensen, S.J.; Moskowitz, A.; Novack, V.; Cocchi, M.N.; Donnino, M.W. American Heart Association’s Get With the Guidelines(®)–Resuscitation Investigators. The prevalence and significance of abnormal vital signs prior to in-hospital cardiac arrest. Resuscitation 2016, 98, 112–117. [Google Scholar] [CrossRef] [PubMed]
  6. Radev, H.; Petrova, G.; Spasov, G. Driver physiological parameters monitoring–initial study in real-road driving. In Proceedings of the 33rd International Scientific Conference Electronics, ET2024, Sozopol, Bulgaria, 17–19 September 2024; ISBN 979-835037644-9. [Google Scholar] [CrossRef]
  7. Liang, T.; Yilmaz, G.; Soon, C.-S. Deriving Accurate Nocturnal Heart Rate, rMSSD and Frequency HRV from the Oura Ring. Sensors 2024, 24, 7475. [Google Scholar] [CrossRef] [PubMed]
  8. Phipps, J.; Passage, B.; Sel, K.; Martinez, J.; Saadat, M.; Koker, T.; Damaso, N.; Davis, S.; Palmer, J.; Claypool, K.; et al. Early adverse physiological event detection using commercial wearables: Challenges and opportunities. npj Digit. Med. 2024, 7, 136. [Google Scholar] [CrossRef] [PubMed]
Figure 1. Illustration of CardioBAN and respiBAN positions on the driver’s body.
Engproc 150 00034 g001
Figure 2. Wearables’ positions on a hand.
Engproc 150 00034 g002
Figure 3. Visualization of data collected from the five physiological sensors during a driving session: (a) Biosignals Studio software; (b) Huawei Health app; (c) Oura app; and (d) JCRing Pro app.
Engproc 150 00034 g003
Figure 4. Illustration of the process of data integration into a single spreadsheet and time synchronization.
Engproc 150 00034 g004
Figure 5. Driving session integrated video stream.
Engproc 150 00034 g005
Table 1. Data retrieved from the devices used.
DeviceSampling Rate/
Sampling Interval
Software/
Application
Data FormatFile Size for 1 h Session
CardioBAN1000 Hz/1 msBiosignals Studio v1.0.3.h580 MB
respiBAN400 Hz/2.5 ms
Watch D2-/5 s (activity mode)Huawei Health v16.1.2.310.tcx175 KB
Oura ring-/5 s (activity mode)Oura v7.19.2.csv30 KB
Xmart ring-/300 s (normal mode)JCRing Pro v1.5.9.json20 KB
Disclaimer/Publisher’s Note: The statements, opinions and data contained in all publications are solely those of the individual author(s) and contributor(s) and not of MDPI and/or the editor(s). MDPI and/or the editor(s) disclaim responsibility for any injury to people or property resulting from any ideas, methods, instructions or products referred to in the content.