1. Introduction
The use of airspace over cities has emerged as a promising alternative, leading to the development of the concept of Urban Air Mobility (UAM). A key element of this concept is an aircraft capable of vertical take-off and landing while operating within the limited spatial constraints of the urban environment [
1,
2].
Convertible electric vertical take-off and landing aircraft (eVTOL), implemented according to the wing–propeller aerodynamic scheme, are used in both manned and unmanned autonomous aircraft. The specific mission profiles of these aircraft provide advantages for the transport of passengers and cargo, with the main development objectives being high energy efficiency, low operating costs, and the ability to operate in densely built-up areas [
3].
From an aerodynamic point of view, aircraft of this type combine two lifting systems: a wing, which generates lift in horizontal flight, and a main lifting propeller used during take-off, landing, and hovering. The typical mission profile includes vertical take-off and landing, often accompanied by short periods of hovering at low altitude, which makes the use of electric and hybrid power plants particularly suitable.
The main aerodynamic schemes of the wing–propeller type employ tilting aerodynamic elements, namely a wing (tiltwing) or a rotor (tiltrotor). A conventional aircraft achieves a high lift-to-drag ratio in horizontal flight, but depends on airport infrastructure, whereas a helicopter provides vertical flight capability and operational flexibility, although with lower energy efficiency in cruise. Aircraft with wing–propeller lifting systems represent a compromise solution, intended to combine the advantages of both types [
4].
Historically, research on these configurations has been focused mainly on transport applications. However, the knowledge accumulated in this field provides a valuable basis for the analysis and design of modern VTOL aircraft. The development of unmanned aerial systems (UAS), together with advances in electric and hybrid propulsion systems, has significantly improved the prospects for the practical implementation of wing–propeller configurations with reduced emissions and lower noise levels [
5].
Within the broader context of UAM and Advanced Air Mobility (AAM), there is a clear trend toward the use of convertible wing–propeller configurations because they combine vertical flight capability (take-off, landing, and hovering) with efficient horizontal flight in terms of range and speed. In particular, configurations with a tilting rotor or a tilting wing are of major interest. A representative modern example is the Joby Aviation aircraft, in which the propeller axes rotate between vertical and horizontal orientations. Another clear trend in convertible aircraft intended for UAM is the use of multi-propeller configurations [
6].
In parallel with manned UAM aircraft, unmanned aerial systems (UASs) intended for cargo delivery have become an important accelerator for the implementation of eVTOL concepts in urban environments [
7]. In these systems, wing–propeller lifting configurations are widely used because they allow vertical take-off from limited sites and more energy-efficient horizontal flight compared with purely multicopter solutions. One example is the Dufour Aerospace Aero-200 [
8]. Such platforms are particularly suitable for mission profiles involving a clear trade-off between the duration of the hovering phase and the total mission time, which directly corresponds to the subject of the present dissertation.
This study aims to provide initial experimental data for comparing the relationship between the main geometric parameters of wing–propeller lifting systems, such as the area of the tilting wing section and the propeller diameter, relative to the gross wing area, and the corresponding flight energy consumption for different hover-duration times. The study also aims to validate, through experiment, the simulation results [
9], identifying the most energy-efficient area ratio, taking into account that propeller thrust and torque vary significantly during different stages of flight.
During hovering, the propeller generates the entire lifting force in the absence of forward airspeed, whereas in cruising flight, the wing generates the lift, and the propeller requires less thrust. However, in a cruise, the propeller must produce airflow at a higher velocity to match the flight speed [
10].
As a basis for the present study, a classification analysis [
7] was carried out in order to identify the most suitable aerodynamic configuration of a tiltwing and tilt-propeller lifting system. In addition, an airfoil profile suitable for future experimental investigations was selected. In the present work, a fixed-pitch two-blade propeller was used.
2. Methodology
The experimental investigation, like the numerical simulations, was based on a hypothetical eVTOL aircraft employing the selected tiltwing–propeller lifting system. The experiments were conducted in the wind tunnel of the Autonomous Aircraft Aerodynamics Laboratory at the Plovdiv Branch of the Technical University of Sofia.
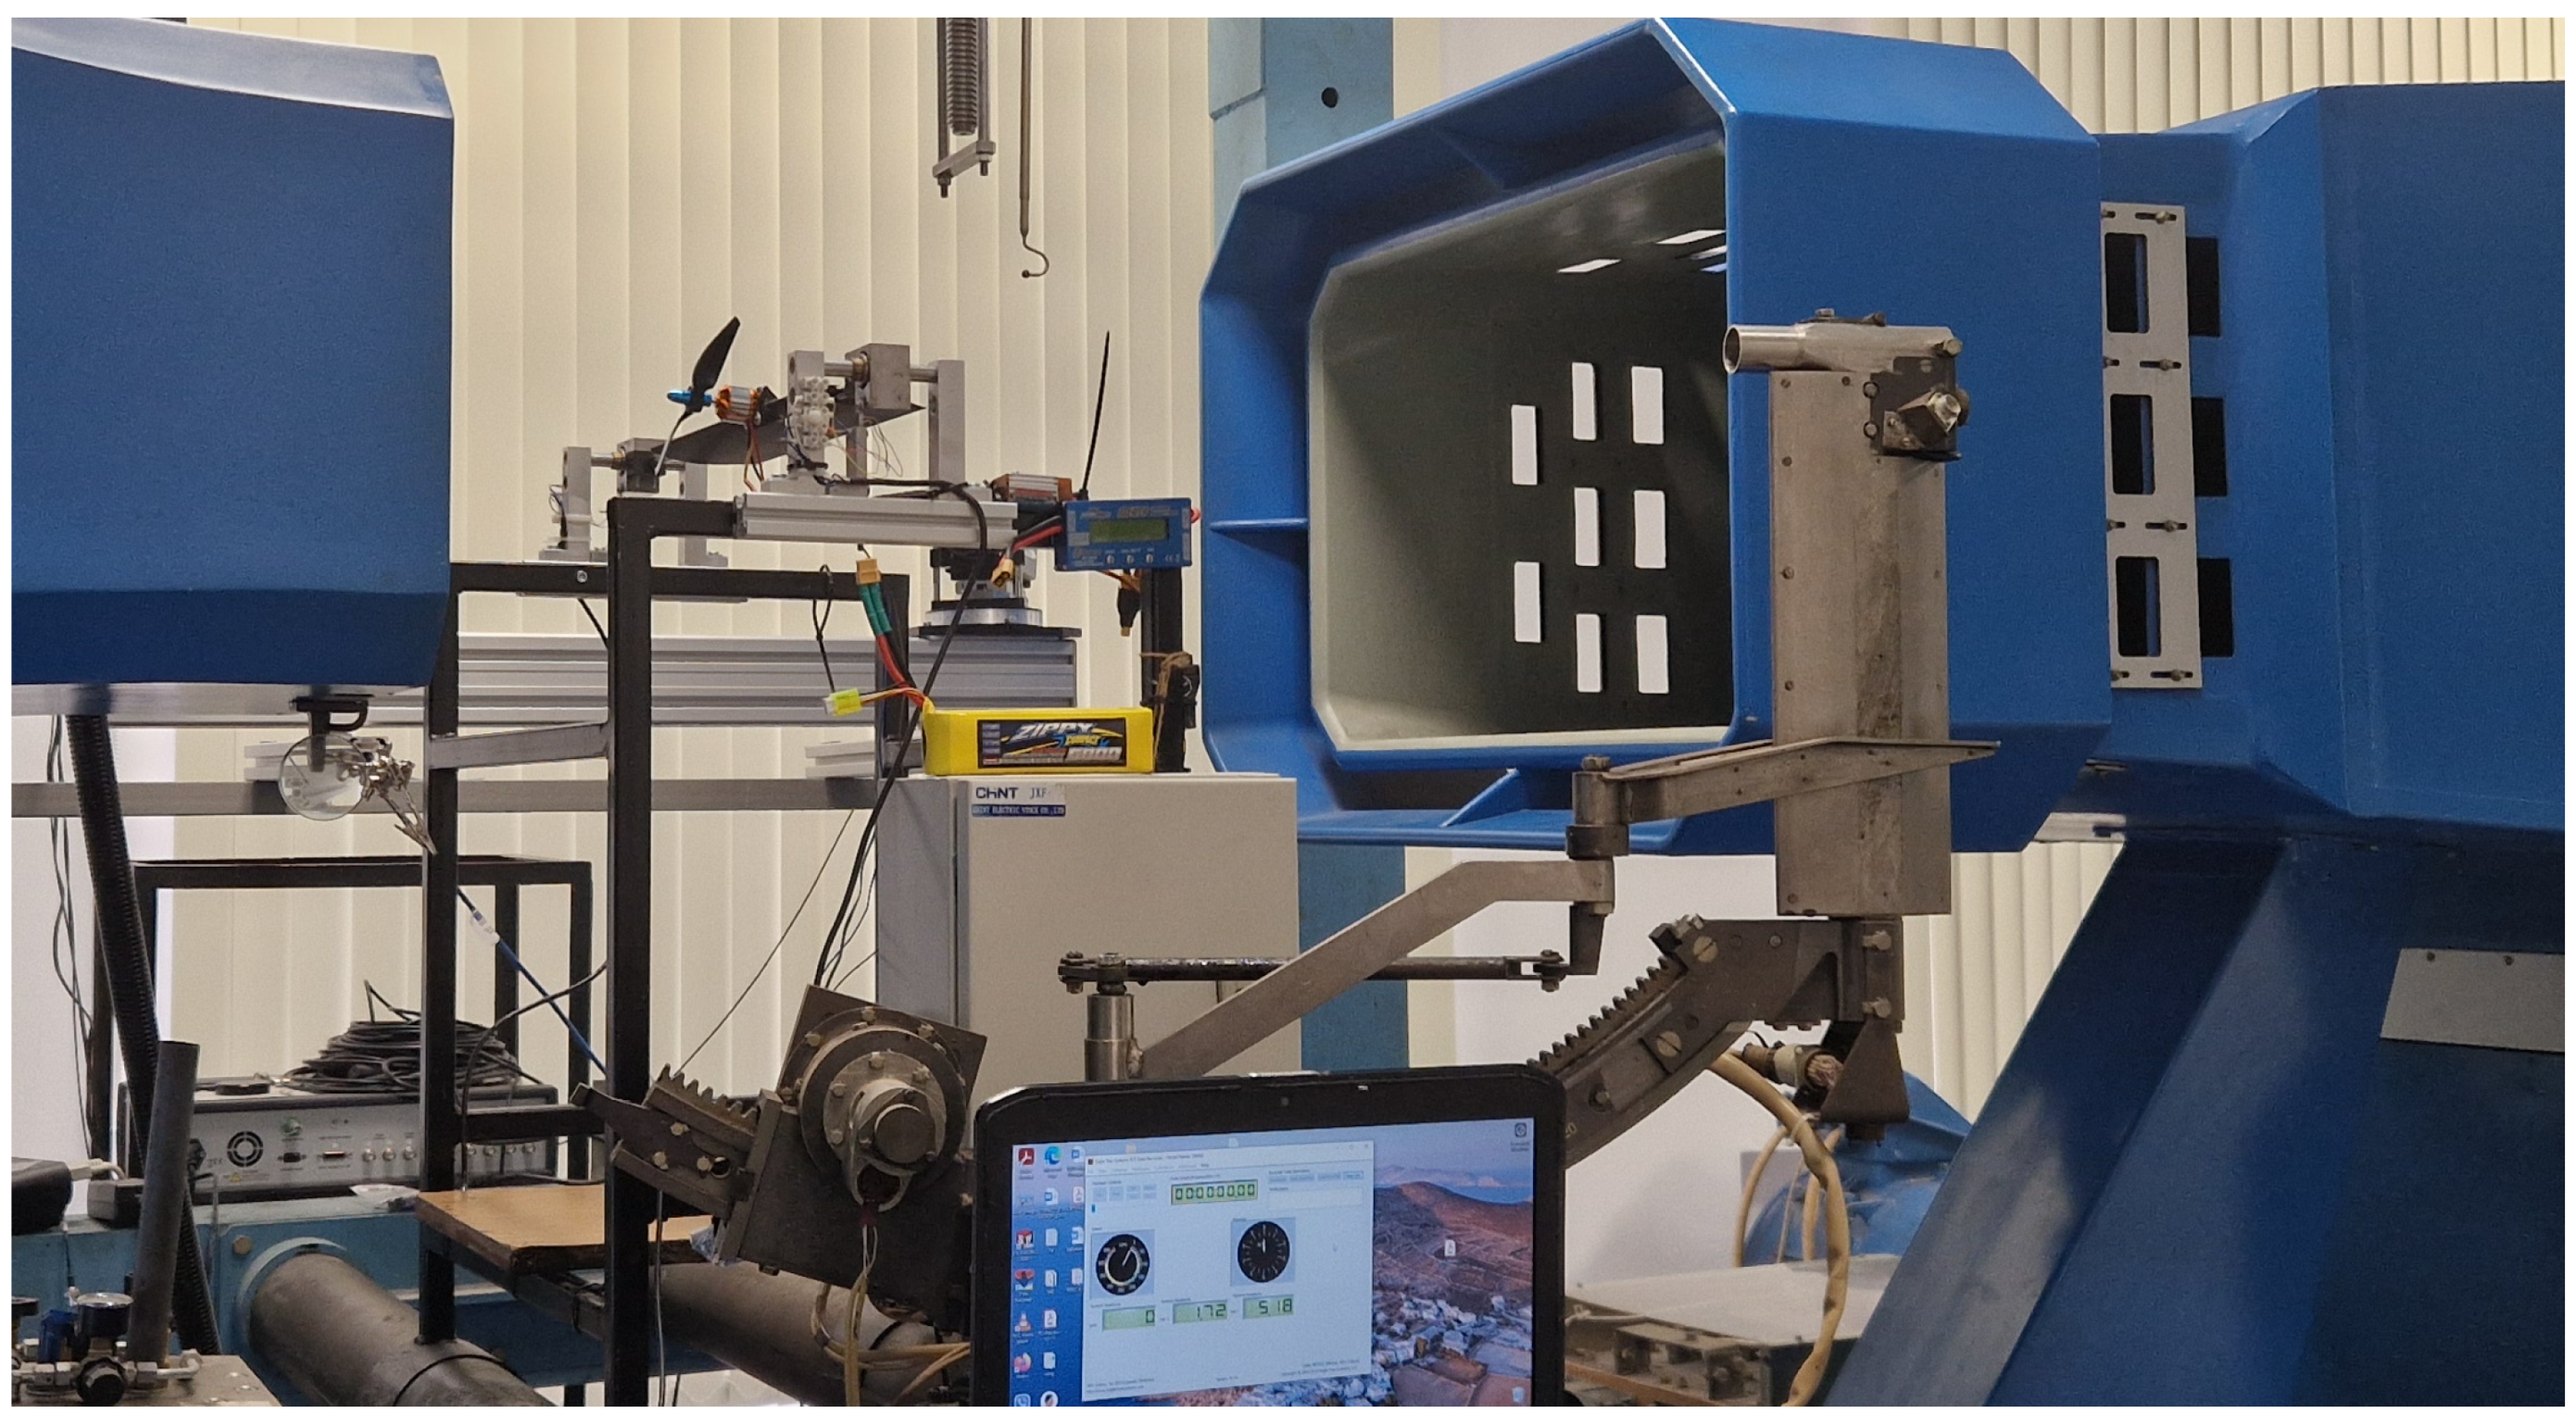
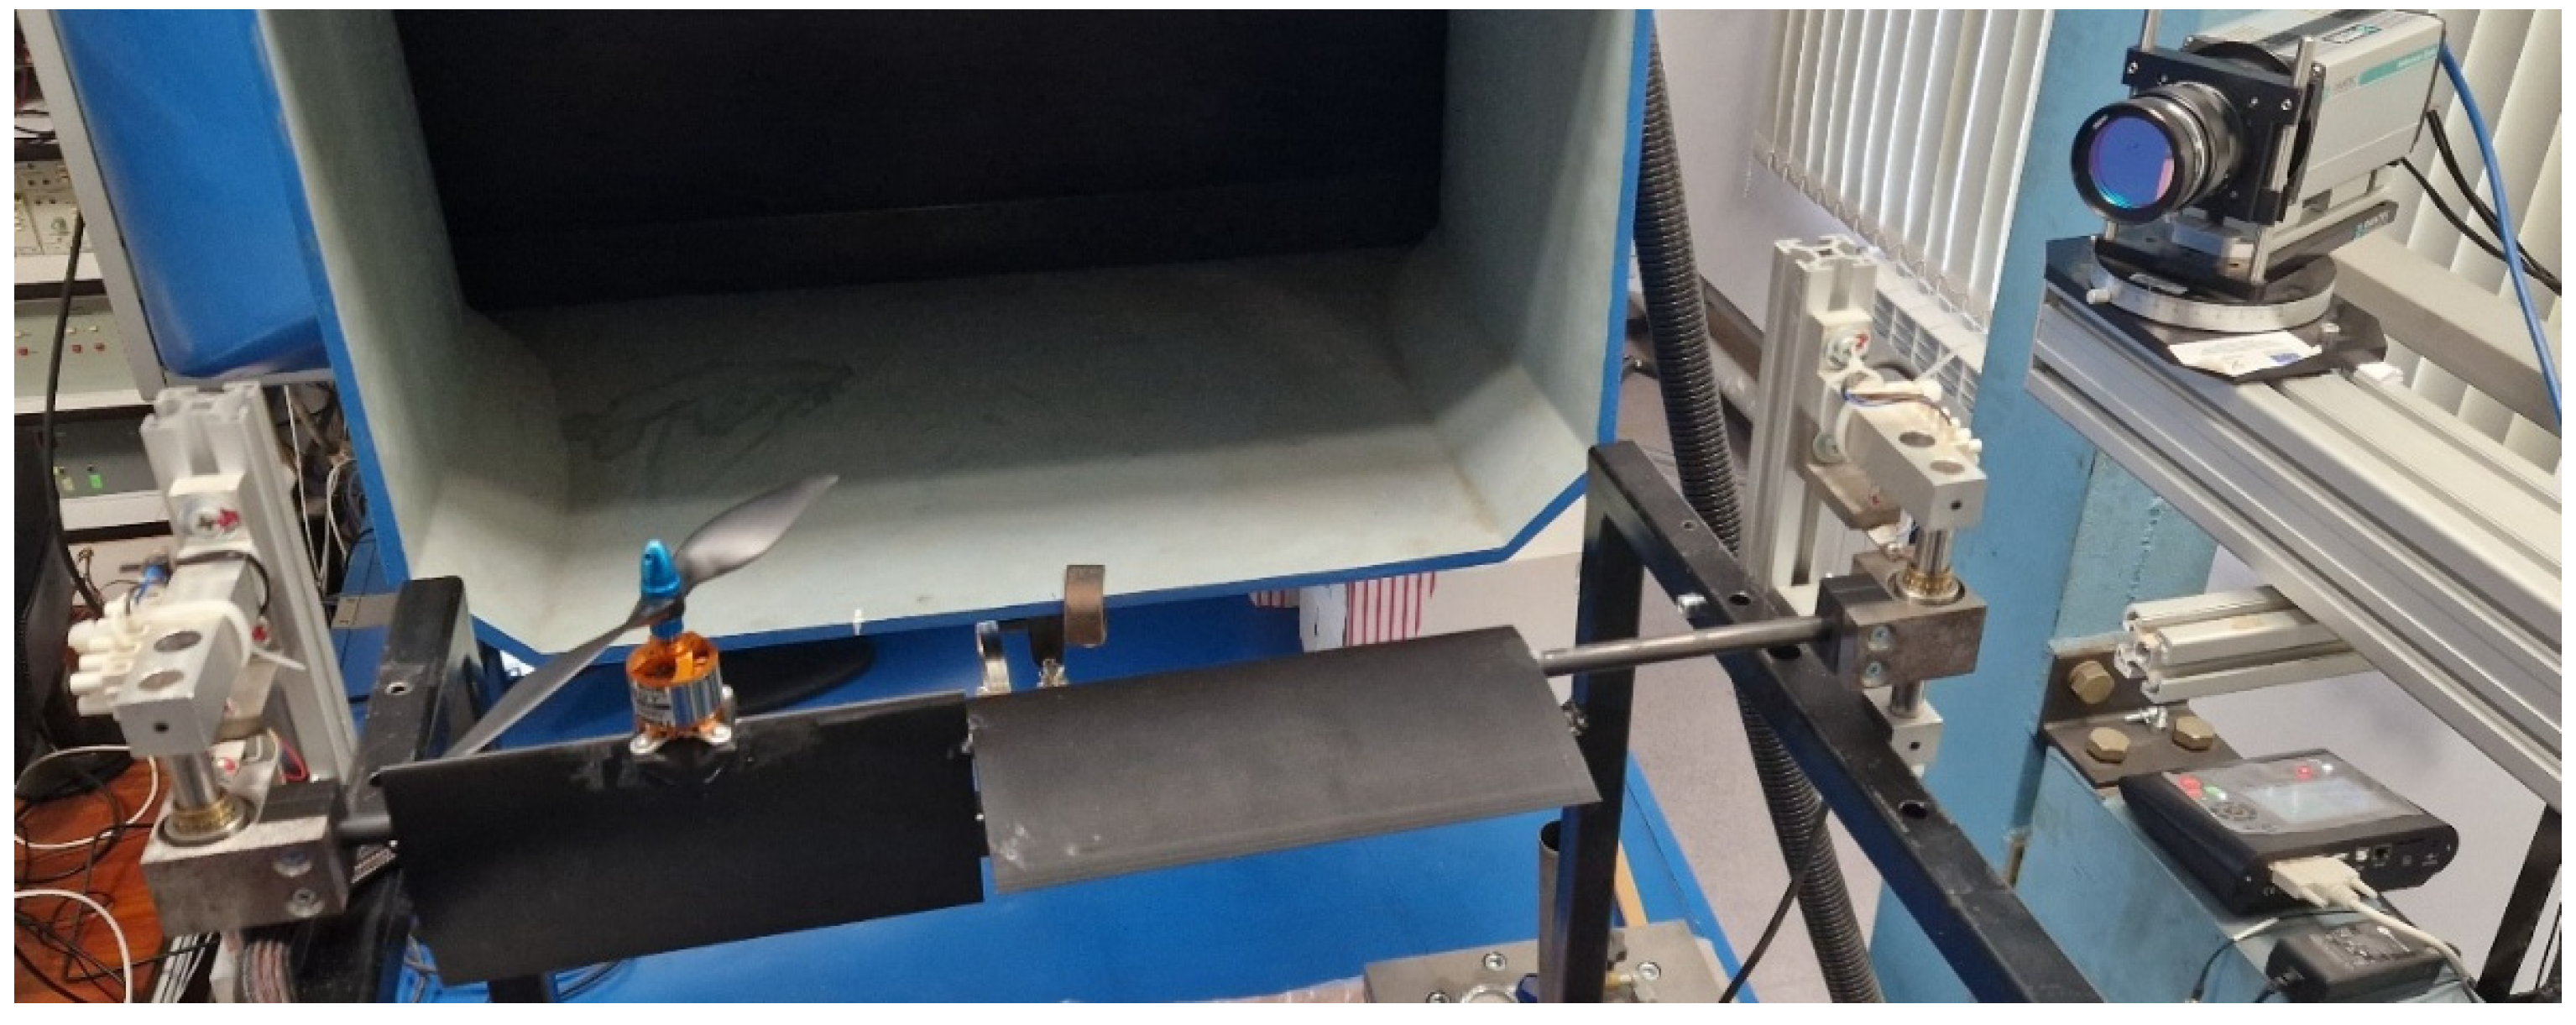
The model was mounted in the wind tunnel test section on a propeller thrust and power measurement test stand. The test stand consisted of a frame with two mounting supports, instrumented with strain-gauge sensors and a signal converter. The strain-gauge sensors were single-axis sensors, and by rotating them, aerodynamic forces generated by the wing–propeller system could be measured in two directions. An eLogger V4 (Eagle Tree Systems, Bellevue, WA, USA) was used to measure the electrical power required for the energy calculations (
Figure 1).
The airspeed in hovering conditions and in horizontal flight was measured using the wind tunnel PIV system and a Pitot tube while the propeller rotational speed was measured using a Brushless Motor RPM Sensor (Model: RPM-KIT-BRS; Manufacturer: Eagle Tree Systems, Bellevue, WA, USA).
A 1:5 scale model of a wing–propeller lifting system was used. The wing was manufactured by 3D printing and divided into two sections: a fixed section and a tilting section, the latter incorporating a faired mounting structure for the electric motor. The airfoil selected for the simulations, based on the statistical analysis, was the NACA 642-015 profile [
11]. The wing was mounted on load cells through an internal longitudinal carbon tube, which also served as the rotation axis of the tilting section (
Figure 2).
The wing chord was kept constant along the span, so that the area ratio between the tilting wing section and the propeller disk area remained constant. For the experiments, APC propellers were used, with a constant relative pitch-to-diameter ratio
for all test cases, where
is the propeller pitch and
is the propeller diameter [
12]. The propeller diameters are 6, 7, and 9 inches. The electric motor driving the propeller was mounted on the fairing located at the center of the tilting wing section.
The case study was based on the following fixed parameters: gross wing area
, wingspan
, and wing chord
. The variable geometric parameter was the propeller-to-wing gross area ratio
, where
is the wing chord length in meters and
is the gross wing area in square meters.
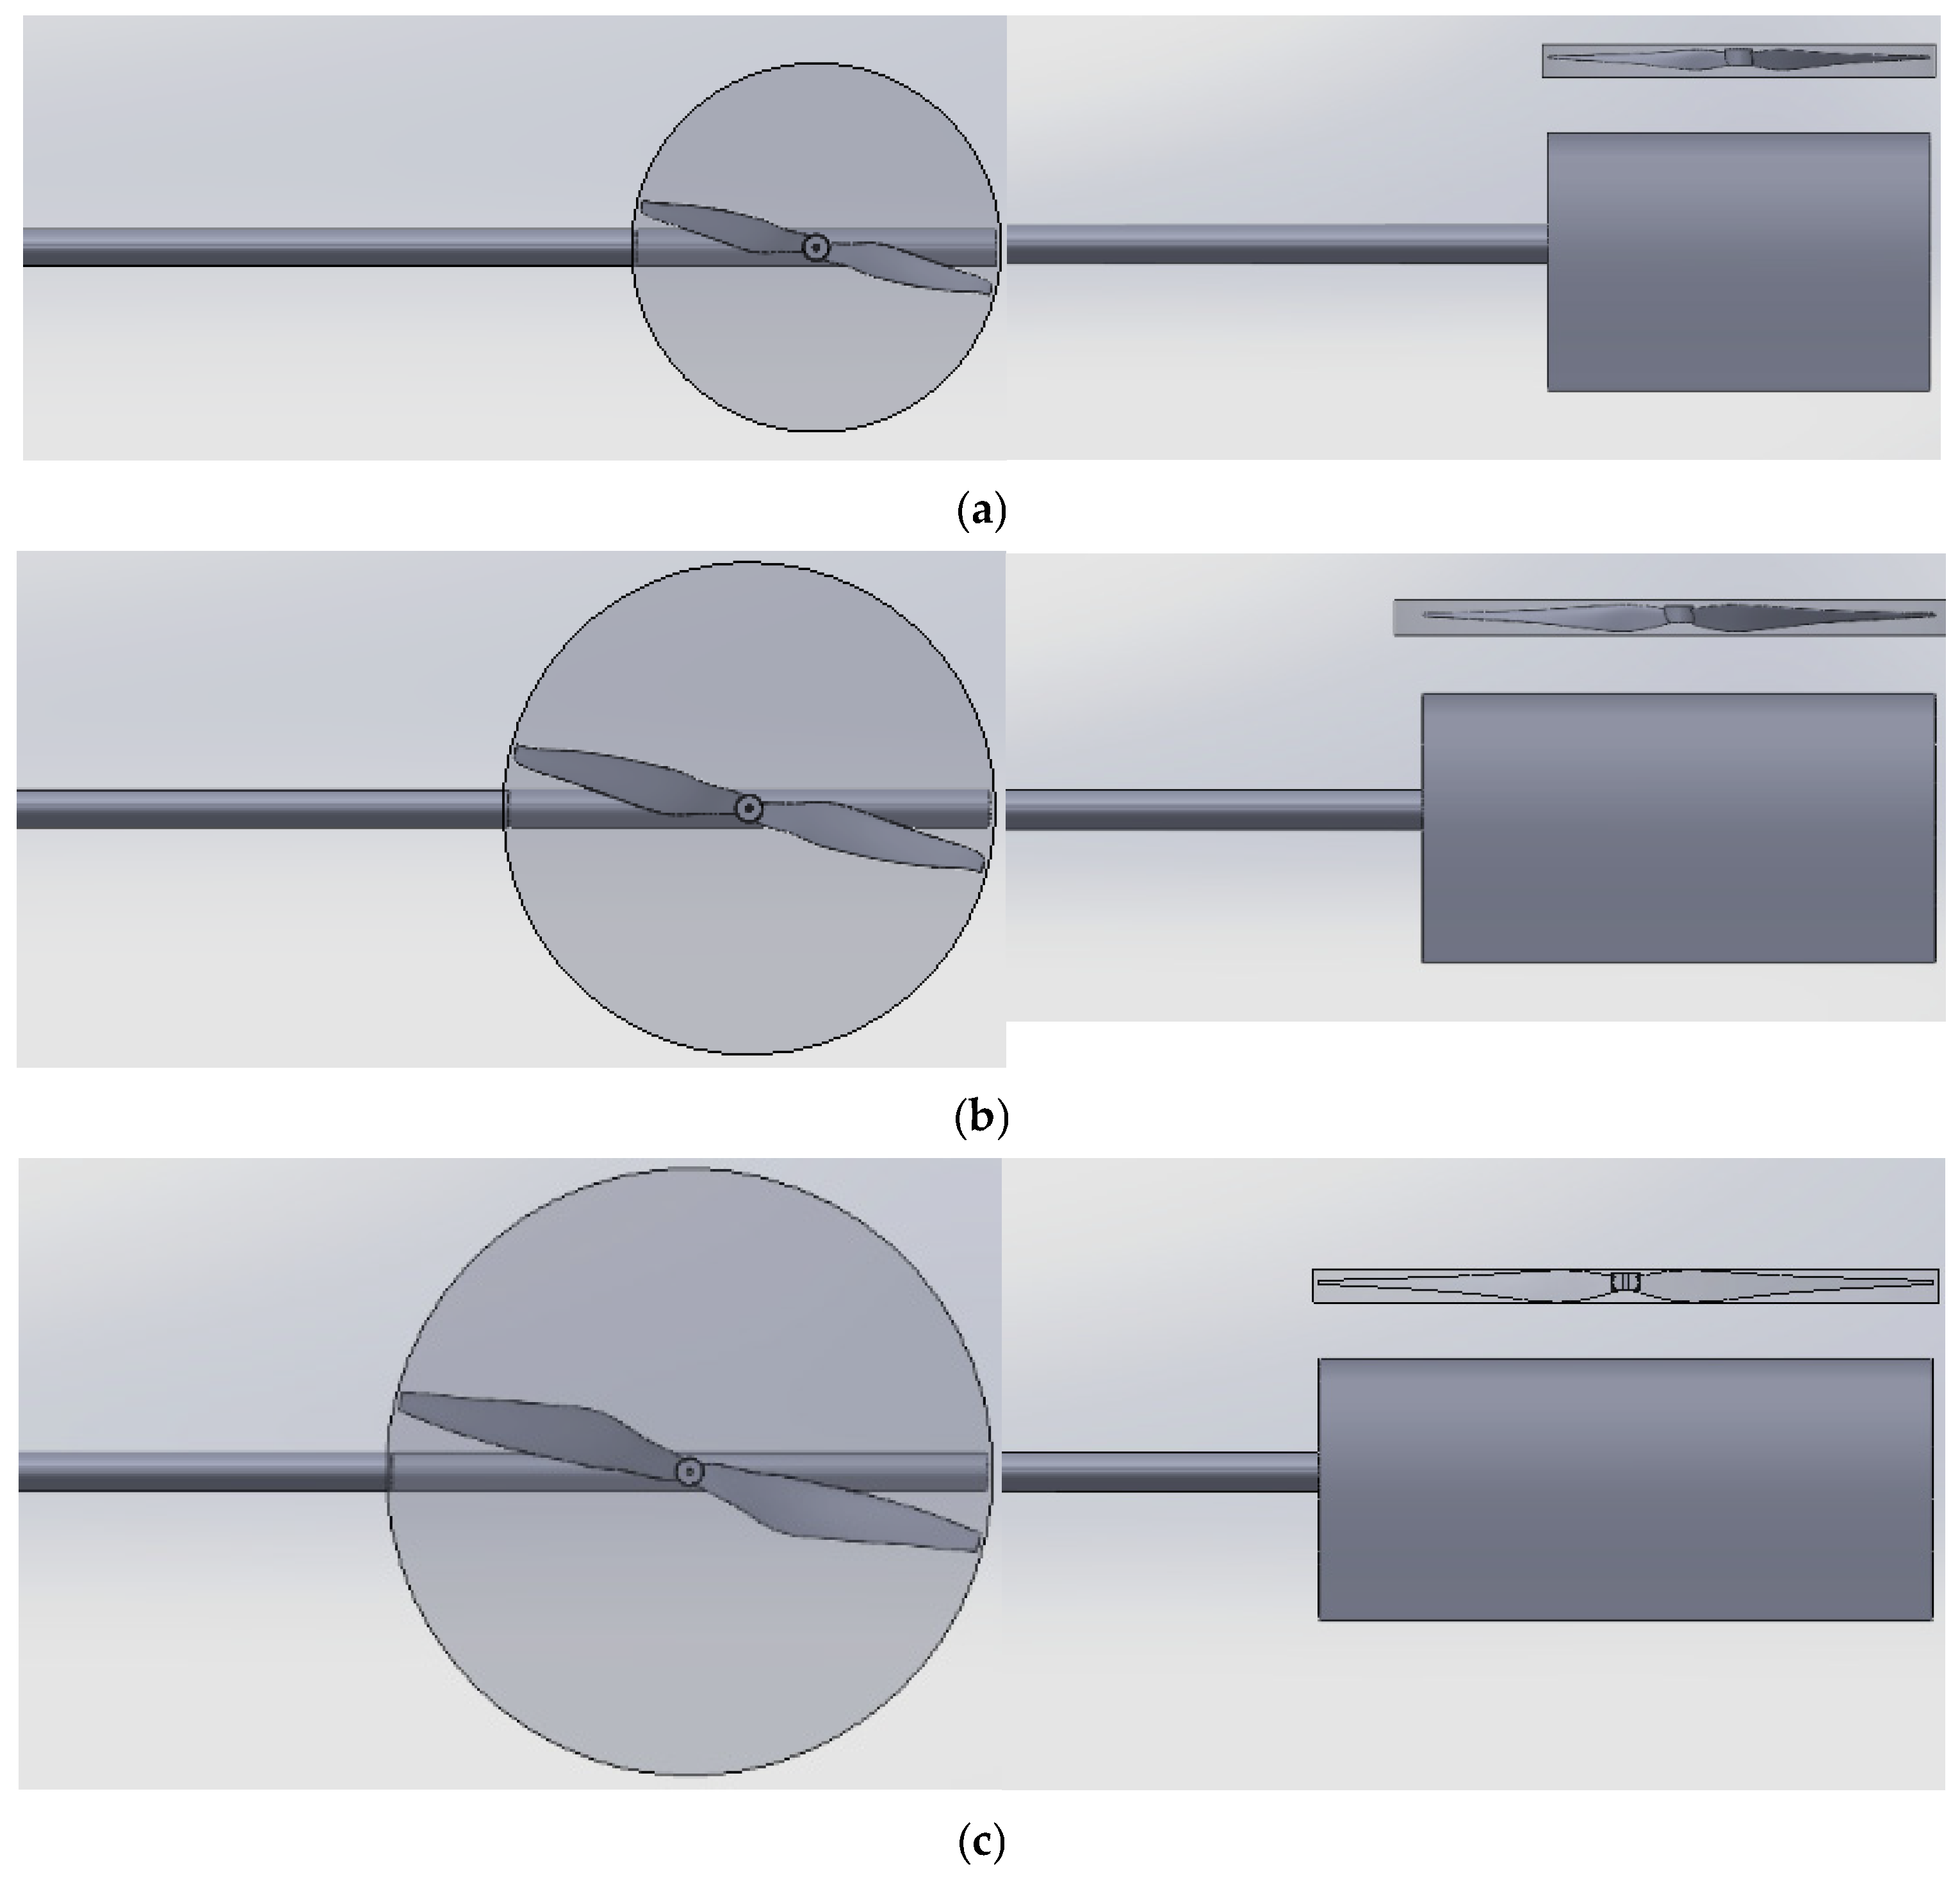
Figure 3 shows the configurations in cruising and hovering flight for the three investigated ratios, corresponding to both the span of the tilting wing section and the propeller diameter: 0.14 m, 0.18 m, and 0.22 m, or
, 0.47, and 0.58.
In the horizontal flight configuration, four free-stream velocities () were used for all propeller diameters: 10, 15, 20, and 25 m/s. A total of eight measurements were carried out for each of the three propeller diameters and corresponding tilting wing section spans, in two different flight configurations of the wing–propeller lifting system.
The values of the aerodynamic force components, such as propeller thrust and wing lift and drag, were obtained from the experimental test stand. For comparison, the total energy derived from both the simulation and experimental results was evaluated using the propeller power in (W) and thrust in (N) in both configurations. This is made possible by the measurement system of the wing–propeller thrust and power test stand, together with the PIV system, which also provides information on propeller rotational speed and flow velocity in the test section.
For the propeller tractor configuration, these measured parameters were used to calculate the actual power coefficient
, (Equation (3)), thrust coefficient
, (Equation (2)), and advance ratio
, (Equation (1)), which were then employed in the evaluation of the figure of merit. The advance ratio of the propeller depends on the free-stream velocity and the rotational speed per second (
) [
13].
In the hover configuration, the propeller-induced speed from PIV and the Pitot tube was used. From the Momentum Theory:
where
Vj is the airspeed in distance
below the rotor in (m/s),
vi is the airspeed induced from the rotor (m/s),
F is the rotor gross area and
ρ is the air density (kg/m
3) relevant to the laboratory condition.
These results, namely the experimentally determined coefficients
and
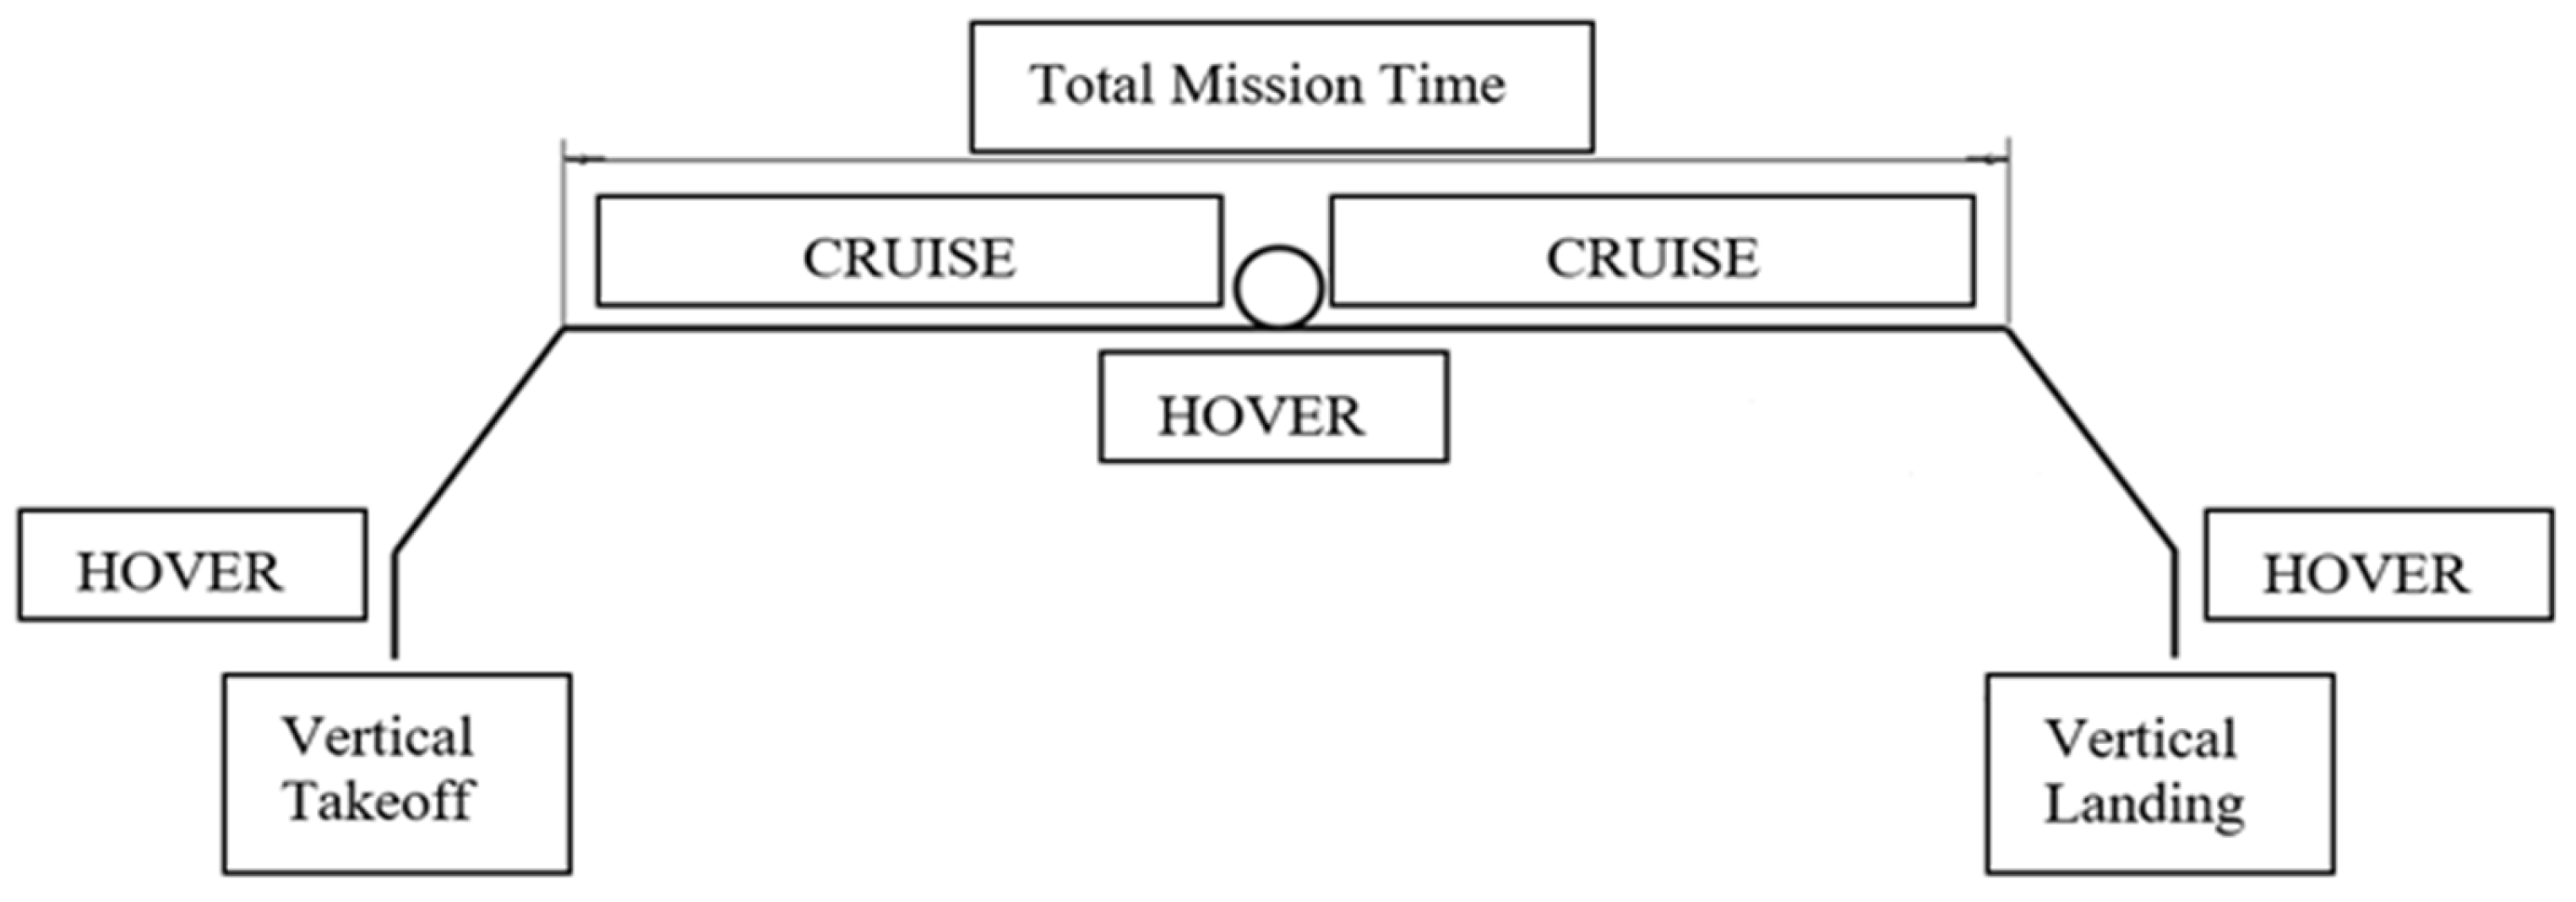
, were obtained from the experimental propellers. These values were then used in the full-scale geometric model to calculate the actual power required for each of the selected cases. The experimentally derived power was subsequently used to calculate the total mission energy, including both hover and cruise, for the three selected cases, with hover durations equal to 15%, 30%, and 45% of the total mission endurance (
Figure 4). All calculated values of mission energy consumption were expressed relative to the equivalent total flight energy required for cruising flight with the same endurance, according to (Equation (7)), i.e., for the corresponding fixed-wing aircraft case [
12,
14,
15].
The energy ratios were used as an optimization figure of merit, Q, which can be calculated using the following equations [
12]:
where
E is calculated from the total energy for hovering flight mission in (J) obtained from the experimental results,
Eref is the calculated total energy for equivalent cruising flight in (J),
PH is the required power for hover in (W),
Pcr is the required power for cruising flight in (W),
tH is the time for hover in
s,
tH is the time for cruising flight in (s),
m0 is the mass in (kg),
g is the acceleration due to Earth’s gravitational field in (m/s
2),
R is the range of flight in
m,
L/
Dcr is the lift-to-drag ratio of aircraft at cruise and
ɳP is the propeller efficiency. The last two coefficients were obtained from classification analysis and were typical of similar conventional-scheme propeller aircraft [
9].
3. Results and Discussion
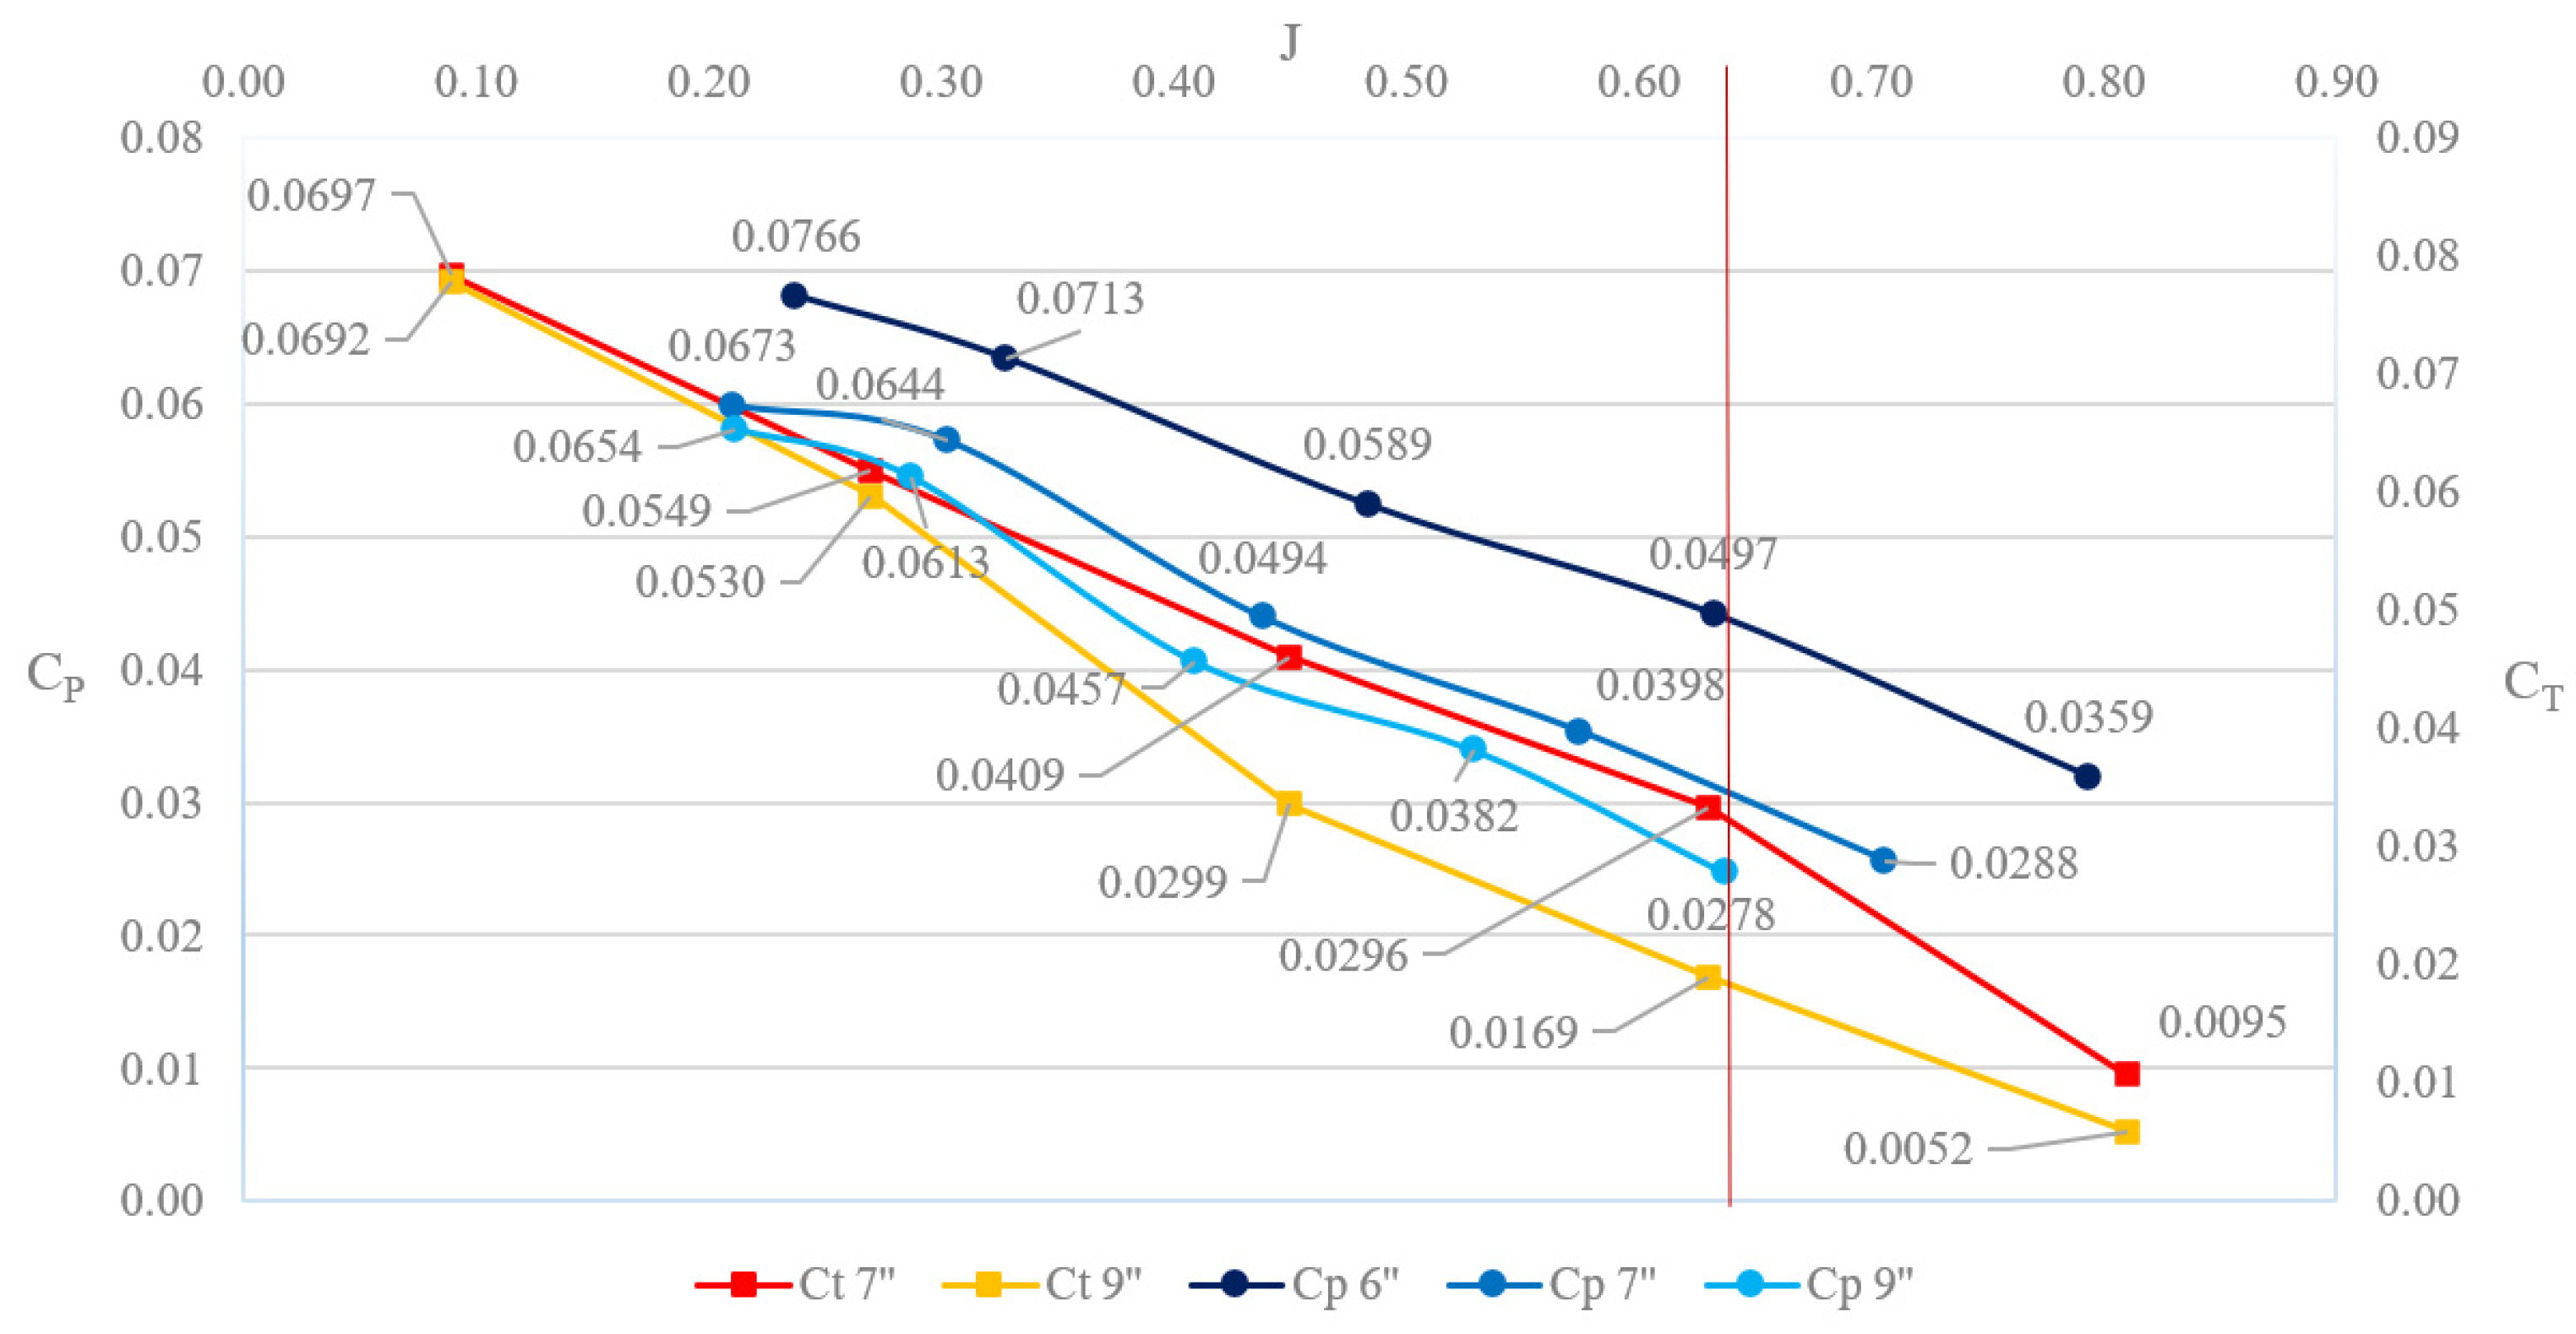
Figure 5 shows the values of
and
as functions of
, where
is defined by Equation (1). The coefficients
and
were calculated from experimental data using Equations (2) and (3) and were subsequently used in Equations (5) and (6) to determine the corresponding
and
in Equation (8), respectively, in hover and cruise.
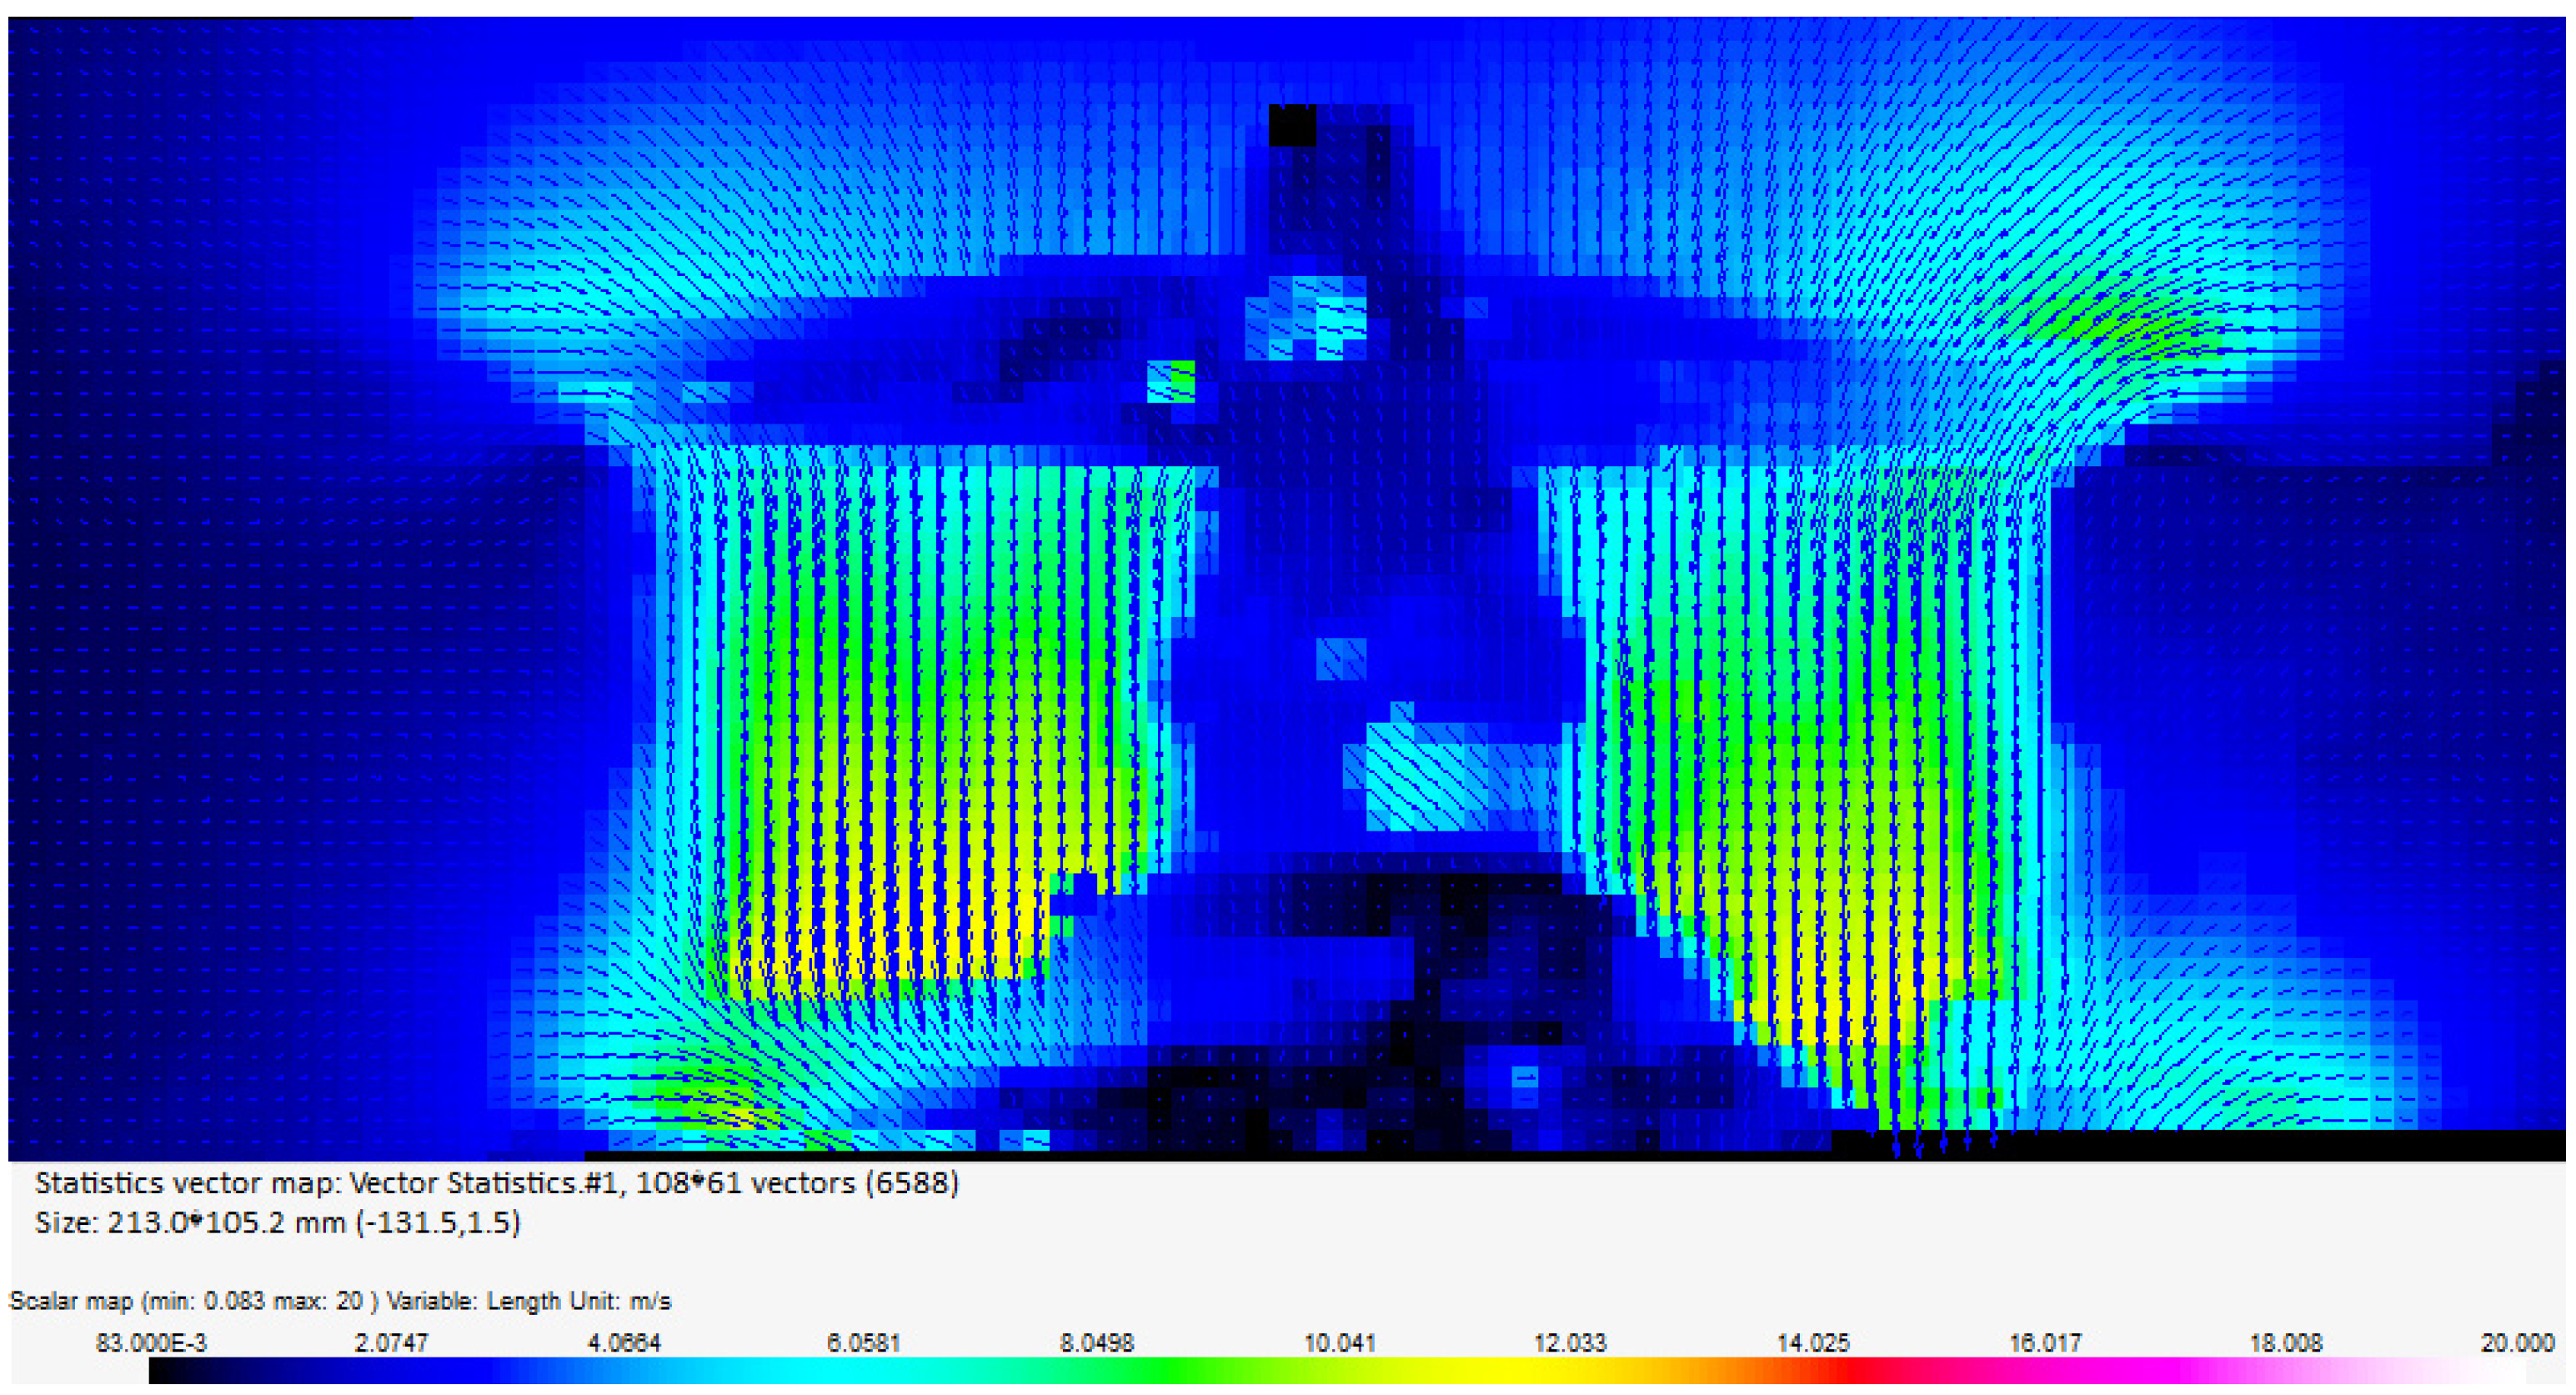
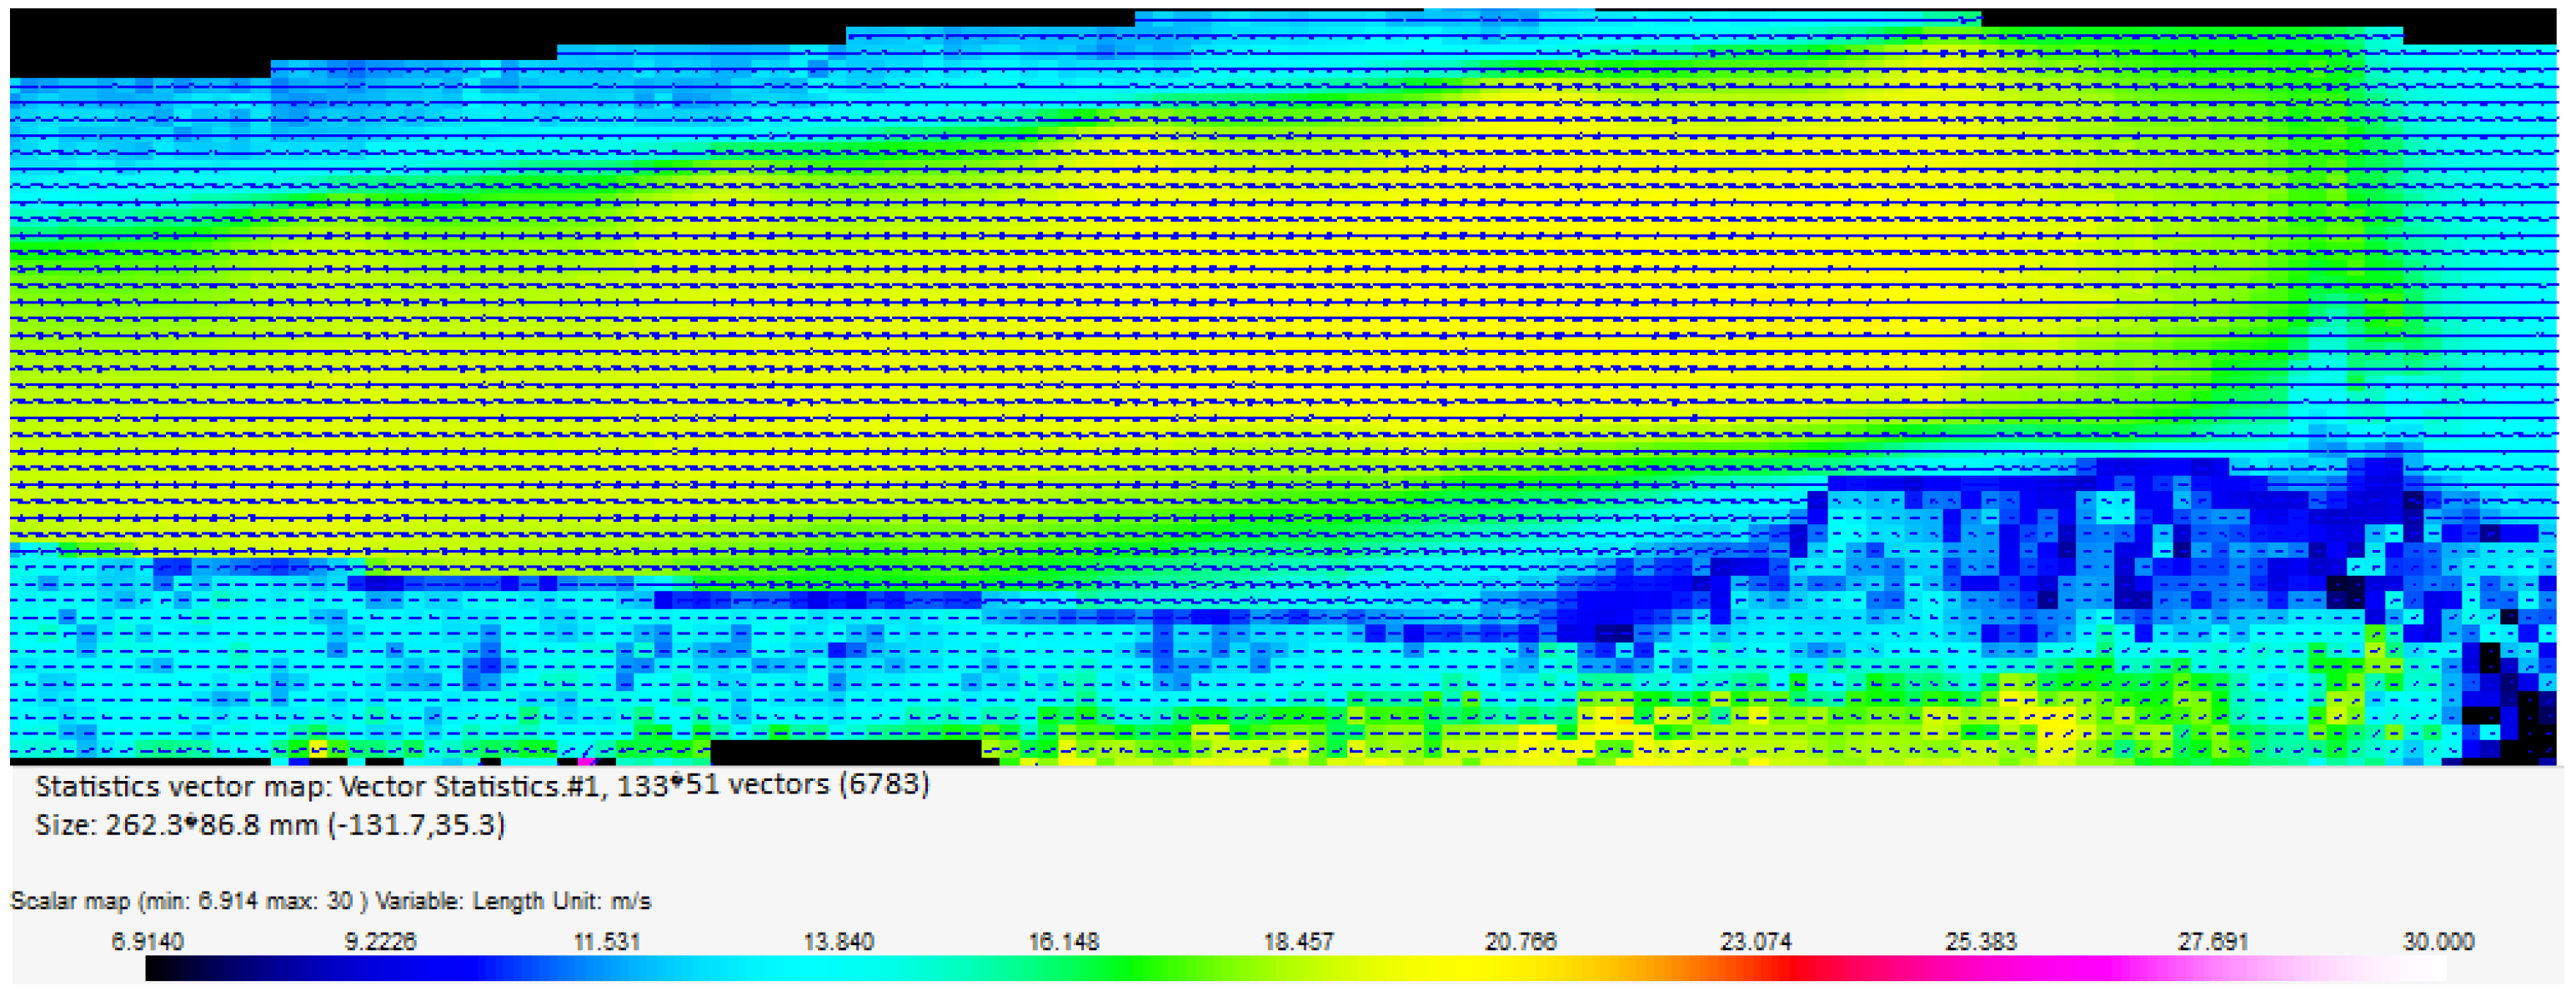
The velocity flow field around the wing–propeller lifting system is shown for both configurations of the experiment in
Figure 6 (cruise) and
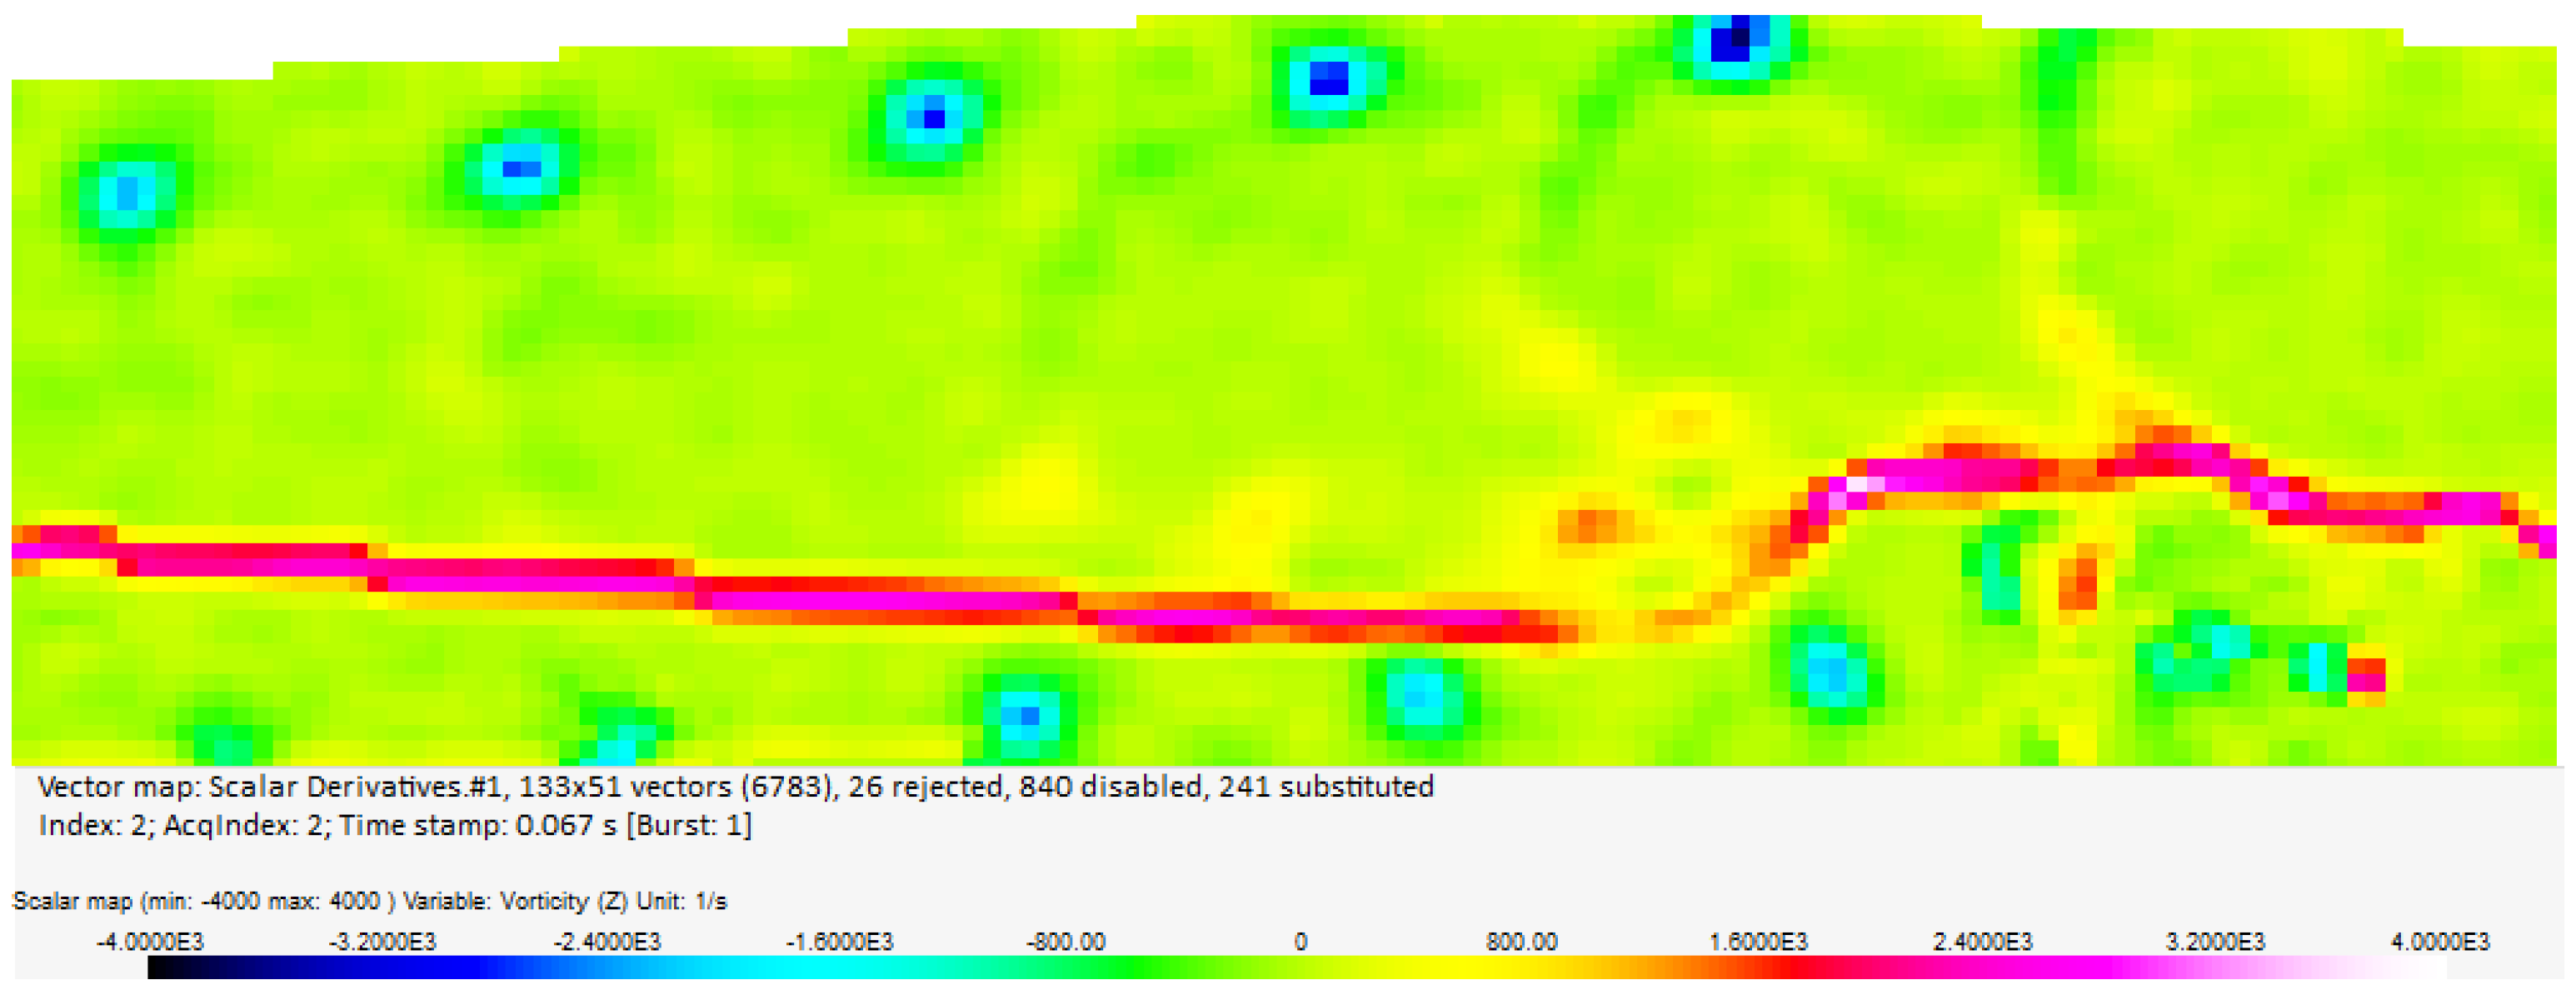
Figure 7 (hover), while the vorticity flow field is depicted in
Figure 8 (cruise). The results from the experiment (
Table 1) show the values of the figure of merit,
Q, the energy ratio (Equation (7)), for a given propeller-to-wing-gross-area ratio and hover-duration percentage of total mission endurance. So, three geometric configurations (
Figure 2) at three hover durations are considered overall. The inductive speed is determined from the PIV flow field and used for the calculation of the advanced ratio J (Equation (1)) in hover modes.
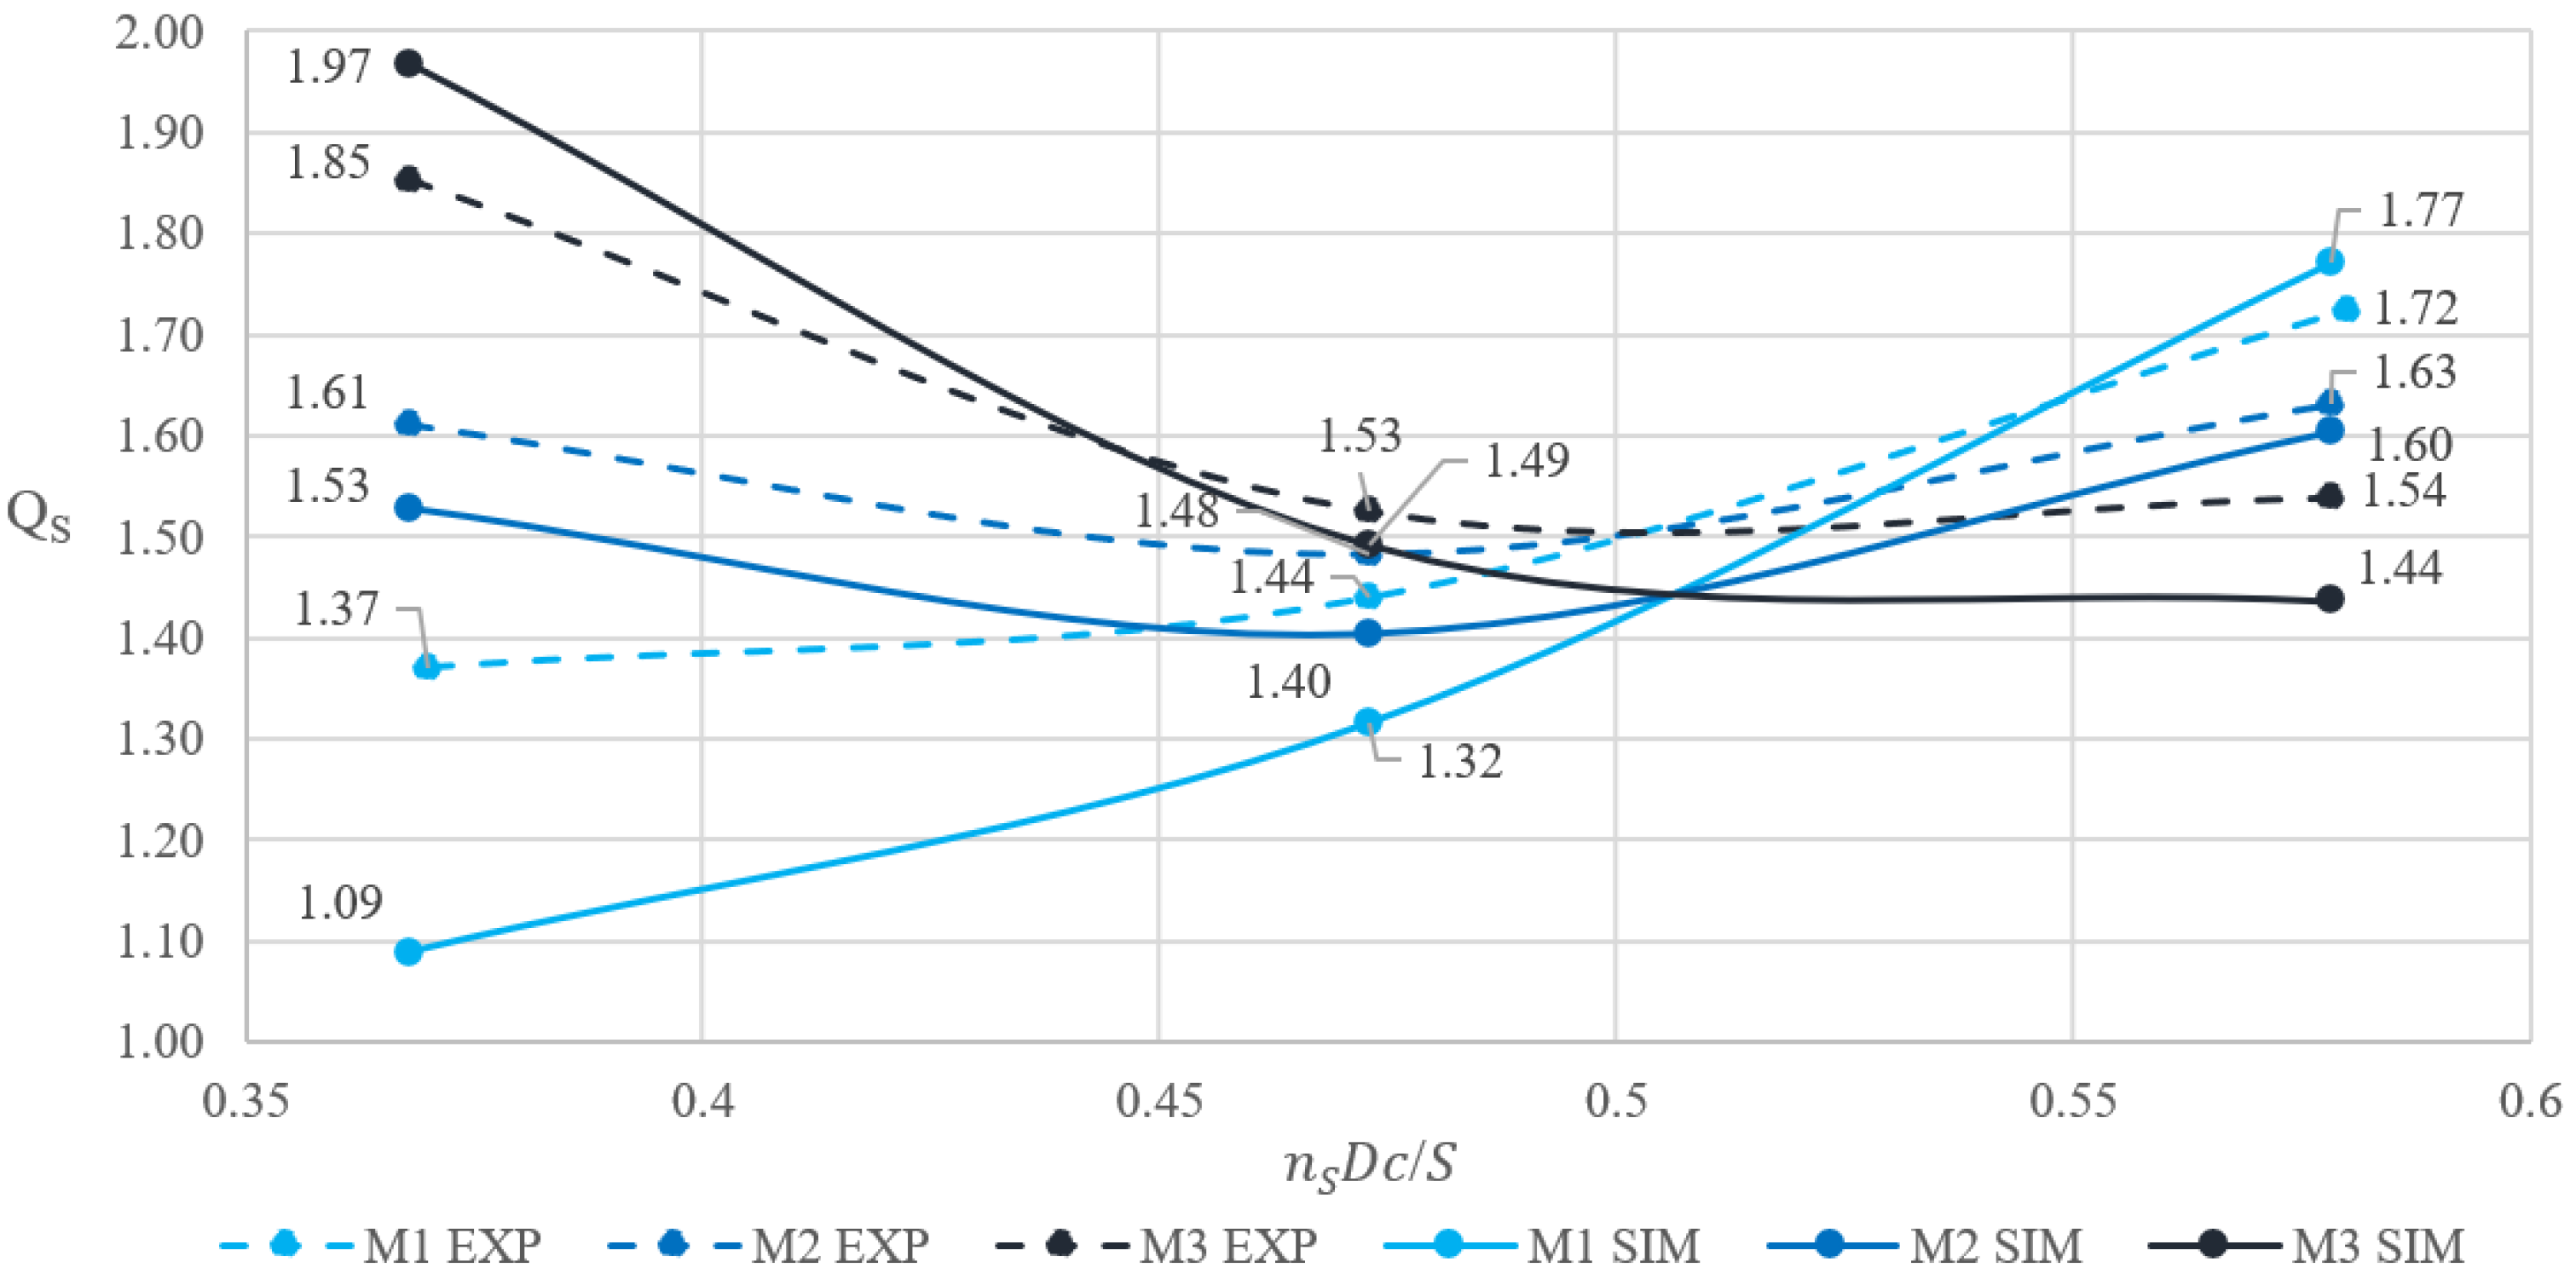
The calculated results from the preliminary simulations [
15] and the above-described experiments, presented in
Figure 9, show the variation in the optimal figure of merit for each mission considered and allow the minimum required mission energy to be identified. A similar trend can be observed in both sets of results. However, the experiments show a small shift in the optimums from simulation results [
9].
For Mission 1, which corresponds to a 15% hover time, the minimum mission energy is obtained at
(
Figure 3a), because most of the mission energy is consumed during cruise rather than hover. In contrast, Mission 3 is most efficient at
(
Figure 3c), since the lower propeller disk loading improves hover efficiency. Mission 2 reaches a minimum total energy at the intermediate value
(
Figure 3b), which represents the most favorable propeller disk loading for that mission profile.
The intersection point of Missions 1 to 3 is shown in
Figure 9 at approximately
, where all considered missions exhibit equivalent efficiency, expressed by equal values of the figure of merit
, in both graphs. In other words, for the given hypothetical eVTOL aircraft, the efficiency becomes nearly invariant with respect to the propeller-to-wing gross area ratio, the corresponding propeller disk loading, and the variation in hover and cruise times. The experimental results confirm that this finding may be used as a relevant design consideration in the preliminary design of eVTOL aircraft.