1. Introduction
Autism spectrum disorder (ASD) is one of the most common neurodevelopmental disorders, which affects 0.6% of the global population and is a rapidly increasing developmental disability [
1]. Due to the presence of difficulties in social communication and interaction, along with restricted and repetitive patterns of behaviour, interests, or activities [
2], individuals diagnosed with ASD often require a substantially higher level of care, support, and educational resources. Additionally, research has shown that diagnosis and intervention in early age improve their life quality and social adaption [
3]; the current detection procedure, which is mainly based on behaviour evaluation, limits the possibility of crucial diagnosis and intervention, as clear behavioural signs often do not appear until after an important developmental period [
4].
In recent years, the development of neuroimaging techniques combined with artificial intelligence (AI) has created opportunities to identify biomarkers to distinguish individuals with ASD from their neurotypical peers, suggesting the potential for detection before typical symptoms appear [
5]. Among the available neuroimaging tools, electroencephalography (EEG) is a widely used for biomarker discovery. In addition to the objective, time-sensitive measures of brain activity by placing sensors on the scalp, it is more affordable and accessible compared to other imaging modalities. By recording tiny electrical signals from neurons, EEG allows researchers to observe brain function in real time and investigate the neural mechanisms underlying atypical development in ASD [
6]. EEG signals are typically analysed across five frequency bands: delta (0.5–4 Hz), theta (4–8 Hz), alpha (8–13 Hz), beta (13–30 Hz), and gamma (>30 Hz). Previous research has identified atypical EEG activity, while other research suggests altered hemispheric asymmetry in individuals with ASD [
7]. However, the extent to which such asymmetry can be reliably quantified and used for classification remains unclear, particularly in small-sample settings.
In this study, we focus on hemispheric asymmetry as a simplified and interpretable feature using the Lateralisation Index (LI), which quantifies the relative difference in activity between the left and right hemispheres. Instead of using complex deep learning models, we explore whether LI-based features combined with classical machine learning methods can provide meaningful signals for ASD classification. In addition, we reported robust evaluation strategies to better understand model performance in small-sample scenarios.
2. Materials and Methods
2.1. Dataset and Data Preprocessing
The dataset comprised EEG recordings from 13 children with high-functioning autism (aged 7–12 years, M = 9.7) and 13 age-matched neurotypical children (M = 9.3) [
8]. EEG signals were recorded for approximately 30 min per participant in a controlled environment designed to minimise visual and auditory distractions. Data were collected using a 19-channel OpenBCI electrocap configured according to the international 10–20 system.
The raw EEG data has been pre-processed, and band powers were extracted in a prior study [
9].
2.2. LI Calculation and Statistical Analysis
To quantify hemispheric asymmetry, the Lateralisation Index (LI) was computed by the following classic formular [
10]:
where L and R represent the average band power of electrodes over the left and right hemispheres, respectively. Mean power was computed across symmetrical electrode pairs (Fp1/Fp2, F3/F4, C3/C4, P3/P4, O1/O2, T3/T4, T5/T6, F7/F8). In accordance with the standard 10–20 system, electrodes with odd indices correspond to the left hemisphere, while even indices correspond to the right hemisphere.
LI values were calculated for each frequency band (delta, theta, alpha, beta, gamma) and averaged for each participant. Positive LI values indicate strong right-hemisphere activity while negative LI values suggest left-hemisphere dominance.
Statistical analyses are conducted to examine both between-group and within-group differences in LI values. Mann–Whitney U tests [
11] are used to compare LI distributions between the autism and neurotypical groups. Within-group hemispheric asymmetry was evaluated using the Wilcoxon signed-rank test [
12].
2.3. Classification Models
For the classification task, mean LI values were used as EEG-derived features to distinguish between the autism and neurotypical group. Specifically, for each participant, the LI values across all symmetrical electrode pairs were averaged within each frequency band (delta, theta, alpha, beta, and gamma), resulting in five features per participant. This averaging approach provided a compact representation of hemispheric asymmetry across frequency bands while reducing noise from channel-level variability.
Four supervised machine learning algorithms were implemented: Logistic Regression (LR), Linear Support Vector Machine (Linear SVM), Radial Basis Function Support Vector Machine (RBF SVM), and Random Forest (RF). Classic machine learning methods were chosen due to their suitability for small sample sizes, reduced risk of overfitting, and greater interpretability compared to more complex models. This interpretability is particularly valuable for identifying meaningful EEG-based biomarkers. All features were standardised prior to model training to ensure consistent scaling.
2.4. Evaluation Strategy
Data were adopted using a group-wise split strategy to prevent data leakage between participants. For the initial classification analysis, data were divided into a single train–test split (80% training, 20% testing). The resulting testing dataset was imbalanced, containing one neurotypical participant and five participants with ASD. To assess robustness and generalisability, we additionally performed a 20 times repeated-split validation based on the same splitting strategy and averaged across the repetitions. Model performance was evaluated using balanced accuracy, precision, recall, and F1-score.
3. Results
3.1. Hemispheric Asymmetry
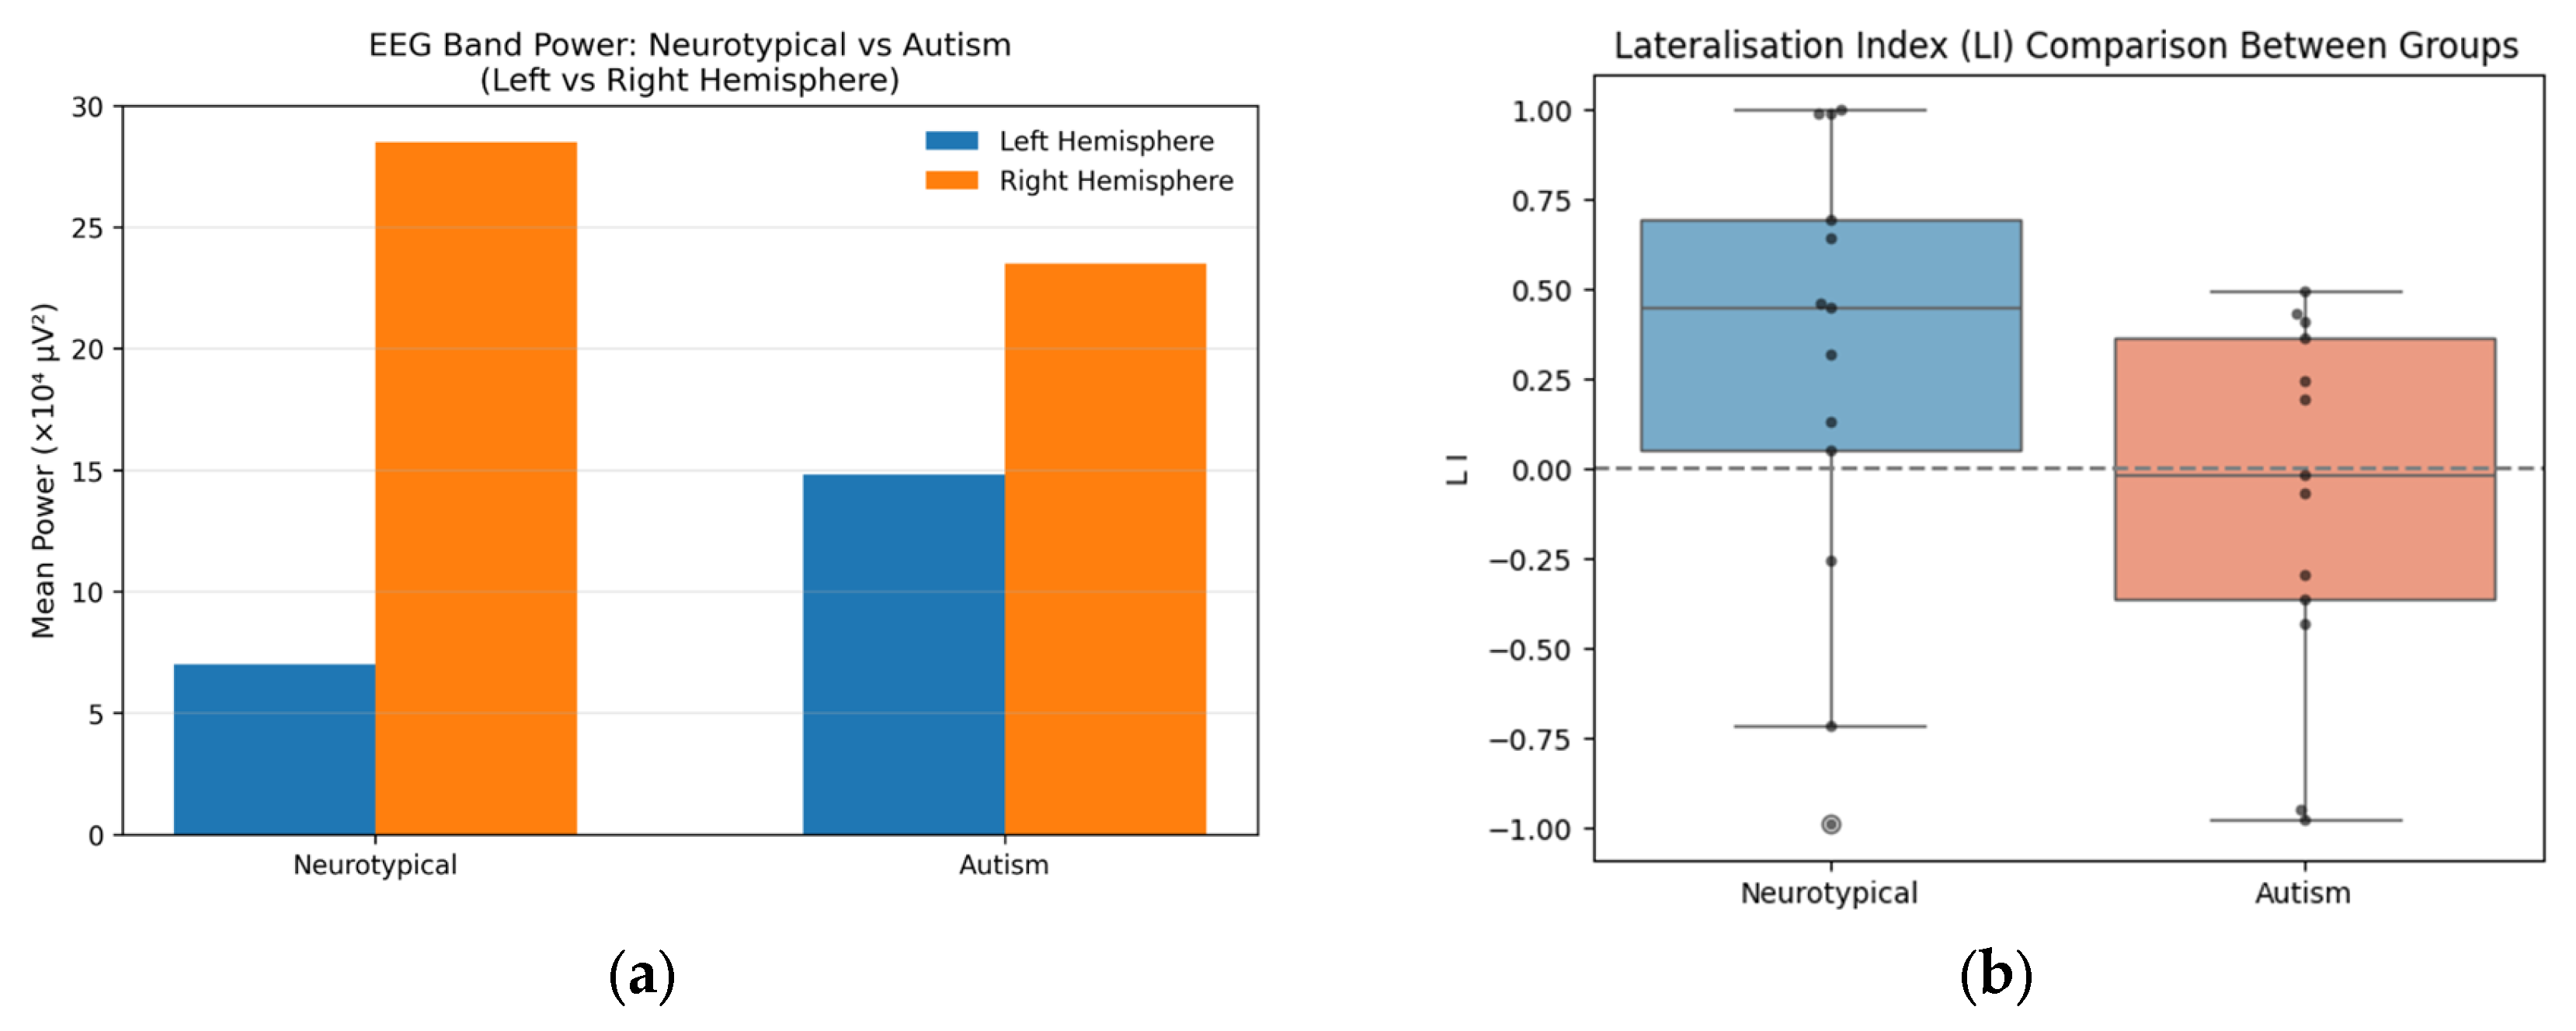
Hemispheric asymmetry was first examined through descriptive analysis of mean band power across hemispheres (
Figure 1a). Neurotypical participants showed a clear right-hemisphere dominance; whereas, this asymmetry was reduced in the ASD group. This pattern is also reflected in the LI distributions (
Figure 1b). The neurotypical group showed higher and more variable LI values while the values from the ASD group were closer to zero, indicating more symmetric brain activity for individuals with ASD.
At the group level, the mean LI was higher in the neurotypical group (0.567) compared to the ASD group (0.222), suggesting reduced hemispheric lateralisation in ASD. However, between-group differences were not statistically significant across frequency bands (all
p > 0.05;
Table A1). Within-group analysis revealed significant hemispheric asymmetry in the neurotypical group across multiple frequency bands (
p < 0.05); whereas, no significant asymmetry was observed in the ASD group (all
p > 0.2;
Table A2). Overall, these findings indicate a consistent trend of reduced hemispheric lateralisation in ASD, although the effect did not reach statistical significance.
3.2. Classification Performance
Table 1 shows the model performance, where LR achieved the highest balanced accuracy (0.80), followed by the RBF SVM and RF, both showing moderate performance (0.70) in the single-split evaluation. The Linear SVM performed extremely poorly, with a balanced accuracy of 0.10. Precision and recall followed a similar pattern (
Table A3), with LR showing the most balanced trade-off between correctly identifying ASD cases and avoiding false positives.
Specifically, while LR achieved a balanced accuracy of up to 0.80 in the single-split setup, with average accuracy approaching chance level (0.54). Similar patterns were observed for the other models. Furthermore, the large standard deviations (±0.16–0.23) indicate limited generalisation capability, likely driven by the small sample size.
4. Discussion
This study investigated the use of hemispheric asymmetry, quantified by the LI, as a feature for ASD classification using EEG data. While descriptive analysis suggested that neurotypical participants exhibit stronger hemispheric lateralisation compared to individuals with ASD, the statistical evidence remained limited due to the small sample size.
A key finding of this work is the discrepancy between single-split and repeated-split evaluation results. Although some models, particularly Logistic Regression, achieved relatively high performance in a single train–test split, these results did not generalise when evaluated across multiple random splits. The average performance dropped close to chance level, with high variability across runs. This indicates that the apparent predictive performance is unstable and likely influenced by random variation rather than robust underlying patterns.
These findings highlight an important methodological issue in EEG-based machine learning studies: small datasets can easily lead to overfitting and overly optimistic evaluation results. Without careful validation strategies, such as participant-level splitting and repeated evaluation, model performance may be misinterpreted. In this context, our study emphasises that evaluation design is as important as model selection, particularly when working with limited data.
Another important consideration is the trade-off between model complexity and interpretability. While many previous studies have adopted complex deep learning architectures, we intentionally focused on simpler and more interpretable models. This allows clearer insight into model behaviour and reduces the risk of overfitting. However, even with simpler models, the limitations of the dataset remain a major constraint.
From a practical perspective, the results suggest that LI-based features alone may not be sufficient for reliable ASD classification in small datasets. Although hemispheric asymmetry appears to carry some signal, its predictive power is weak and inconsistent. Future work should focus on increasing dataset size, incorporating additional features, and performing systematic model optimisation to better assess the potential of EEG-based biomarkers.
In conclusion, this study provides a cautious but informative perspective on EEG-based ASD classification. Rather than focusing on achieving high accuracy, it highlights the importance of robust evaluation and realistic interpretation of results. These insights are particularly relevant for the development of reliable and clinically applicable machine learning models in neuroimaging research.
Author Contributions
Conceptualization, Y.H., N.N. and O.G.; methodology, Y.H., N.N., O.G. and S.S.; software, Y.H. and N.N.; validation, Y.H., N.N., O.G. and S.S.; formal analysis, Y.H., N.N., O.G. and S.S.; investigation, Y.H. and N.N.; resources, Y.H. and N.N.; data curation, Y.H. and N.N.; writing—original draft preparation, Y.H., N.N. and O.G.; writing—review and editing, Y.H., N.N., O.G. and S.S.; visualisation, Y.H., N.N., O.G. and S.S.; supervision, O.G. and S.S.; project administration, O.G.; funding acquisition, O.G. All authors have read and agreed to the published version of the manuscript.
Funding
This research received no external funding.
Institutional Review Board Statement
The study was conducted in accordance with the Declaration of Helsinki and approved by the relevant ethics committees in Romania, Iran, and Sweden, including the ethics committees of Stefan cel Mare University of Suceava and Chalmers University of Technology/University of Gothenburg. Ethical agreements were also established with the Star of Hope Foundation Romania, which supported participant recruitment and parental communication.
Informed Consent Statement
Informed consent was obtained from all subjects involved in the study through their parents or legal guardians. Participants and their guardians were provided with clear and accessible information regarding the study procedures, and care was taken to ensure that all tasks were explained in an age-appropriate manner.
Data Availability Statement
Data is unavailable due to privacy and ethical restrictions.
Acknowledgments
The authors gratefully acknowledge the valuable support and assistance of Diana Sînziana Duca, Cristina Lemeni, Tiberiu Ciortan, Roxana Toderean, and the Star of Hope Autism Center in this research.
Conflicts of Interest
The authors declare no conflicts of interest.
Appendix A
Table A1.
Between-group comparison of Lateralisation Index (LI) across frequency bands using the Mann–Whitney U test.
Table A1.
Between-group comparison of Lateralisation Index (LI) across frequency bands using the Mann–Whitney U test.
| Bands | p-Value |
|---|
| Delta | 0.07 |
| Theta | 0.12 |
| Alpha | 0.14 |
| Beta | 0.07 |
| Gamma | 0.20 |
| All | 0.08 |
Table A2.
Within-group hemispheric asymmetry analysis across frequency bands using the Wilcoxon signed-rank test.
Table A2.
Within-group hemispheric asymmetry analysis across frequency bands using the Wilcoxon signed-rank test.
| Group | Bands | p-Value |
|---|
| Control | Delta | 0.02 |
| Control | Theta | 0.15 |
| Control | Alpha | 0.03 |
| Control | Beta | 0.03 |
| Control | Gamma | 0.04 |
| Autism | All | >0.2 |
Table A3.
Detailed classification performance metrics. Classification performance metrics for all models under single-split and repeated-split evaluation. Repeated-split results are reported as mean ± standard deviation.
Table A3.
Detailed classification performance metrics. Classification performance metrics for all models under single-split and repeated-split evaluation. Repeated-split results are reported as mean ± standard deviation.
| Model | Split Approach | Balanced ACC | Precision | Recall | F1-Score |
|---|
| LR | single | 0.80 | 0.67 | 0.80 | 0.62 |
| repeated | 0.54 ± 0.21 | 0.51 | 0.54 | 0.46 |
| Linear SVM | single | 0.10 | 0.25 | 0.10 | 0.14 |
| repeated | 0.44 ± 0.18 | 0.39 | 0.44 | 0.36 |
| RBF SVM | single | 0.70 | 0.62 | 0.70 | 0.49 |
| repeated | 0.45 ± 0.16 | 0.39 | 0.45 | 0.36 |
| RF | single | 0.70 | 0.62 | 0.70 | 0.49 |
| repeated | 0.46 ± 0.23 | 0.44 | 0.46 | 0.39 |
References
- Salari, N.; Rasoulpoor, S.; Rasoulpoor, S.; Shohaimi, S.; Jafarpour, S.; Abdoli, N.; Khaledi-Paveh, B.; Mohammadi, M. The global prevalence of autism spectrum disorder: A comprehensive systematic review and meta-analysis. Ital. J. Pediatr. 2022, 48, 112. [Google Scholar] [CrossRef] [Scilit] [PubMed]
- Herrero-Martín, J.; Fonseca, D.; Caro-Via, S.; Canaleta, X. Development of personalized profiles of students with autism spectrum disorder for interactive interventions with robots to enhance language and social skills. Front. Psychiatry 2024, 15, 1455627. [Google Scholar] [CrossRef] [Scilit] [PubMed]
- Francis, K.; Karantanos, G.; Al-Ozairi, A.; AlKhadhari, S. Prevention in Autism Spectrum Disorder: A Lifelong Focused Approach. Brain Sci. 2021, 11, 151. [Google Scholar] [CrossRef] [Scilit] [PubMed]
- Costescu, C.; Pitariu, D.; David, C.; Roșan, A. Social communication predictors in autism spectrum disorder: Theoretical review. J. Exp. Psychopathol. 2022, 13, 20438087221106955. [Google Scholar] [CrossRef] [Scilit]
- Gkintoni, E.; Panagioti, M.; Vassilopoulos, S.P.; Nikolaou, G.; Boutsinas, B.; Vantarakis, A. Leveraging AI-Driven Neuroimaging Biomarkers for Early Detection and Social Function Prediction in Autism Spectrum Disorders: A Systematic Review. Healthcare 2025, 13, 1776. [Google Scholar] [CrossRef] [Scilit] [PubMed]
- Neo, W.S.; Foti, D.; Keehn, B.; Kelleher, B. Resting-state EEG power differences in autism spectrum disorder: A systematic review and meta-analysis. Transl. Psychiatry 2023, 13, 389. [Google Scholar] [CrossRef] [Scilit] [PubMed]
- Wan, B.; Hong, S.-J.; Bethlehem, R.A.I.; Floris, D.L.; Bernhardt, B.C.; Valk, S.L. Diverging asymmetry of intrinsic functional organization in autism. Mol. Psychiatry 2023, 28, 4331–4341. [Google Scholar] [CrossRef] [Scilit] [PubMed]
- SharghiLavan, S.; Geman, O.; Toderean, R. Speech Perception and Speech Attention: A Case Study Based on Event-Related Potential Using the OpenBCI System. In Proceedings of the 2024 E-Health and Bioengineering Conference (EHB), Iasi, Romania, 14–15 November 2024; pp. 1–4. [Google Scholar] [CrossRef] [Scilit]
- Sharghilavan, S.; Geman, O.; Abbasi, H.; Toderean, R.; Postolachee, O.; Mihai, A.-S. Explainable AI in EEG Waves Based Classification for Early Identification in Autism. In Proceedings of the 2025 IEEE Medical Measurements & Applications (MeMeA), Chania, Greece, 28–30 May 2025; pp. 1–5. [Google Scholar] [CrossRef] [Scilit]
- Van der Lubbe, R.H.J.; Utzerath, C. Lateralized power spectra of the EEG as an index of visuospatial attention. Adv. Cogn. Psychol. 2013, 9, 184–201. [Google Scholar] [CrossRef] [Scilit]
- Field, A. Discovering Statistics Using IBM SPSS Statistics, 5th ed.; SAGE: Newbury Park, CA, USA, 2018. [Google Scholar]
- Hollander, M.; Chicken, E.; Wolfe, D.A. Nonparametric Statistical Methods, 3rd ed.; Wiley Series in Probability and Statistics; John Wiley & Sons, Inc.: Hoboken, NJ, USA, 2014. [Google Scholar]
| Disclaimer/Publisher’s Note: The statements, opinions and data contained in all publications are solely those of the individual author(s) and contributor(s) and not of MDPI and/or the editor(s). MDPI and/or the editor(s) disclaim responsibility for any injury to people or property resulting from any ideas, methods, instructions or products referred to in the content. |