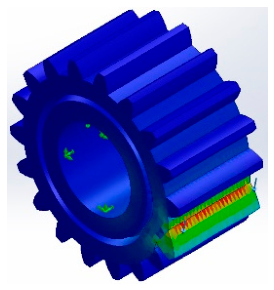
Proceeding Paper

Mixed-Mode Stress Intensity and Crack Growth at Gear Tooth Roots Using Weight Functions and Finite Element Modelling †
by
Patrick Sbusiso Africa
,
Desejo Filipeson Sozinando
*,
Bernard Xavier Tchomeni
and
Alfayo Anyika Alugongo
Department of Industrial Engineering, Operations Management and Mechanical Engineering, Vaal University of Technology, Vanderbijlpark Campus Private Bag X021, Andries Potgieter Blvd, Vanderbijlpark 1911, South Africa
*
Author to whom correspondence should be addressed.
Presented at the 2025 SAIMechE Central Branch Conference on Mechanical Engineering and Related Disciplines, Johannesburg, South Africa, 28 October 2025.
Eng. Proc. 2026, 132(1), 6; https://doi.org/10.3390/engproc2026132006
Published: 23 April 2026

Abstract

Gear tooth root cracks are serious failures mechanism in transmission systems operating under high load and speed. This study develops a mixed-mode model of fracture that incorporates weight function techniques with finite element analysis (FEA) to estimate crack initiation and propagation at the tooth root. Semi-elliptical crack stress intensity factors are obtained by considering a combination of bending and shear forces and contact forces including residual stresses. Simulations of crack growth show the nonlinear development of the depth and redistribution of stress, which is highly dependent on the initial crack aspect ratio. The results of the finite element analysis show that displacement and strain gradually increase with the depth of the crack, and its behaviour is shown to be an essential indicator for maintenance strategies.

1. Introduction

One of the most common applications of gear transmission systems is in industry where their high-speed and high-load transfer of power is very efficient. Gears are subjected to wear, pitting and root cracking due to operational needs, which eventually deteriorates their performance and causes them to fail. Tooth root cracks are of special interest because they occur when there are bending and shear forces as well as contact forces on the fillet region. Linear elastic fracture mechanics (LEFM) offers a basis for crack propagation analysis through the relationship between far-field stresses and near-tip stress intensity factors. When weight function techniques are combined with numerical models, residual stresses and geometric irregularities are shown to have a strong impact on the initiation and propagation of cracks [1,2,3]. The fatigue fracture of the tooth root is especially prone to high cycle loads as there are numerous cycles of loads undertaken in the application of turbo gearboxes, for example, where the very high cycle fatigue (VHCF) range is a factor of concern. The nasgro crack growth equation has been applied to model the tooth root life in this range, accounting for micro- and macro-crack growth and incorporating factors like stress depth, hardness, and residual stress curves [4]. The interference fit in gears, which induces internal pressure, can exacerbate crack growth by increasing tangential stresses, potentially leading to catastrophic failures if the crack propagates towards the rim [5]. Dynamic simulations have shown that tooth root cracks reduce the time-varying meshing stiffness (TVMS) of gear pairs, altering the vibration response and potentially leading to significant dynamic transmission errors [6]. Rotating-system experiments have shown that recurrent contact events generate coupled torsional–lateral signatures, where WSST-based time–frequency analysis is used to isolate the high-frequency shifts produced by rotor–stator interaction and reveals the characteristic split resonance behaviour observed in vertical rotor systems [7]. The dynamic characteristics of gear systems with root cracks are further complicated by factors such as gearbox flexibility, which can alter the vibration response and fault characteristics [8]. Additionally, friction-induced vibration due to poor lubrication and inter-teeth rubbing can exacerbate the dynamic response of cracked gears, as Abdallah and Sassi highlighted in their study on spur gearboxes [9]. FEA has also been used in modelling crack growth and its effects on gear dynamics to give a detailed explanation regarding the path of crack propagation and its influence on gear performance [10]. Moreover, surface modification techniques, like shot peening and DLC coating, could be used to improve fatigue strength, as compressive residual stresses can be introduced in this way, which increases the fatigue life of gear materials [11]. Kim and Hill used weight functions as a predictive tool to determine the contact of crack faces on residual stress-bearing bodies, which is more efficient than the use of the finite element approach to predict fatigue crack growth in beams with residual stress due to previous elastic–plastic bending [12]. Yuan et al. obtained a general point load weight function of SIFs in external circumferential surface cracks in pipes that were validated by the use of three-dimensional finite element analysis, which is essential in the determination of fatigue life in offshore pipes under complex loading conditions [13]. Another important issue that depends on the interaction of multi-cracks and their impact on SIFs was examined by Parsania et al., who estimated the impact of adjacent cracks on the main crack using artificial neural networks with a demonstration of the significance of the geometry of the cracks and the loading conditions [14]. In addition, weight functions are also applicable to the prediction of crack propagation in anisotropic materials, such as the case presented by Kalina et al., who used the phase-field modelling of anisotropic aluminum sheets, which takes into consideration the directional characteristics of the material as a result of the fabrication technique used, like cold rolling [15]. Weight functions combined with new computational techniques, including the extended finite element method (XFEM) and adaptive Runge–Kutta solvers, are used to increase the accuracy and efficiency of crack growth simulations in stochastic and high-cyclic fatigue conditions [16,17].
The initiation and propagation of cracks are dependent on bending, shear, and contact forces at the tooth root. Therefore, it is important to accurately predict the results in order to determine fatigue life. Linear fracture models treat the underlying mechanisms but frequently fail to consider residual stress, geometric variations and dynamic loads, which enhance damage. A combination of weight function approaches and the finite element modelling approach can provide a more detailed description of mixed-mode crack behaviour. The current study builds on this methodology to determine the intensity factors of stress and growth paths to offer a solid foundation of results from assessing gear durability and contribute to the development of predictive maintenance interventions. Cyclic and transient load cases of mode 1, 2, and 3 contributions at the crack tip can be determined by the accurate characterization of local stress fields in the area of the crack tip under cyclic and transient loads. To include torque variations in dynamic excitation, transmission error is added to study the transient effects on crack growth. Other Residual Distributions of stresses that occur due to heat treatment and surface finishing are also incorporated into the model to capture manufacturing effects.

2. Mathematical Model for Gear Tooth Root Crack Initiation and Growth

A crack initiates at the tensile side of the fillet near the tooth root and propagates under a mixed system of bending, transverse shear, and local contact actions. A local orthonormal frame (x,y,z) is set at the prospective crack tip on section AA in Figure 1. The x coordinate follows the local surface normal into the tooth body, y lies along the root direction, and z spans the face width. Polar tip coordinates (r,θ) in the xy plane describe the near-tip field.
The applied gear torque generates a pressure distribution along the line of action. Integrating this distribution over the instantaneous contact length yields a single resultant force on the engaged tooth. In a spur gear, the resultant is decomposed into tangential and radial components set by geometry.
F t = 2 T d p
F r = F t tan ( ϕ )
where T is the applied gear torque, dp is pitch diameter and ϕ is the operating pressure angle. Tangential force Ft drives root bending through its lever arm to section AA; radial force Fr contributes bending moment and transverse shear at the root.
M = F t h
V y = F t
V z = F r
with h being the moment arm from the contact resultant to section AA. For a root section of width b and local thickness t, the nominal stresses that drive cracking can be expressed as follows:
σ x x ( 0 ) = 6 M b t 2
τ x y ( 0 ) = 1.5 V y b t
τ x z ( 0 ) = V z b t
Fillet curvature and nonuniform thickness modify these through a stress concentration factor Kt(x,z) obtained from finite element formulas:
σ x x = K t σ x x ( 0 )
τ x y = K t τ x y ( 0 )
τ x z = K t τ x z ( 0 )
A surface crack at the tensile fillet is represented on section AA by a semi-elliptical front defined in the local (x,z) plane as follows:
x 2 a 2 + z 2 c 2 = 1 ,   0 x a ,   0 z c
x points into the tooth body, z spans the face width, a is the crack depth, and 2c is the crack length across the width. Points along the front are indexed by the angular parameter φ. Shape factor Q = 1 + 1.464 (a/c)1.65 characterizes front curvature and enters standard stress intensity expressions. Stress near the free edges at z = ±c behaves under plane stress conditions, and regions toward the mid-width gradually approach a plane strain state. The tangential mesh loads Ft along the system through the lever arm h and Ft across it are forces which cause root bending, transverse shear, and radial forces and open mode 1, mode 2, and mode 3 respectively. Section stresses therein are associated with KI(φ), KII(φ), and KIII(φ) through the Newman–Raju-type factors of semi-elliptical surface cracks in finite thickness t. The superposition of residual stress profiles occurs through weight functions and may protect or improve KI. A calibrated fatigue law is used to obtain growth per cycle at each front point using the cyclic range ΔK, and both a and c are updated as the front advances into the tooth. Linear elastic fracture mechanics relates the far-field stresses of sections to the near-tip fields in terms of stress intensity factors [18,19].
σ i j ( r , θ ) = 1 2 π r K I f i j ( I ) + K I I f i j ( I I ) + K I I I f i j ( I I I )
A semi-elliptical surface crack in a finite-thickness plate under combined normal and shear can be expressed as follows:
K I ( φ ) = F I ( φ ; a / c , a / t ) σ x x π a Q 1 / 2
K I I ( φ ) = F I I ( φ ; a / c , a / t ) τ x y π a Q 1 / 2
K I I I ( φ ) = F I I I ( φ ; a / c , a / t ) τ x z π a Q 1 / 2
The direct addition of residual stress and shear fields is conducted via the weight function integral evaluated along the crack depth at each front location φ.
K I r e s ( φ ) = 0 a m I ( φ , x ) σ x x r e s ( x ) d x
K I I r e s ( φ ) = 0 a m I I ( φ , x ) τ x y r e s ( x ) d x
K I I I r e s ( φ ) = 0 a m I I I ( φ , x ) τ x z r e s ( x ) d x
where m(φ,x) is the mode weight function for the semi-elliptical surface crack, and x measures the distance from the surface along the local x-axis.
The maximum circumferential stress criterion yields the in-plane kink angle θ0 at each front point.
The out-of-plane shear also rotates the front over the face width, changing the propagation of the front. A realistic mixed-mode equivalent range is then used to represent the combined effect of in-plane and out-of-plane loading, which will give a more realistic measure of the fracture driving force.
tan θ 0 / 2 = K I ± K I 2 + 8 K I I 2 4 K I I
Δ K e q ( φ ) = Δ K I 2 + λ Δ K I I 2 + Δ K I I I 2 1 / 2
where λ is material calibration. When opening and sliding interact, the direction of growth minimizes shear at the tip and maintains circumferential tension. The growth per cycle at each front location is a Paris-type relation, with limiting factor ΔKth and maximum limit KIC. Directional growth enhances directional growth, and plane stress at free edges frequently accelerates local advancement, thus rounding out shallow fronts with more depth. The rate is determined by material fatigue constants and service ΔK history, and the mode mix determines the direction.
d a d N = C Δ K e q ( φ ) m
a n + 1 ( φ ) = a n ( φ ) + Δ N d a d N cos θ 0
c n + 1 ( φ ) = c n ( φ ) + Δ N d a d N sin θ 0
Plane strain validity requires the specimen thickness, crack length, and remaining ligament to satisfy B, a, Wa ≥ 2.5 (KIC/σY)2, and KIC is measured in accordance with ASTM E399 standard using fatigue pre-cracked specimens [20].
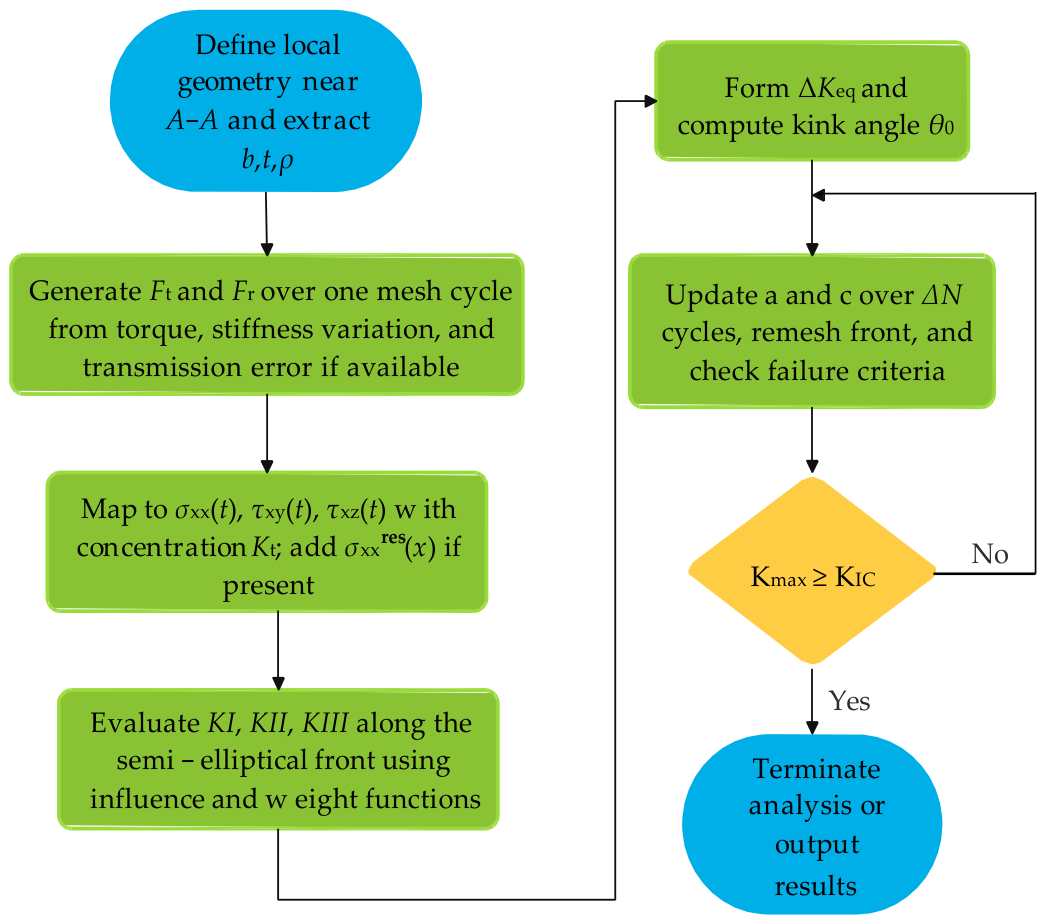
Figure 2 depicts the chronological steps that were used in the study of gear tooth root crack growth in mixed-mode loading. The first step consists of the definition of the local geometry around section AA and the extraction of parameters associated with the local stress field, width, thickness, and fillet radius. Tangential and radial forces based on the variation in stiffness and transmission error are then considered to create stress components. These stresses are plotted on σxx(t), τxy(t), and τxz(t) where concentration factors are used to represent geometric irregularities and residual stresses in the event that they exist.
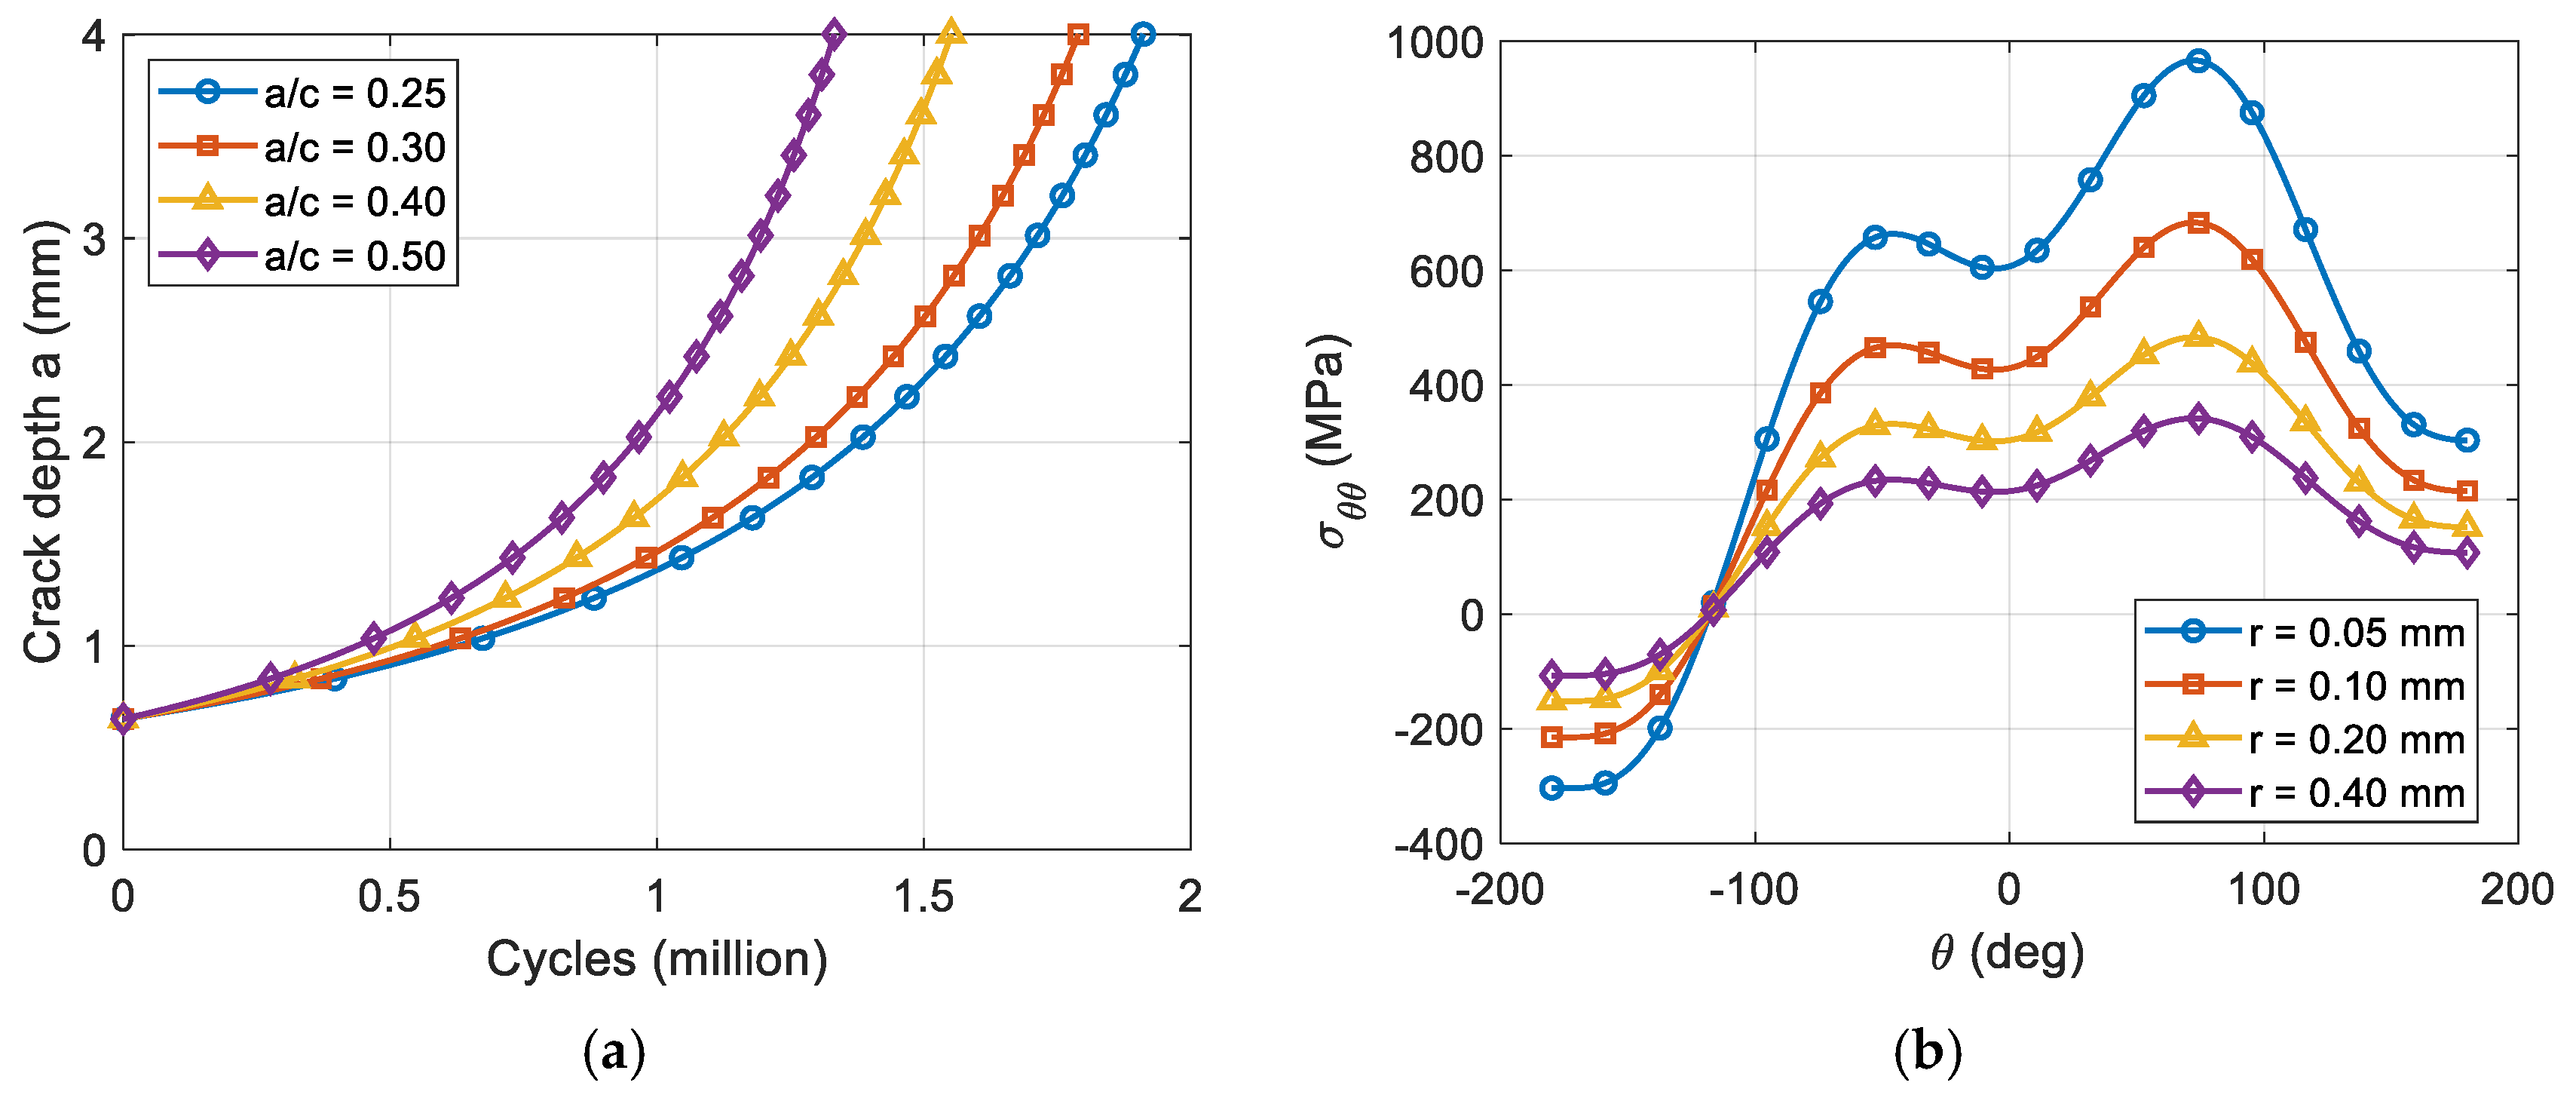
Figure 3a shows how the depth of the cracks varies with the number of fatigue cycles as the initial ratio of the aspect (a/c = 0.25–0.50) is varied. Cracks that have higher aspect ratios have higher propagation rates, which means that shallow cracks followed by wide cracks are faster in passing to deeper propagation regimes. The curves show nonlinear behaviour in growth, where acceleration is experienced after about a million cycles, which is in agreement with fatigue crack coalescence. The angular distribution of circumferential stress σθθ at the crack tip with different radial distances to the root surface is presented in Figure 3b. The stress concentration is highly dependent on radial position, with the highest values of the stress concentration being at r = 0.05 mm and then decreasing gradually as one moves farther up the crack tip. Angular peaks occur when tensile stresses are dominant at θ = 90°, as well as a series of additional changes due to the asymmetry created by shear along the crack front.

3. Finite Element Model Formulation and Analysis

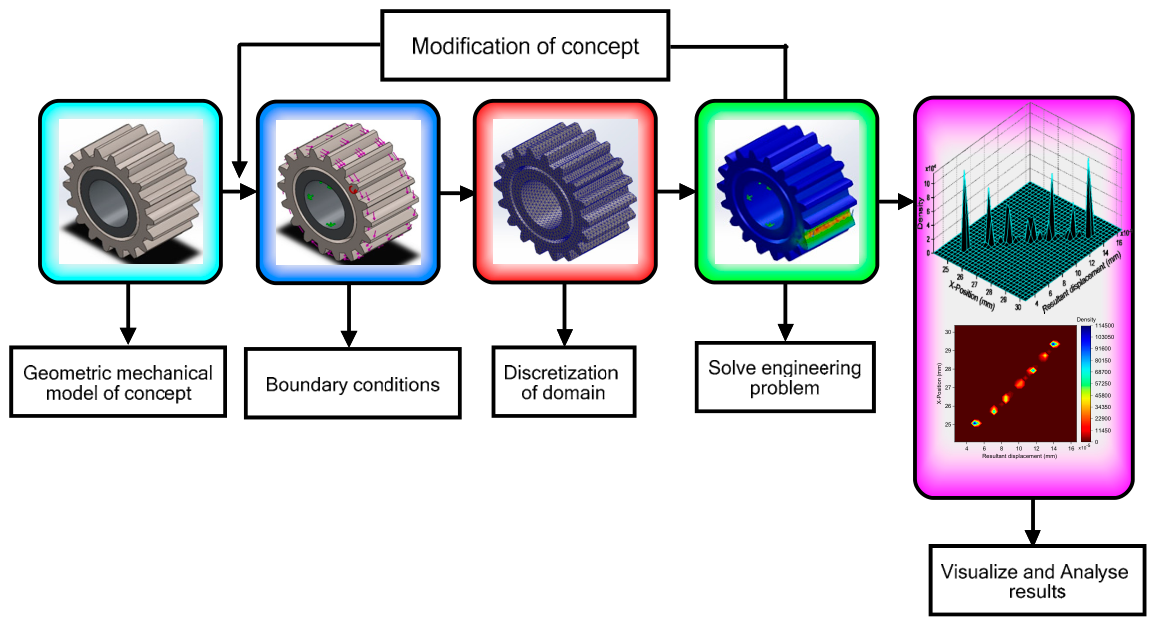
Finite element analysis provides a structured pathway for translating the gear system into a computational model capable of predicting local fields at the tooth root and around an incipient crack. Figure 4 shows the obvious flow which connects the physical concept to the numerical output, in which the steps used are the definition of geometry, the use of boundary conditions, discretization, coming to a solution, and interpretation, with the process being repeated with an iterative change in the search when the results indicate a design change. The domain of analysis is the geometric mechanical model which provides the solution of the tooth fillet, rim and some of the hub with a precise fillet radius, local thickness, face width and root changes that govern load transfer.
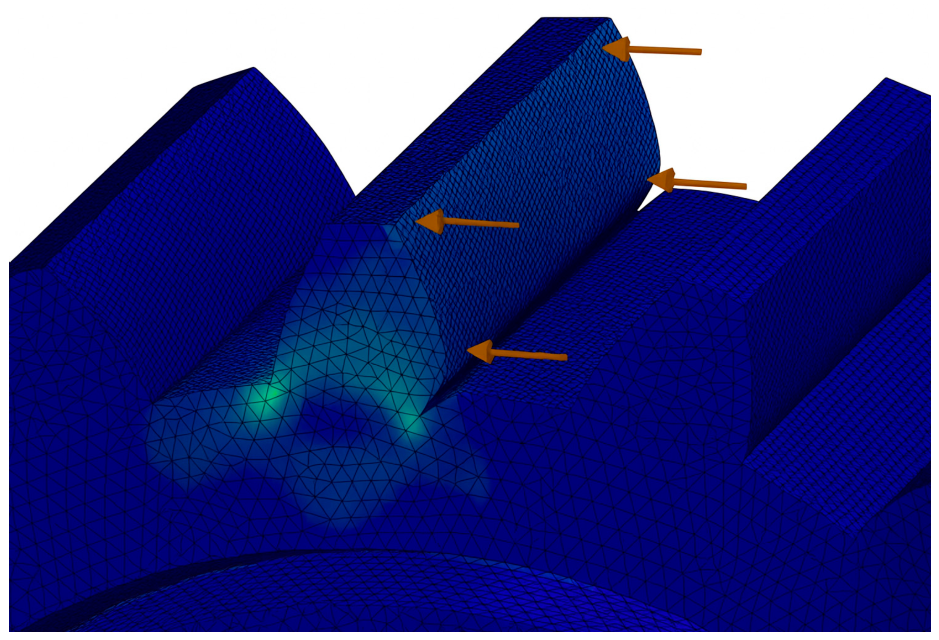
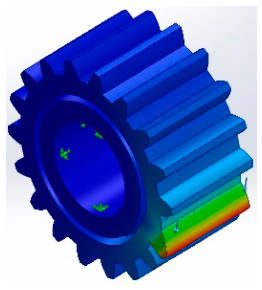
Figure 5 shows the finite element mesh of the gear tooth profile, with emphasis on the fillet region and the loading zones where stresses concentrate during operation. The meshing captures the complex geometry of the tooth, including the curved fillet, which is a critical location for crack initiation due to the combined action of bending and shear forces. The highlighted zones indicate regions where external loads are applied along the tooth flank, transmitting forces into the root section.
Arrows indicate the direction of the applied contact force and load transfer path along the tooth surface. The contour colours represent the distribution of von Mises stress, where blue denotes low stress and warmer colours (green to yellow) indicate higher stress concentrations.
The content of Table 1 consists of the material properties of the spur gear, with a linear elastic isotropic framework, developed with AISI 316 stainless steel. The default failure criterion is set to the maximum von Mises stress, which is used to enable the simulation to yield under multiaxial stress states. The tensile strength of 580 MPa and yield strength of 172.369 MPa show that the material can be subjected to considerable elastic deformation before failure, and the material has a large safety margin before reaching ultimate failure.
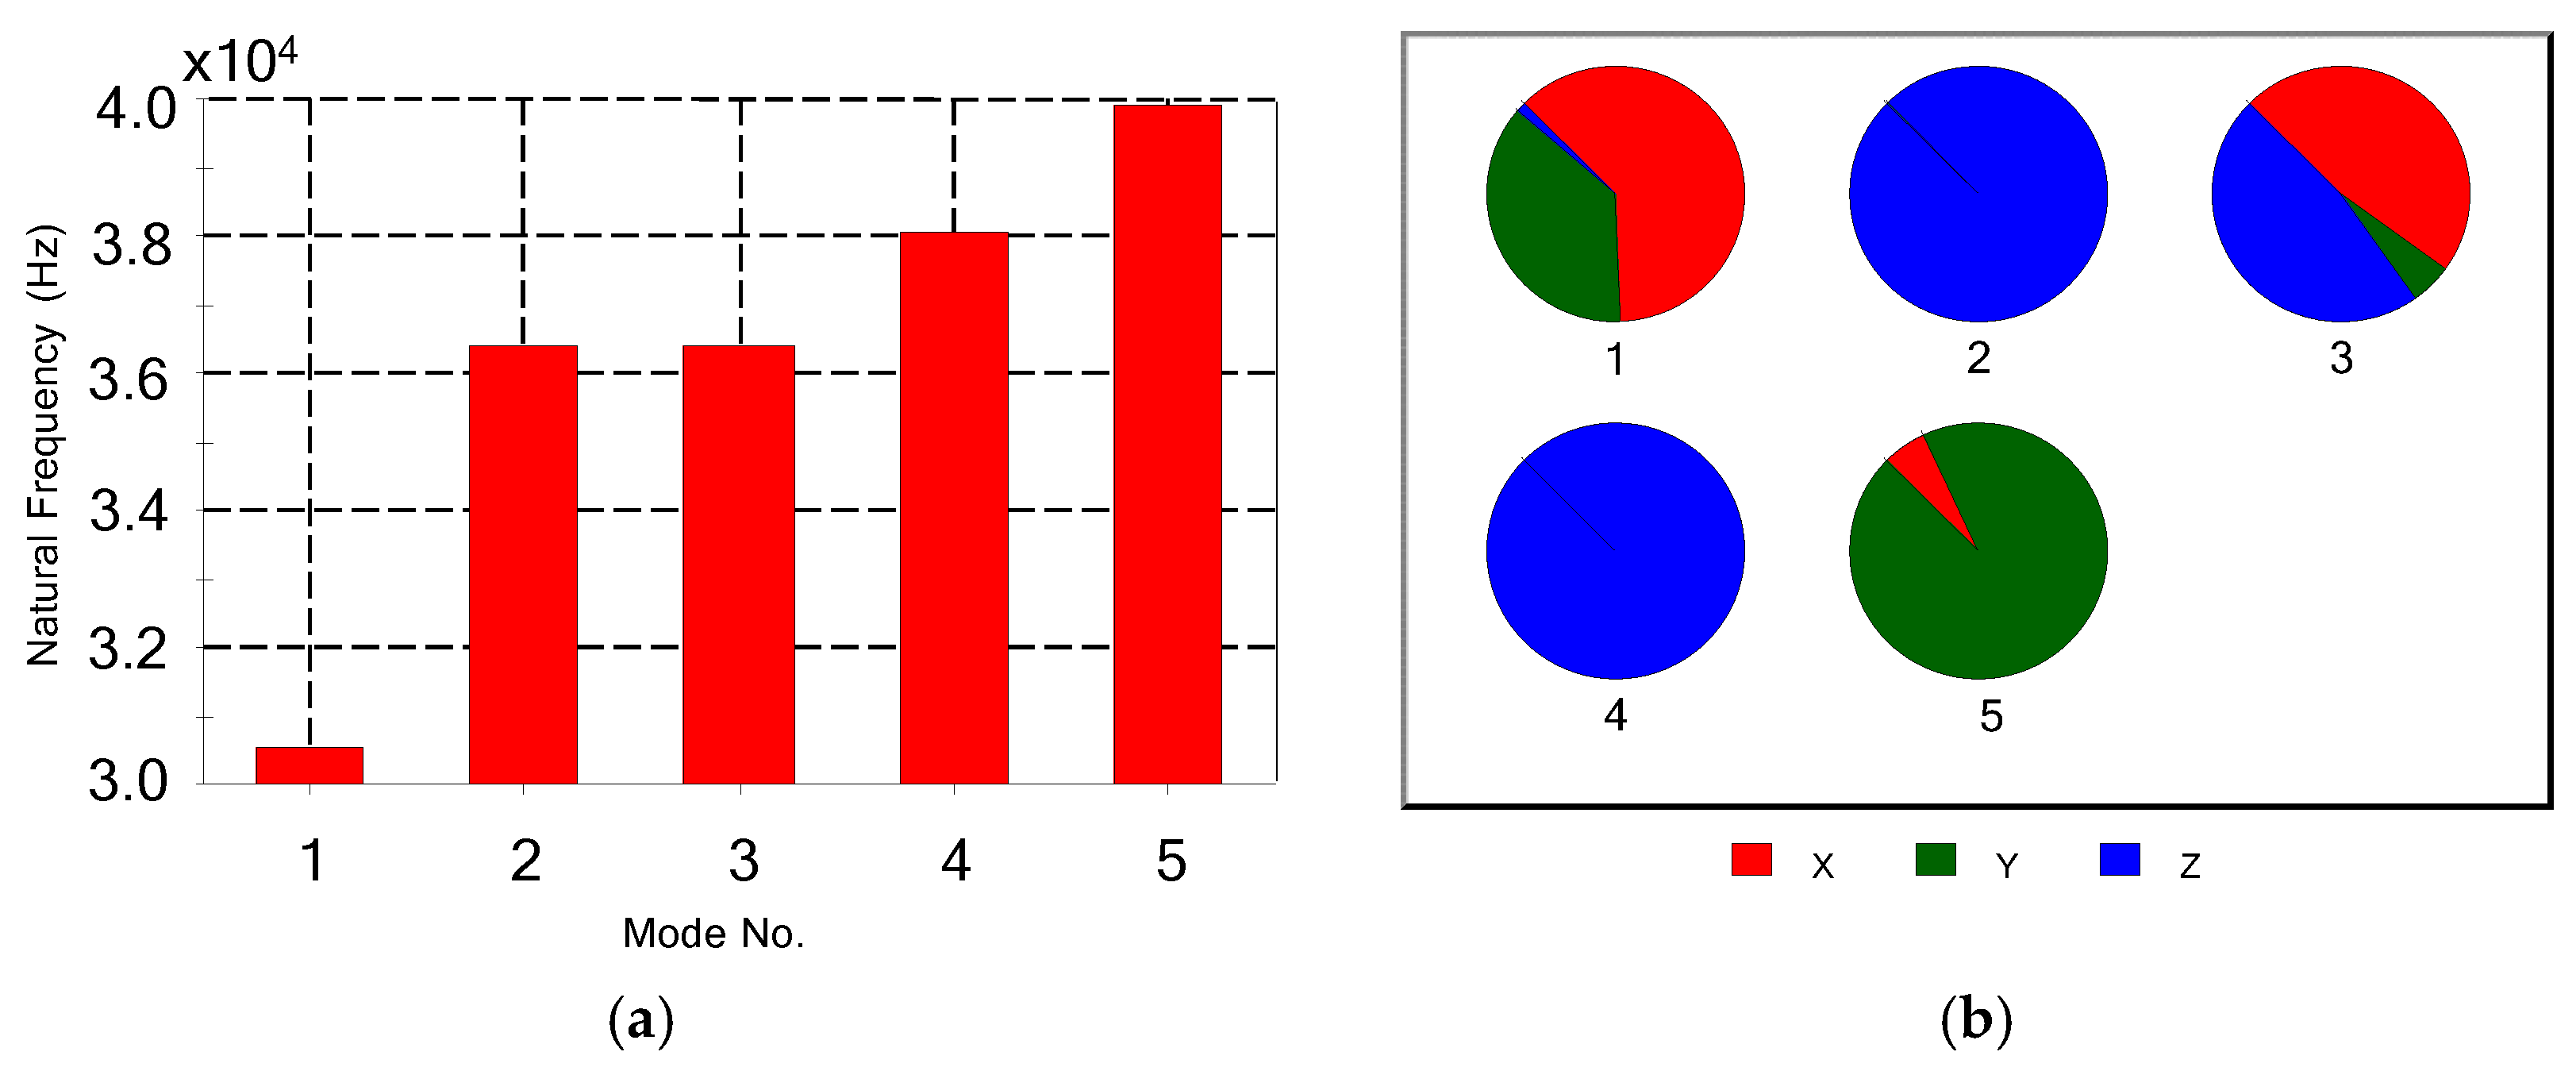
Figure 6a gives the values of the natural frequencies that are within the range of about 30,800 to 40,000 Hz, which shows that the gear system is highly stiff. The development of frequencies between the modes indicates the complexity of structural deformation, with mode 1 being the fundamental mode with the lowest frequency and mode 5 representing the closest resonance to the highest resonance within the considered range of frequencies. Figure 6b shows the effective factor of participation of each mode in the x, y, and z directions. The distribution brings out the directional preeminence of vibration in varying modes. Mode 1 has a strong contribution of both the x- and y-axes, whereas modes 2 and 3 are controlled by x and z combined contributions. Mode 4 exhibits strong z-axis dominance, indicating an out-of-plane vibrational mode, whereas mode 5 is primarily influenced by y-axis dynamics with some x-axis interaction.
Table 2 shows the finite element results for spur gear teeth with cracks of 1 mm and 3 mm depths. Stress distribution, displacement and strain response are modified by increasing the size of the cracks. A 1 mm crack has a maximum von Mises stress value of 2593 kPa and a displacement of 143 × 10−6 mm and strain value of 1.026 × 10². In the case of a 4 mm crack, stress rises slightly to 2777 kPa, and displacement and strain become 213.8 × 10⁻⁶ mm and 1.172 × 10². The findings indicate that deep cracks cause the amplification of the mechanical response, although the minimum stress levels are low. The blue colour indicates minimum values and red indicates maximum values. Intermediate colours (cyan, green, yellow) represent increasing magnitudes of the respective field variables (von Mises stress, displacement, and strain).
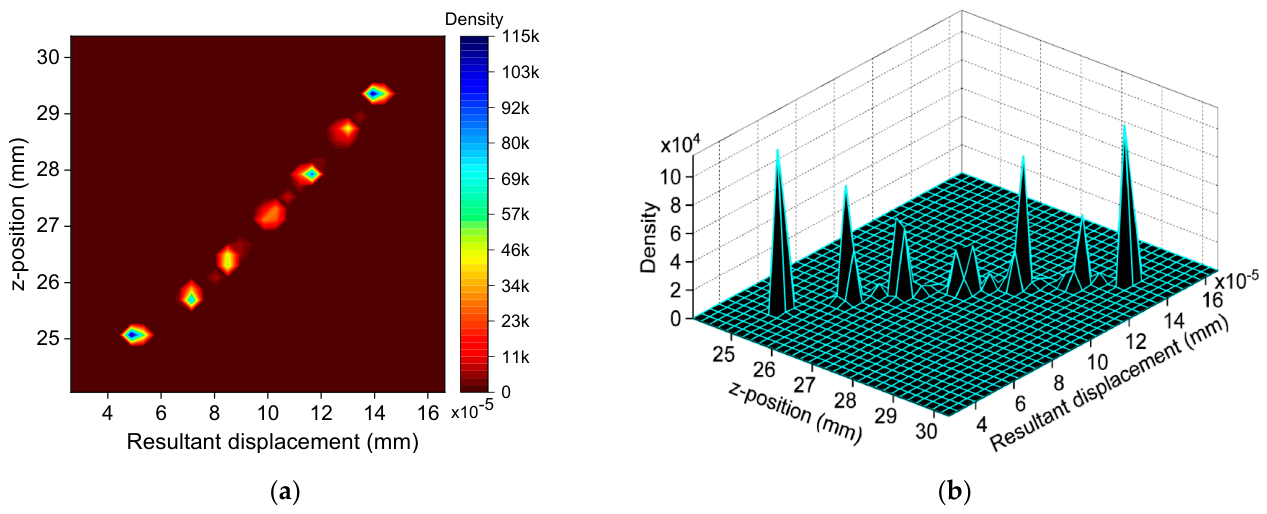
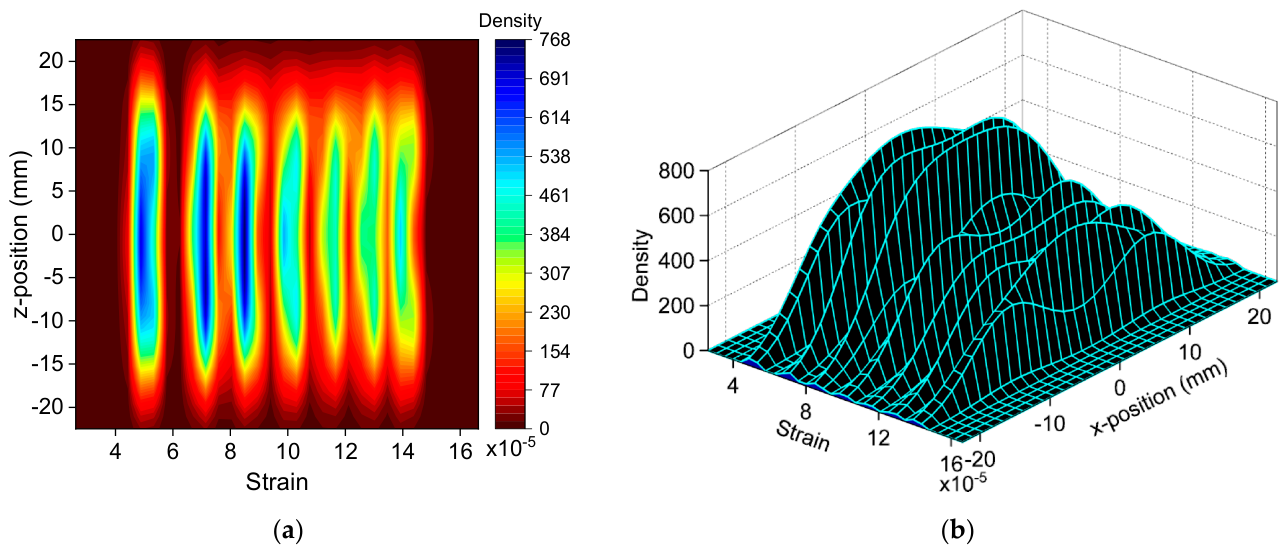
Figure 7a shows the z-position verses resultant displacement with localized groups of high-density response in the range of 25–30 mm along the tooth width and the displacements localized between 4 × 10⁻⁵ mm and 16 × 10−5 mm. The localization of values shows that deformation is not diffused throughout the length of the tooth root, but instead it is localized in a number of positions, which show the local effect of the 1 mm crack on structural flexibility. Figure 7b presents a 3D density estimation of the same relationship in which there are sharp peaks higher than 1.0 × 10⁴ in density that are used to indicate the areas of the maximum displacement concentration. The peaks are at the z-positions of about 25 mm and 29 mm, which are where deformation is enhanced by the redistribution of stress. The pattern of nonuniform density proves that even a shallow depth of cracks would cause severe differences in the structural response, and the thick density of the structure would indicate a possible location of increased fatigue development. Figure 8a displays a contour plot that indicates periodic high-density bands between the width of the teeth between −20 mm and +20 mm with strain varying between 5 × 10⁻⁵ and 14 × 10−5. Several high-intensity zones denote the great strain redistribution of the deeper crack as opposed to the local deformation of 1 mm depth. The 3D density estimation is given in Figure 8b, the maximum density values are about 800, and displacement is concentrated towards certain z-positions at shallow depths of the crack, and deeper cracks result in a wider and more homogenous distribution of strain across the tooth width. The smoother distribution is also an indication of the progressive weakening of the tooth structure where the strain energy is distributed over a larger region.

4. Conclusions

This investigation confirmed that root cracks in spur gears increase stresses, displacements and strains and the magnitude of these increases as the depth of the crack increases. Mixed-mode stress intensity factors were effectively calculated by integrating weight function techniques and finite element analysis and were used to predict nonlinear crack propagation. The findings indicated that preliminary crack geometry can strongly accelerate fatigue damage, with emphasis on the need to find fatigue in gear transmissions. Extending the model to dynamical loads, thermal and lubrication, the validation of the model on full-scale gears and integration with machine learning to identify the pattern and predictive diagnostics will improve maintenance strategies and extend the service life.

Author Contributions

This study was a collaborative effort between multiple individuals. The topic was conceptualized and initially developed by P.S.A. and D.F.S.; the methodology was created by P.S.A., D.F.S., B.X.T. and A.A.A.; D.F.S. was responsible for the software used; the formal analysis of the data was conducted by P.S.A. and D.F.S.; the first version of the manuscript was prepared by P.S.A., D.F.S., B.X.T. and A.A.A.; the manuscript was reviewed and approved by all authors, including P.S.A., D.F.S., B.X.T. and A.A.A. All authors have read and agreed to the published version of the manuscript.

Funding

This research received no external funding.

Institutional Review Board Statement

Not applicable.

Informed Consent Statement

Not applicable.

Data Availability Statement

The original contributions presented in the study are included in the article; further inquiries can be directed to the corresponding author.

Acknowledgments

This research study is supported by the Vaal University of Technology, Department of Industrial Engineering, Operations Management and Mechanical Engineering.

Conflicts of Interest

The authors declare no conflicts of interest.

References

  1. Janulionis, R.; Dundulis, G. Numerical evaluation of residual stress influence on SIF in CT specimen. Appl. Sci. 2023, 13, 6180. [Google Scholar] [CrossRef]
  2. Ertekin, Ş.; Yılmaz, A. Fatigue Crack Growth of Turbine Disc Part Considering Effect of Shotpeen Nonlinear Stress Gradients Using Finite Element Based and Numerical Methods. In Turbo Expo: Power for Land, Sea, and Air; American Society of Mechanical Engineers: Houston, TX, USA, 2024; Volume 88032, p. V10BT24A006. [Google Scholar]
  3. Zhao, L.; Sun, Y.; Shi, Z.; Yang, B. Analysis of crack propagation behaviors in RPV dissimilar metal welded joints affected by residual stress. Materials 2023, 16, 6578. [Google Scholar] [CrossRef] [PubMed]
  4. Lövenich, J.; Zalfen, M.; Mevissen, D.; Brimmers, J.; Brecher, C. Crack growth based tooth root life prediction model—An influence quantity analysis. Forsch. Ingenieurwesen 2023, 87, 1057–1067. [Google Scholar] [CrossRef]
  5. Güven, F. An XFEM-Based approach to fatigue crack growth in press-fit spur gears. Proc. Inst. Mech. Eng. Part E J. Process Mech. Eng. 2022, 236, 1671–1681. [Google Scholar] [CrossRef]
  6. Fan, Z.; Liu, X.; Cao, Z.; Kang, Z.; Hu, Y.; Liu, Y. Dynamic simulation for fault signals of cracked gear based on slice coupling theory. In Proceedings of the 2022 International Conference on Sensing, Measurement & Data Analytics in the Era of Artificial Intelligence (ICSMD), Harbin, China, 30 November–2 December 2022; pp. 1–5. [Google Scholar]
  7. Sozinando, D.F.; Tchomeni, B.X.; Alugongo, A.A. Experimental study of coupled torsional and lateral vibration of vertical rotor-to-stator contact in an inviscid fluid. Math. Comput. Appl. 2023, 28, 44. [Google Scholar] [CrossRef]
  8. Liu, Z.; Chang, C.; Hu, H.; Ma, H.; Yuan, K.; Li, X.; Zhao, X.; Peng, Z. Dynamic characteristics of spur gear system with tooth root crack considering gearbox flexibility. Mech. Syst. Signal Process. 2024, 208, 110966. [Google Scholar] [CrossRef]
  9. Abdallah, O.; Sassi, S. Contribution of friction-induced vibration to the realistic failure analysis of spur gear cracked teeth. Eng. Fail. Anal. 2024, 158, 107956. [Google Scholar] [CrossRef]
  10. Ilie, P.; Ince, A. Three-dimensional fatigue crack growth simulation and fatigue life assessment based on finite element analysis. Fatigue Fract. Eng. Mater. Struct. 2022, 45, 3251–3266. [Google Scholar] [CrossRef]
  11. Yu, B.; Xu, C.; Gao, K.; Yang, W.; Wang, X.; Sun, Z.; Zhang, B.; Tang, Z. Effect of compound surface modification of shot peening and DLC coating on surface integrity and fatigue properties of gear steel 16Cr3NiWMoVNbE. Heliyon 2024, 10, e37991. [Google Scholar] [CrossRef] [PubMed]
  12. Kim, J.; Hill, M.R. Assessment of crack face contact using a weight function with application to fatigue crack growth in residual stress bearing bodies. Int. J. Fatigue 2023, 176, 107858. [Google Scholar] [CrossRef]
  13. Yuan, K.; Dong, K.; Fang, Q. General point load weight function of stress intensity factors for external circumferential surface cracks in pipes. Ocean Eng. 2024, 308, 118263. [Google Scholar] [CrossRef]
  14. Parsania, A.; Kakavand, E.; Hosseini, S.A.; Parsania, A. Estimation of multiple cracks interaction and its effect on stress intensity factors under mixed load by artificial neural networks. Theor. Appl. Fract. Mech. 2024, 131, 104340. [Google Scholar] [CrossRef]
  15. Kalina, M.; Schöne, V.; Spak, B.; Paysan, F.; Breitbarth, E.; Kästner, M. Fatigue crack growth in anisotropic aluminium sheets—Phase-field modelling and experimental validation. Int. J. Fatigue 2023, 176, 107874. [Google Scholar] [CrossRef]
  16. Lv, W.; Ding, B.; Zhang, K.; Qin, T. High-Cycle Fatigue Crack Growth in T-Shaped Tubular Joints Based on Extended Finite Element Method. Buildings 2023, 13, 2722. [Google Scholar] [CrossRef]
  17. de Santana Gomes, W.J.; Beck, A.T.; Garmbis, A.G. Efficient Runge–Kutta solver for stochastic crack growth analysis. Probabilistic Eng. Mech. 2023, 74, 103503. [Google Scholar] [CrossRef]
  18. Guo, F.; Li, Y.; Chen, Y.; Liu, P.; Wang, X. Investigation of the Stress Intensity Factor in Heterogeneous Materials Based on the Postprocessing Routine of Commercial Finite Element Software. Appl. Sci. 2025, 15, 5827. [Google Scholar] [CrossRef]
  19. Molski, K.L.; Derpeński, Ł.; Szusta, J.; Karakaş, Ö. A novel approach to calculate the KIII factor for a crack on a sharp corner using Green’s function. Int. J. Fatigue 2023, 167, 107328. [Google Scholar] [CrossRef]
  20. ASTM E399-22; Standard Test Method for Linear-Elastic Plane-Strain Fracture Toughness of Metallic Materials. ASTM International: West Conshohocken, PA, USA, 2022.
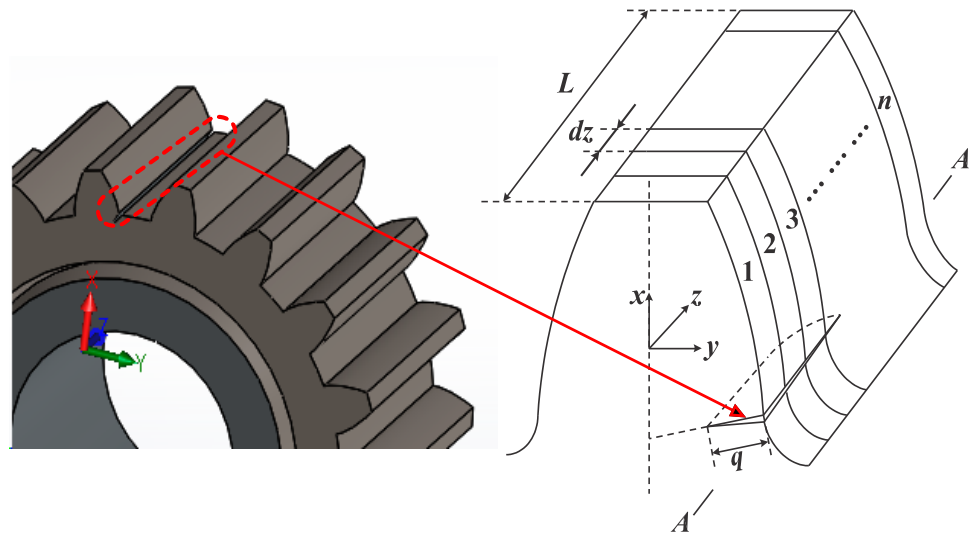
Figure 1. Gear tooth root crack geometry with local x-y-z coordinates on section AA.
Engproc 132 00006 g001
Figure 2. Numerical procedure for gear tooth root crack growth analysis.
Engproc 132 00006 g002
Figure 3. (a) Effect of initial crack aspect ratio on depth evolution under cyclic loading. (b) Angular distribution of circumferential stress at crack tip.
Engproc 132 00006 g003
Figure 4. Conceptual diagram of finite element modelling and solution process.
Engproc 132 00006 g004
Figure 5. Finite element mesh of gear tooth profile with highlighted fillet and loading zones.
Engproc 132 00006 g005
Figure 6. (a) Natural frequencies and their respective modes. (b) Effective mass participation factor.
Engproc 132 00006 g006
Figure 7. Cracked gear teeth of 1 mm depth: (a) z-position as function of resultant displacement; (b) 3D density estimation of z-position and resultant displacement.
Engproc 132 00006 g007
Figure 8. Cracked gear teeth of 4 mm depth: (a) z-position as function of strain; (b) 3D density estimation of z-position and strain.
Engproc 132 00006 g008
Table 1. Material properties of spur gear.
MaterialAISI 316 Stainless Steel Sheet (SS)
Model typeLinear Elastic Isotropic
Default failureMax von Mises Stress
Yield strength172.369 MPa
Tensile strength580 MPa
Elastic modulus193 GPa
Poisson’s ratio0.27
Mass density8000 kg/m3
Table 2. Crack depth of spur gear teeth.
Cracked Gear Teeth of 1 mm Depth
Von Mises StressResultant Displacement Equivalent Strain
Min: 10.68 PaMin: 0 mmMin: 6996 × 10−8
Max: 2593 kPaMax: 143 × 10−6 mmMax: 1026 × 102
Engproc 132 00006 i001Engproc 132 00006 i002Engproc 132 00006 i003
Cracked Gear Teeth of 4 mm Depth
Von Mises StressResultant Displacement Equivalent Strain
Min: 28.14 PaMin: 0 mmMin: 191.3 × 10⁻⁸
Max: 2777 kPaMax: 213.8 × 10⁻⁶ mmMax: 1172 × 102
Disclaimer/Publisher’s Note: The statements, opinions and data contained in all publications are solely those of the individual author(s) and contributor(s) and not of MDPI and/or the editor(s). MDPI and/or the editor(s) disclaim responsibility for any injury to people or property resulting from any ideas, methods, instructions or products referred to in the content.