Abstract
Nowadays, the automotive industry is primarily driven by the CO2 policy that targets net zero carbon emissions by 2035 from passenger cars and commercial vehicles. The main path to achieve this goal is the implementation of electric powertrains with the energy stored in batteries, as the case for battery electric vehicles (BEV). However, this technology still faces some difficulties in terms of energy density, overall weight, charging time, and vehicle autonomy. From the other point of view, fuel cell electric vehicles (FCEV) offer the same advantages as BEV in terms of CO2 reduction, providing better autonomy and lower refueling time. The energy demand by the electric powertrain strongly depends on the vehicle driving conditions as it directly affects energy consumption. In that context, the article aims to study the electrical energy demand of an ultra-energy efficient vehicle intended for a Shell eco-marathon competition in order to minimize hydrogen consumption. The study was carried out over a single lap on the racing track in Nogaro, France while applying the race rules from the competition in 2023. It includes a numerical evaluation of the vehicle resistance forces in different driving strategies and experimental validation on the propulsion test bench.
1. Introduction
Domestic transport is responsible for approximately 23% of CO2 [1] emissions in the European Union of which 71.7% [2] is emitted by the road transport due to the burning of fossil fuels. In order to achieve the target for a carbon neutral economy by 2050, a legislation pathway was adopted in the EU that aims to have only zero CO2 passenger cars be available on the market by 2035. In the short term, low-to-zero carbon fuels such as hydrogen, methane, and ammonia could be used in internal combustion engines in order to reduce greenhouse gases. Dimitrov et al. in [3] studied the impact of hydrogen added to a diesel engine, determining the relative hydrogen quantity limitation considering the rate of in-cylinder pressure, maximum in-cylinder pressure, and rate of heat release. They revealed that the percentage of hydrogen could not be more than 15% in the engine load over 50%. Hydrogen could be used in direct-injection spark ignited engine, as is shown in [4]. This approach could provide an engine thermal efficiency of 37.9%. However, H2-ICE emit NOx, which needs additional technologies for their limitation [5]. On the other hand, electric propulsions offer zero on-board CO2 emissions either in battery electric vehicles (BEV) and hydrogen fuel cell electric vehicles (HFCEV). Both technologies are commercially available despite several inconveniences such as lower energy density, vehicle autonomy, recharging time, weight, etc. In this context, HFCEV that uses a proton-exchange membrane fuel cell (PEMFC) offers better autonomy and lower refilling time while the hydrogen production cost is still higher than fossil fuels and electricity [6]. Another study [7], however, revealed that HFCEV offers the lowest CO2 compared to BEV and ICE when well-to-wheel analysis was considered. This is the case when hydrogen is produced by means of electrolysis and the electricity comes from wind energy. For HFCEV, energy management is a critical point to achieve lower fuel consumption and to moderate the fuel cell degradation in long-term operation [8]. Ruled-based EMS based on fuzzy logic were widely studied [9,10,11]. Optimization-based EMS overcame some limitations in ruled-based strategies for the complex optimization in HFCEV. An example of this approach is shown in [12], where a predictive velocity control was applied, as well as in [13]. In some cases, energy management should be realized in predefined conditions such as predefined travel distance, average speed, number of stops, number of accelerations, etc. This is the case in the competition for energy efficient lightweight vehicles such as those in the Shell eco-marathon [14,15,16]. In the Urban Concept category, among the predefined distance and the maximum allowed time to pass the distance, vehicles must stop once per lap then must accelerate from zero. Stabile et al. in [15] revealed that the vehicle mass has an important impact on energy consumption followed by aerodynamic and rolling resistances. Pusztai et al. [14] also studied the impact of torque strategy control on the energy consumption of a BEV. This study revealed that the modified max torque control method led to lower energy consumption. In this context, this study aims to minimize the hydrogen consumption of an ultra-energy efficient lightweight vehicle developed for the Urban Concept category in the Shell eco-marathon competition at Nogaro racing circuit and competition rules in 2023 when different driving strategies were applied.
2. Vehicle and Rack Overview
The Shell eco-marathon is a global competition for energy efficient vehicles that aim to achieve the boundaries of minimum energy consumption for all types of power sources. Each year the competition takes place in three spots, Europe, America, and Asia, as the teams compete in two major categories: Prototypes and Urban Concept. The prototypes are developed in a way to achieve the lower limit in energy needed for propulsion while the Urban Concept vehicles bring the sign of regular passenger cars driving in urban areas. All the vehicles must be developed by students or school teams as they respect the technical regulation for each category. The power source can be an internal combustion engine, battery for BEV, and hydrogen for HFCEV. In 2023, the competition for Europe and Africa was held in Nogaro, France. The vehicles must pass ten laps (approximately 16 km) in 39 min. The map and elevation of the circuit can be seen in Figure 1.
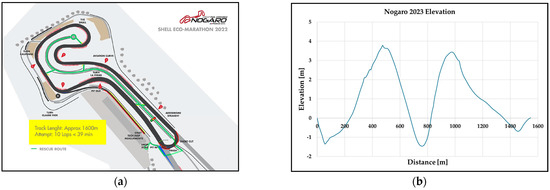
Figure 1.
Nogaro circuit map (a) and track elevation (b) for Shelle-marathon Europe and Africa 2022/2023.
The Technical University of Sofia participated in the Urban Concept category driven by a hydrogen fuel cell, with the team named TUS Team. In the hydrogen category, all the energy to move the vehicle must be produced by the fuel cell while the hydrogen is stored as a compressed gas under 200 bars in a 1 L bottle. The fuel cell vehicles could be designed in the hybrid propulsion scheme as only supercapacitors could be used for energy storage. When supercapacitors are used, their voltage at the finish line must be at least equal or higher to the voltage registered on the start line. All the vehicles must be equipped with an accessory battery in order to power the emergency circuit and accessories. From 2023, the energy flowing from the accessory battery is recorded and then added to the result as equivalent hydrogen consumption. Hydrogen consumption is measured by means of a thermal flow meter as the team result is calculated in the form of distance that could be passed by the vehicle with one cubic meter of hydrogen. The best result achieved in the 2023 competition was 164.5 km/m3, in which the team placed in the fifth position in the category. The vehicle photo is shown in Figure 2.
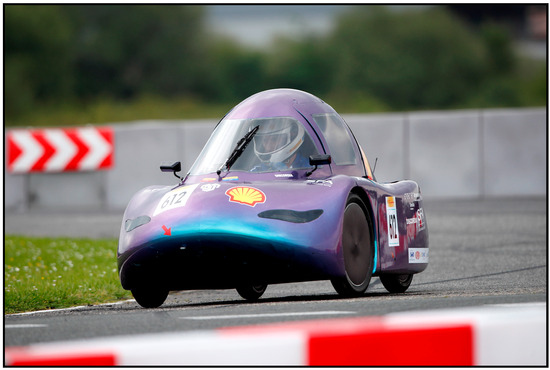
Figure 2.
TUS Team vehicle on the track in Nogaro, France during Shell eco-marathon Europe and Africa 2023.
3. Vehicle Modeling
In order to evaluate the fuel cell energy demand, several models need to be defined. Firstly, the vehicle traction energy needs to be evaluated taking into consideration the wheel torque, rolling resistance energy, aerodynamic resistance energy, slope/grade resistance energy, and mass parameters of the vehicle. This model is also known as a vehicle longitudinal dynamic model. Secondly, the bases of the wheel torque demand the models that estimate the efficiency of the powertrain elements such as traction motors, motor controllers, and DC/DC converters need to be determined. It was considered that the whole traction energy comes from the fuel cell electrical output, and it is simultaneously produced by the electrochemical reaction in the fuel cell. It means that no hybrid scheme was considered, which exactly corresponds to the vehicle set up for the competition in 2023.
3.1. Vehicle Longitudinal Dynamic Model
In this model, the vehicle is considered as a solid body that is moving only in the driving direction with an acceleration estimated on the basis of the traction force and resistance forces such as rolling resistance, aerodynamic resistance, and slope/grade resistance (Figure 3). In fact, in the corners, an additional cornering resistance appears due to tire deformation, steering angles, variation in the vehicle frontal area, and drag coefficient. However, for our vehicle, this cornering resistance was not evaluated in this study. Thus, the vehicle instantaneous longitudinal acceleration can be estimated as follows:
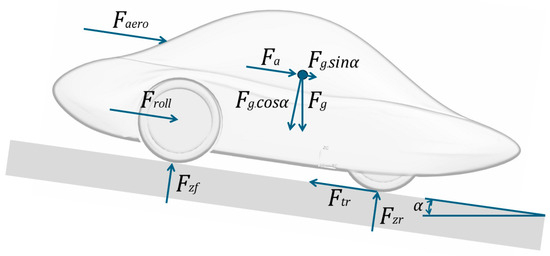
Figure 3.
Vehicle longitudinal dynamic model acting forces.
The traction force can be estimated by means of motor requested torque , transmission ratio , driveline mechanical efficiency , and wheel rolling radius . In our case, we used two DC motors to drive both rear wheels through a single stage transmission with spur gears. Thus, the vehicle traction was estimated by means of the following equation:
The rolling resistance force was estimated as a linear function of the vehicle speed using the rolling resistance coefficient , zero speed resistance , vehicle weight , and grade angle . The rolling resistance coefficient was considered much lower compared to passenger cars due to the fact that the studied vehicle is equipped with specially developed tires by Michelin that provide low energy losses.
The aerodynamic resistance force was estimated by means of the air density , frontal area , drag coefficient , and square of the vehicle speed. The vehicle frontal area and drag coefficient were numerically and experimentally determined in [17].
An equivalent vehicle mass was used in the vehicle dynamic model due to the fact that the rotating parts in the driveline—all wheels, shafts, gears and motors—also accelerate with their own angular acceleration. The inertial moments of the rotating part, taking into consideration their rotating speed, were transformed in the form of extra mass to the vehicle mass , thus
The main vehicle parameters related to the dynamic model are listed in Table 1.

Table 1.
Main vehicle technical data.
3.2. Electrical Driveline Model
The electric powertrain consists of a DC traction motor, motor controller, DC/DC converter, and PEM fuel cell. The energy produced by the fuel cell is split in two parallel directions to each rear wheel driveline. It means two DC/DC converters, motor controllers, and motors with the same technical characteristics were used. It was considered in the model that both electric powertrain directions operate in equal conditions, thus their efficiency, voltage, current, and operating points are the same at every step of the simulation.
3.2.1. DC Traction Motors
Two DC traction motors were used in the car as each drive in one of the rear wheels of the car without having any mechanical connection between them or torque/speed synchronization. Each motor is controlled by an individual motor controller that operates in the torque control model. Thus, both motors obtain the same torque demand from their controllers. In this study, we used the motors produced by Maxon, series RE65, operating at 48V nominal voltage, and sized for 250 W nominal power.
A single motor torque was estimated as follows:
where is the motor torque constant, is the motor torque, and is the idle motor current.
A single motor electric power was estimated on the basis of mechanical power and motor efficiency as follows:
Thus, the motor efficiency needs to be estimated by the following correlation:
where the motor speed is the motor speed, is the friction torque, and is the motor voltage. Here, the actual motor speed was estimated as follows:
where is the moto speed constant, is the speed/torque constant.
The main motor’s technical parameters are listed in Table 2. The index N is related to the motor nominal parameters.
Table 2.
Maxon RE 65 250W main technical data.
3.2.2. Motor Controller and DC/DC Converter Models
Each wheel motor was controlled by means of an individual motor controller ESCON 70/10, which is a four quadrant servocontroller produced by Maxon, Sachseln, Switzerland. The input voltage of the motor controllers is limited to 70 volts while the continuous current is limited to 10 A. In our case, the motors were operated in torque control mode which means the constant current mode of the motor controller. The requested torque was sent to the controller by an analog input signal 0–5 V moderated by the accelerator pedal. Due to the fact that, during the competition the accelerator pedal was operated in on/off mode, the motor torque was constant in the acceleration phase equal to the predefined value in the motor controller. According to the specification, in this operating mode the motor controller operates at approximately efficiency. For that reason, we chose in our simulation to work with a constant efficiency accounted to 98%.
In order to provide a constant voltage in the motor controller bus lines, we used two DC/DC converters operated in parallel and which powered each rear wheel motor controller. The converters are manufactured by Analog Devices model DC2456A. They operated in constant voltage mode as a boost converter providing output voltage of 48V. Due to the used synchronous technology with high switching frequency, the efficiency of these converters is high and slightly varying with the output current. Thus, we consider DC/DC converters to operate with constant efficiency accounted to 98%.
Taking into account the motor controller’s efficiencies and DC/DC converters efficiencies , the fuel cell output power that needs to power the electrical propulsion was estimated as follows:
3.2.3. Fuel Cell Model
The fuel cell that was used is proton exchange membrane fuel cell (PEMFC) manufactured by Horizon (H-1000XP). It is an open cathode PEMFC with air cooling. The nominal output power of the fuel cell is 1 kW. The stack consists of 50 cells in parallel providing 48V nominal voltage while the output current is limited to 33A. The main fuel cell data are listed in Table 3.
Table 3.
Horizon H-1000XP fuel cell main technical data.
The fuel cell characteristics highly depend on the environmental conditions but also on their state of health. Thus, the fuel cell was experimentally tested on steady operating mode. As a result, the fuel consumption was determined as a function of the output power, as is shown in Figure 4. Then, the experimental data were interpolated in order to determine a function to be further used for hydrogen consumption calculation in our numerical simulations. The function is also shown in Figure 4.
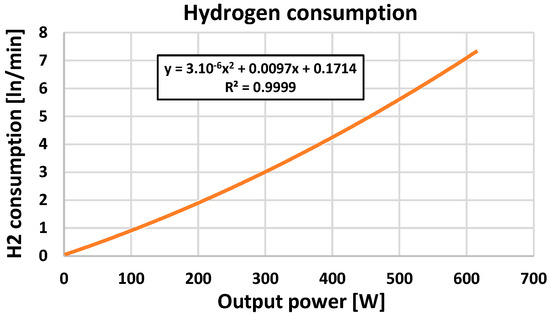
Figure 4.
Fuel cell hydrogen consumption vs. output power.
4. Experimental Set-Up
In order to study the performance of the fuel cell, an experimental test bench was developed. It consists of a fuel cell including all periphery, hydrogen cylinder, pressure regulator, hydrogen fuel flow meter (Vögtlin GSM-C9SS), programable electronic load (TTi LD400P), current sensors, voltage sensors, and data acquisition system (NI PCI-6221). The test bench schematic is shown in Figure 5. The fuel cell electrical output was directly connected to the electronic load as the current, voltage, and hydrogen consumption were instantaneously recorded during the tests. The fuel cell electric power was then estimated in real time on the basis of the current and voltage data. The instantaneous power demand was determined by the electronic load which was controlled through an analog input signal generated from the data acquisition system. The instantaneous power was imported from an excel file as the values were previously estimated during the numerical simulation for each of the studied cases.
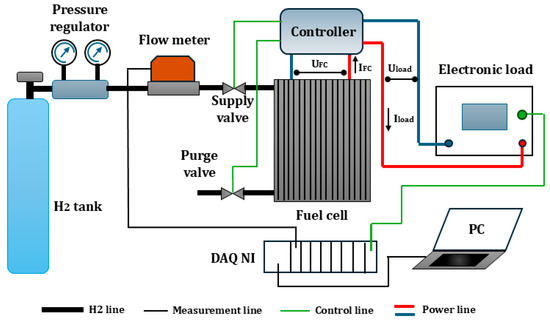
Figure 5.
Fuel cell test bench schematic diagram.
Due to the fact that the simulation model allowed us to estimate the instantaneous electric power of the fuel cell, we did not install the other components such as DC/DC converters, motor controllers, and motors on the test bench. In this way we experimentally studied the fuel cell performances without having a complex experimental test bench that needs mechanical parts and torque measurement of the motors. In order to eliminate the impact of the thermal state of the fuel cell on the results, we experimentally tested the fuel cell in three consecutive laps as the average results were taken into account.
5. Results
The results regarding the fuel cell power demand, hydrogen consumption, vehicle speed, etc., over a single lap of the vehicle on the Nogaro track with the configuration for the Shell eco-marathon Europe 2023 competition were first studied by means of numerical simulations. Secondly, the estimated value of fuel cell instantaneous power demand over a single lap was used to control the electronic load in the experimental tests set-up. Finally, the results regarding the hydrogen consumption achieved in the simulations and experimental tests were compared.
The basic simulation was carried out using the typical driving strategy for our team and the vehicle data from the Shell eco-marathon Europe 2023 competition. It consists of three acceleration phases and the driver weigh of 78 kg, which is heavier by 8 kg than the minimum. Then, after analyzing the data, we tried to minimize the energy consumption by changing the driving strategy and gear ratio as the reference driver’s weight of 70 kg was used. Thus, three cases were numerically simulated and experimentally tested. The main data used in the cases are summarized in Table 4.
Table 4.
Main simulation data.
5.1. Results from Numerical Simulations
The numerical simulation was carried out by means of a developed computational algorithm in Excel. In fact, it is a numerical integration of Equation 1 with a fixed time step of discretization over a track distance of 1550 m. The simulation was performed for three studied cases. As a result, the instantaneous vehicle speed, motor torque, motor efficiency, fuel cell power demand, and hydrogen consumption were estimated. Moreover, the integral value of hydrogen consumption and vehicle energy consumption were estimated. The results are presented in Figure 6, Figure 7 and Figure 8.
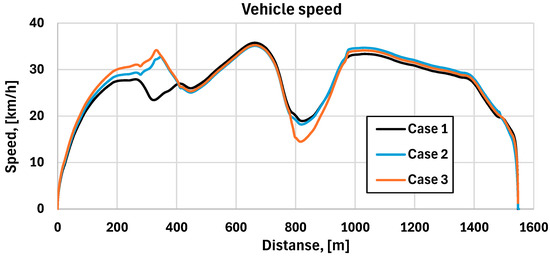
Figure 6.
Vehicle speed vs. time over a single lap.
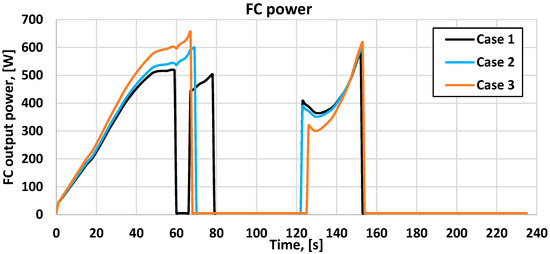
Figure 7.
Instantaneous fuel cell power demand vs. time over a single lap.
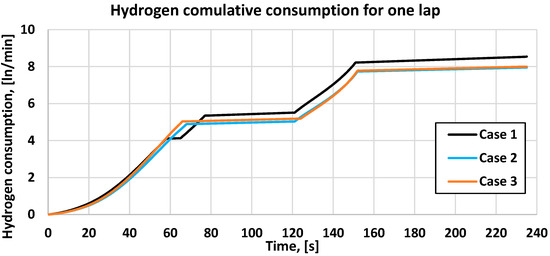
Figure 8.
Cumulative hydrogen consumption vs. time over a single lap.
Due to the Shell eco-marathon regulation for the Urban Concept category, all the vehicles must stop at the finish line each lap. For that reason, the driving strategy starts with the acceleration phase from zero speed and finishes with the braking phase at the end of the lap. Each lap must be passed at a maximum 236 s in order to comply with the time rules. In our simulations, we used the same traction motors with the same maximum torque as we suppose that at each acceleration phase both motors operate in constant torque mode defined by the motor current accounted to 7 A. In these predefined conditions, the vehicle accelerates faster in Case 3 due to a lower weight and higher gear ratio. It allows the vehicle speed to reduce at the beginning of the second slope of the track; thus, starting the second acceleration phase at lower speed with lower fuel cell power demand. As a result of higher wheel torque, Case 3 offers the shortest acceleration time over the whole lap. The maximum vehicle speed was approximately the same for all cases as it was achieved in the downhill section. In Case 1, the acceleration at the beginning of the lap was separated in the phases, including a short coasting phase. The higher vehicle mass, together with extended acceleration in Case 1, led to lower speed on the first slope and needed to accelerate the vehicle on the second slope earlier from a higher speed. In terms of fuel cell power demand, Case 3 was the most demanding, as the maximum demanded power accounted to 656.5 W, while the less demanding driving strategy was Case 1 with the maximum power demand of 583.9 W. In order to evaluate the vehicle energy efficiency and to choose the driving strategy that minimizes hydrogen consumption, the cumulative hydrogen consumption was estimated and plotted in Figure 8.
5.2. Results from Experimental Test
The experimental test was conducted for each studied case over a single lap. The instantaneous electric power demand was determined by means of an electronic load reading the value determined in numerical simulation (Figure 7). The fuel cell output is directly connected to the electronic load. However, the fuel cell has some electrical losses due to powering the controller, cooling fans, hydrogen supply, and purge valve. For this reason, both electronic load power demand and fuel cell stack output power were studied during the experiments. It allows us to study the fuel cell efficiency, taking into consideration auxiliary losses. The instantaneous hydrogen consumption was also recorded in order to estimate cumulative consumption per lap. The electric power was estimated based on the measured voltage and current on the stack output and electronic load input, respectively. The results for all cases are presented in Figure 9, Figure 10 and Figure 11.
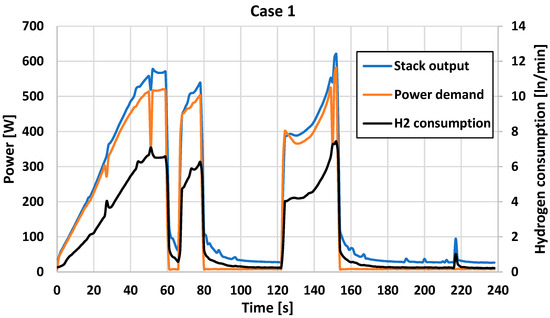
Figure 9.
Fuel cell output power and hydrogen consumption for a single lap (Case 1).
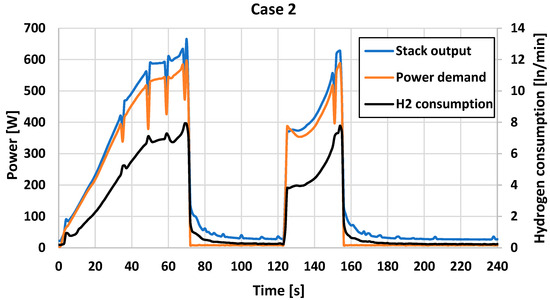
Figure 10.
Fuel cell output power and hydrogen consumption for a single lap (Case 2).
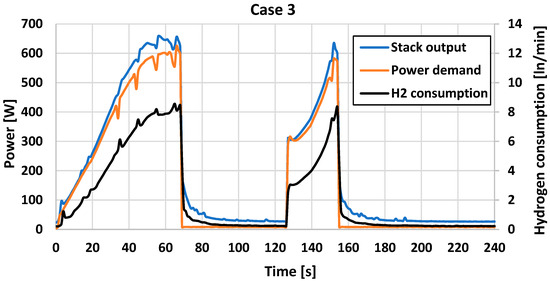
Figure 11.
Fuel cell output power and hydrogen consumption for a single lap (Case 3).
The experimental results revealed that the fuel cell power measured directly on the stack output was not as smooth as the theoretical power demand by the electronic load. As a result, it also affected the consumed power by the load. The first reason for that is the fact that the purge valve opens based on the predefined logic in the fuel cell controller. It led to spikes in instantaneous hydrogen consumption. Thus, it reduced the fuel cell voltage and power as well. The second reason for fuel cell power deviation from predefined values was the fact that, in parallel to the stack output, there was a supercapacitor which supported the output voltage drop. The effect of the supercapacitors is evident in the costing phase of vehicle operation immediately after turning off the load power demand. At that moment, the fuel cell continues to charge the supercapacitors which led to higher power production that was needed for auxiliaries. However, this stored energy in the supercapacitors supports the fuel cell in the acceleration phases, which cannot be seen from this analysis, but it can explain the reason of quite similar power demand and stack power at the beginning of the first acceleration phase. Once the supercapacitor was fully charged near the end of the lap, we could measure the idle fuel cell power, which accounted to 26 W. Comparing the three cases, the driving strategy in Case 1, which offered the lowest maximum power demand from the fuel cell based on simulation, led to similar fuel cell output power peak to the other cases at the end of the final acceleration phase. At that moment, the fuel cell stack power varied within the range of 620.3 W to 634.5 W. In the first acceleration phase of Case 1, we measured lower fuel cell output power and instantaneous hydrogen consumption due to the shortest acceleration time and lower vehicle speed. Despite the fact that the strategy in Case 2 led to a higher power peak in the first acceleration phase theoretically, in the experimental test the peak power for Case 2 and Case 3 are quite similar. The stack output power peak varies from 658.4 W to 665.3 W, as the higher values corresponded to Case 2.
However, the parameter that is the most important in terms of energy efficiency is cumulative hydrogen consumption per lap. For both the numerical simulation and experimental test, this value was estimated by means of integrated instantaneous hydrogen consumption over time. The results are summarized in Table 5.
Table 5.
Hydrogen consumption per lap.
6. Conclusions
The vehicle energy consumption optimization is a complex task even in the case of predefined driving conditions typical for energy efficient vehicle student’s competitions but also in passenger cars’ homologation cycles such as WLTP, NEDC, FTP, etc. This study deals with hydrogen consumption minimization of an Urban Concept car developed for the Shell eco-marathon competition, the case for the Nogaro circuit configuration from 2023. An approach included a numerical simulation over a single lap and experimental study on the fuel cell loaded with the value estimated from the numerical simulation was used. This approach revealed that the experimental study of vehicles in real driving conditions could be successfully replaced with experimental tests on an electric test bench using the instantaneous power demand to the fuel cell estimated by an appropriate vehicle dynamic model, implementing the driving strategy. It allows experimental verification of the different driving strategies but also studies the impact of electric propulsion elements such as motors, converters, inverters, and gear ration without their implementation to the test bench. Moreover, the driving strategy and vehicle set-up could be optimized to the new tracks when, typically, access to the track before the competition is prohibited.
In this study, three cases were evaluated, each corresponding to different driving strategies and vehicle set-up. Case 1 corresponds to the driver’s weight higher than the minimum value including three acceleration phases. Both Case 2 and Case 3 are typical for the driver’s weight on the lower limit of 70 kg and two acceleration phases with only differences in vehicle set-up by variation in the gear ratio. The numerical simulation clearly revealed that lowering the vehicle weight by 8 kg or 4.5% and reducing the acceleration time led to lower energy demand and hydrogen consumption. The lower cumulative hydrogen consumption was estimated for Case 2 of 7.95 ln/lap which is 6.9% lower than Case 1. Case 3 offers quite similar consumption to Case 2, and accounted to 7.99 ln/min. The experimental results revealed higher hydrogen consumption for two of studied cases (Case 2 and Case 3) compared to numerical results even though the same instantaneous power demand from the simulation was applied to the fuel cell. It could be explained with the fact that in real dynamic operation the fuel cell performance is different from the steady state operation. Moreover, thermal management and working environment are different from study to study but also in real operation the fuel cell purge valve turned on from time to time, especially at higher power demand, that ejects the non-used hydrogen to the atmosphere. Additionally, the fuel cell controller is equipped with a short circuit unit that also affects the fuel cell operation turning on/off periodically. All these facts together have an important impact on the cases where the maximum instantaneous power has higher values—Case 2 and Case 3. Due to that fact, the measured hydrogen consumption in the experimental tests is higher for Case 2 and Case 3 compared to Case 1. The higher consumption observed for Case 3 accounted to 8.74 ln/lap or 4.3% higher than Case 1.
Based on both numerical and experimental studies, further optimization needs to be performed combining the vehicle minimum weights with the three acceleration phases that were used in Case 1. Moreover, a comprehensive study of fuel cell performance needs to be conducted in dynamic operation taking into consideration the thermal management and stack purge strategy.
Author Contributions
Conceptualization, P.P. and O.O.; methodology, P.P.; software, R.R.; validation, P.P., O.O. and R.R.; formal analysis, O.O.; investigation, R.R.; resources, R.R.; data curation, O.O.; writing—original draft preparation, P.P.; writing—review and editing, R.R.; visualization, R.R.; supervision, P.P.; project administration, P.P.; funding acquisition, P.P. All authors have read and agreed to the published version of the manuscript.
Funding
This work was funded by Technical University of Sofia, Scientific and Research Center within the Project №241ИП0008-04 “Fuel cell/supercapacitor hybrid propulsion with model based predictive control and anode off gases recirculation”.
Institutional Review Board Statement
Not applicable.
Informed Consent Statement
Not applicable.
Data Availability Statement
Data is contained within the article.
Acknowledgments
This work was supported by European Regional Development Fund under “Research Innovation and Digitization for Smart Transformation” program 2021–2027 under the Project BG16RFPR002-1.014-0006 “National Centre of Excellence Mechatronics and Clean Technologies” by using the test facility of laboratory “Mechatronic technologies for green transport”.
Conflicts of Interest
The authors declare no conflicts of interest. The funders had no role in the design of the study; in the collection, analyses, or interpretation of data; in the writing of the manuscript; or in the decision to publish the results.
References
- European Parliament. Greenhouse Gas Emissions by Country and Sector. Available online: https://www.europarl.europa.eu/topics/en/article/20180301STO98928/greenhouse-gas-emissions-by-country-and-sector-infographic (accessed on 16 July 2025).
- European Parliament. CO2 Emissions from Cars: Facts and Figures. Available online: https://www.europarl.europa.eu/topics/en/article/20190313STO31218/co2-emissions-from-cars-facts-and-figures-infographics (accessed on 16 July 2025).
- Dimitrov, E.; Peychev, M.; Tashev, A. Study of the Hydrogen Influence on the Combustion Parameters of Diesel Engine. Int. J. Hydrogen Energy 2025, 123, 219–230. [Google Scholar] [CrossRef]
- Xie, F.; Liang, Z.; Cui, B.; Guo, W.; Li, X.; Jiang, B.; Jin, Z. Spray-to-Combustion Interaction in Hydrogen Direct Injection Engines: Effects of Injector Structure and Injection Pressure. Energy 2025, 333, 137514. [Google Scholar] [CrossRef]
- Gao, N.; Geng, Z.; Zhao, W.; Geng, L.; Dong, F.; Huang, D. Review on the Combustion and Emission Characteristics of Hydrogen Engine. Int. J. Hydrogen Energy 2025, 143, 121–146. [Google Scholar] [CrossRef]
- Günaydın, Ö.F.; Topçu, S.; Aksoy, A. Hydrogen Fuel Cell Vehicles: Overview and Current Status of Hydrogen Mobility. Int. J. Hydrogen Energy 2025, 142, 918–936. [Google Scholar] [CrossRef]
- Karaca, A.E.; Dincer, I. Comparative Assessment of Various Passenger Vehicles with Alternative Fuels Including Hydrogen. Sustain. Energy Technol. Assess. 2025, 80, 104386. [Google Scholar] [CrossRef]
- Oladosu, T.L.; Pasupuleti, J.; Kiong, T.S.; Koh, S.P.J.; Yusaf, T. Energy Management Strategies, Control Systems, and Artificial Intelligence-Based Algorithms Development for Hydrogen Fuel Cell-Powered Vehicles: A Review. Int. J. Hydrogen Energy 2024, 61, 1380–1404. [Google Scholar] [CrossRef]
- Li, M.; Yang, D.; Tian, J.; Fan, Y.; Pan, T. An Adaptive Fuzzy Energy Management Strategy for Fuel Cell Hybrid Vehicles Considering Soft Classification for Driving Pattern. Int. J. Hydrogen Energy 2025, 138, 273–285. [Google Scholar] [CrossRef]
- Deng, L.; Radzi, M.A.M.; Shafie, S.; Hassan, M.K. Optimizing Energy Management in Fuel Cell Hybrid Electric Vehicles Using Fuzzy Logic Control with State Machine Approach: Enhancing SOC Stability and Fuel Economy. J. Eng. Res. 2025, 13, 3429–3440. [Google Scholar] [CrossRef]
- Luo, X.; Chung, H.S.H. EMS for Hydrogen Fuel Cell Electric Vehicles Based on Improved Fuzzy Control. Energy Convers. Manag. X 2025, 27, 101093. [Google Scholar] [CrossRef]
- Ma, Y.; Qi, B.; Wang, S.; Ma, Q.; Sui, Z.; Gao, J. Real-Time Energy Management of Fuel Cell Hybrid Electric Vehicle Based on Variable Horizon Velocity Prediction Considering Power Source Durability. Energy 2025, 315, 134359. [Google Scholar] [CrossRef]
- Pavlov, N.; Gigov, B.; Stefanova-Pavlova, M.; Dimitrova, Z. Adaptive Predictive Energy Management Strategy Example for Electric Vehicle Long Distance Trip. In Systems, Software and Services Process Improvement; Yilmaz, M., Niemann, J., Clarke, P., Messnarz, R., Eds.; Springer International Publishing: Cham, Switzerland, 2020; pp. 76–91. [Google Scholar]
- Pusztai, Z.; Kőrös, P.; Szauter, F.; Friedler, F. Vehicle Model-Based Driving Strategy Optimization for Lightweight Vehicle. Energies 2022, 15, 3631. [Google Scholar] [CrossRef]
- Stabile, P.; Ballo, F.; Mastinu, G.; Gobbi, M. An Ultra-Efficient Lightweight Electric Vehicle—Power Demand Analysis to Enable Lightweight Construction. Energies 2021, 14, 766. [Google Scholar] [CrossRef]
- Olivier, J.C.; Wasselynck, G.; Chevalier, S.; Auvity, B.; Josset, C.; Trichet, D.; Squadrito, G.; Bernard, N. Multiphysics Modeling and Optimization of the Driving Strategy of a Light Duty Fuel Cell Vehicle. Int. J. Hydrogen Energy 2017, 42, 26943–26955. [Google Scholar] [CrossRef]
- Dobrev, I.; Massouh, F.; Danlos, A.; Todorov, M.; Punov, P. Experimental and Numerical Study of the Flow Field around a Small Car. In MATEC Web of Conferences; EDP Sciences: Les Ulis, France, 2017; Volume 133. [Google Scholar]


Disclaimer/Publisher’s Note: The statements, opinions and data contained in all publications are solely those of the individual author(s) and contributor(s) and not of MDPI and/or the editor(s). MDPI and/or the editor(s) disclaim responsibility for any injury to people or property resulting from any ideas, methods, instructions or products referred to in the content. |
© 2026 by the authors. Licensee MDPI, Basel, Switzerland. This article is an open access article distributed under the terms and conditions of the Creative Commons Attribution (CC BY) license.