Proceeding Paper

Pore Network Modelling of Porous Media for Carbon Dioxide Sequestration: A Case Study of Pakistan †

1
Department of Mechanical Engineering, International Islamic University, Islamabad 46000, Pakistan
2
Department of Mechanical Engineering, University of Engineering and Technology, Taxila 47050, Pakistan
*
Author to whom correspondence should be addressed.
Presented at the 1st International Conference on Energy, Power and Environment, Gujrat, Pakistan, 11–12 November 2021.
Eng. Proc. 2021, 12(1), 64; https://doi.org/10.3390/engproc2021012064
Published: 31 December 2021
(This article belongs to the Proceedings of The 1st International Conference on Energy, Power and Environment)

Abstract

:
Carbon dioxide (CO2) storage in natural rocks is an important strategy for reducing and capturing greenhouse gas emissions in the atmosphere. The amount of CO2 stored in a natural reservoir such as natural rocks is the major challenge for any economically viable CO2 storage. The intricate nature of the porous media and the estimates of the replacement of residing aqueous media with the invading CO2 is the challenge. The current study uses MATLAB to construct a similar porous network model for simulation of complex porous storage. The model is designed to mimic the overall properties of the natural porous media in terms of permeability, porosity and inter-pore connectivity. Here a dynamic pore network is simulated and validated, firstly in the case of a porous network with one fluid invading empty network. Subsequently, the simulations for an invading fluid (CO2) capturing the porous media with filled aqueous brine solution are also carried out in a dynamic fashion. This resembles the actual storage process of CO2 sequestration in natural rocks. While the sensitivity analysis suggests that the differential pressure and porosity have a direct effect on saturation, increasing differential pressure or porosity increases the saturation of CO2 storage. The results for typically occurring rocks in Pakistan are also studies and related with the findings of the study.

1. Introduction

Carbon sequestration in brine-filled reservoirs is a promising method for lowering greenhouse gas emissions in the atmosphere [1]. However, estimating the quantity of CO2 that can be trapped in a particular reservoir and predicting long-term storage stability remain difficult.
An analysis of Pakistan’s existing and future CCS potential is offered, suggesting that this technology has a lot of promise for capturing CO2 emissions. Economic and policy hurdles should be removed as the key challenges to the ongoing development and implementation of CCS technology in Pakistan [2]. CO2 emissions from the energy sector in Pakistan are estimated to increase rapidly as indicated in [3]. Pakistan has 1.6 Gt CO2 storage capacity in gas fields and saline aquifers in the Indus region, particularly in the lower Indus and Postwar Basins40. More crucially, Pakistan’s location of CO2 emission sources and prospective storage sites are an excellent match [4].
The interaction of buoyant, viscous, and capillary forces has an impact on the process. As a result, depending on the proportional influence of the three forces outlined above, distinct saturation patterns emerged [5,6,7]. The pressure difference between wetting and non-wetting fluids at an interface is known as capillary pressure, or Pcap. For a tubular throat, a radius of throat (rthroat) with a circular cross section, this is given by Young-Laplace equation
P c a p = γ c o s θ d t h r o t
where γ is the surface tension and dthroat is the diameter of throat. Equation (1) is influenced by the porous structure’s geometry as well as contact angle.
Pore network modelling (PNM) has been widely employed in geological formations to characterize the flow of single or multiphase fluids [8,9]. This method makes use of a porous structure, which is essentially a network of distinct pores joined by uniform throats of pores set on regular lattice [8,10] or on an irregular spaced lattice of actual porous rock [11]. The amount of material necessary for representative modelling determines the size of the simulation domain. Blunt and Scher [12] carried out a thorough investigation of the factors that influence multiphase flow in porous medium. Aker et al [8] invetigated 2D pore networks with a variety of viscosity ratios and capillary numbers, and displayed the resulted saturation patterns. Ferer et al. [9] used similar model for simulations at conditions of carbon storage. We provide a set of 2D PNM calculations of model networks made of randomely distributed radius of throats, each with a specific contact angle, to establish a framework for pore network simulations involving wettability [13].

2. Method and Materials

2.1. Porous Medium Geometry

The porous media is a pore network made up of square lattices of tubes that are evenly spaced. Periodic boundary conditions are imposed horizontally as the liquid flows from left to right. The pressure across the lattice is defined by the pressure differential between the first and last columns.
The throats are cylindrical and of equal length, with a radius r assigned at random interval (λ1, λ2) d to each throat. The randomness of an ordinary porous media is represented by randomization of radii, and radii width distribution is defined by λ1, and λ2. The range is [0.05, 1.0] mm. (Aker et al. [8]). The other parameters are given in the Table 1.

2.2. Flow of Fluid across Network

The system is initially full of defending fluid with viscosity µD. The invading fluid of viscosity µI is inserted at a steady rate from the left. Let the invading fluid be non-wetting and the defending fluid be wetting.We will handle the liquids as incompressible.
For incompressible fluids, the conservation of volume flux governs the flow, so that the summation of the flowrates will be equal to zero, Mathematically,
q i j = 0
where i   and j represents pores of the pore network.
This results a system with n number of equations and n number of unknowns for pore pressures.
D i j   P j = B i
where indices i, j indicates the internal nodes, D i j are elements of conductance matrix D (Batrouni and Hansen, [14])
P j = ( D 1 ) i j × B i
The Conjugate gradient method (Batrouni and Hasnen [14]) is used to solve this equation.

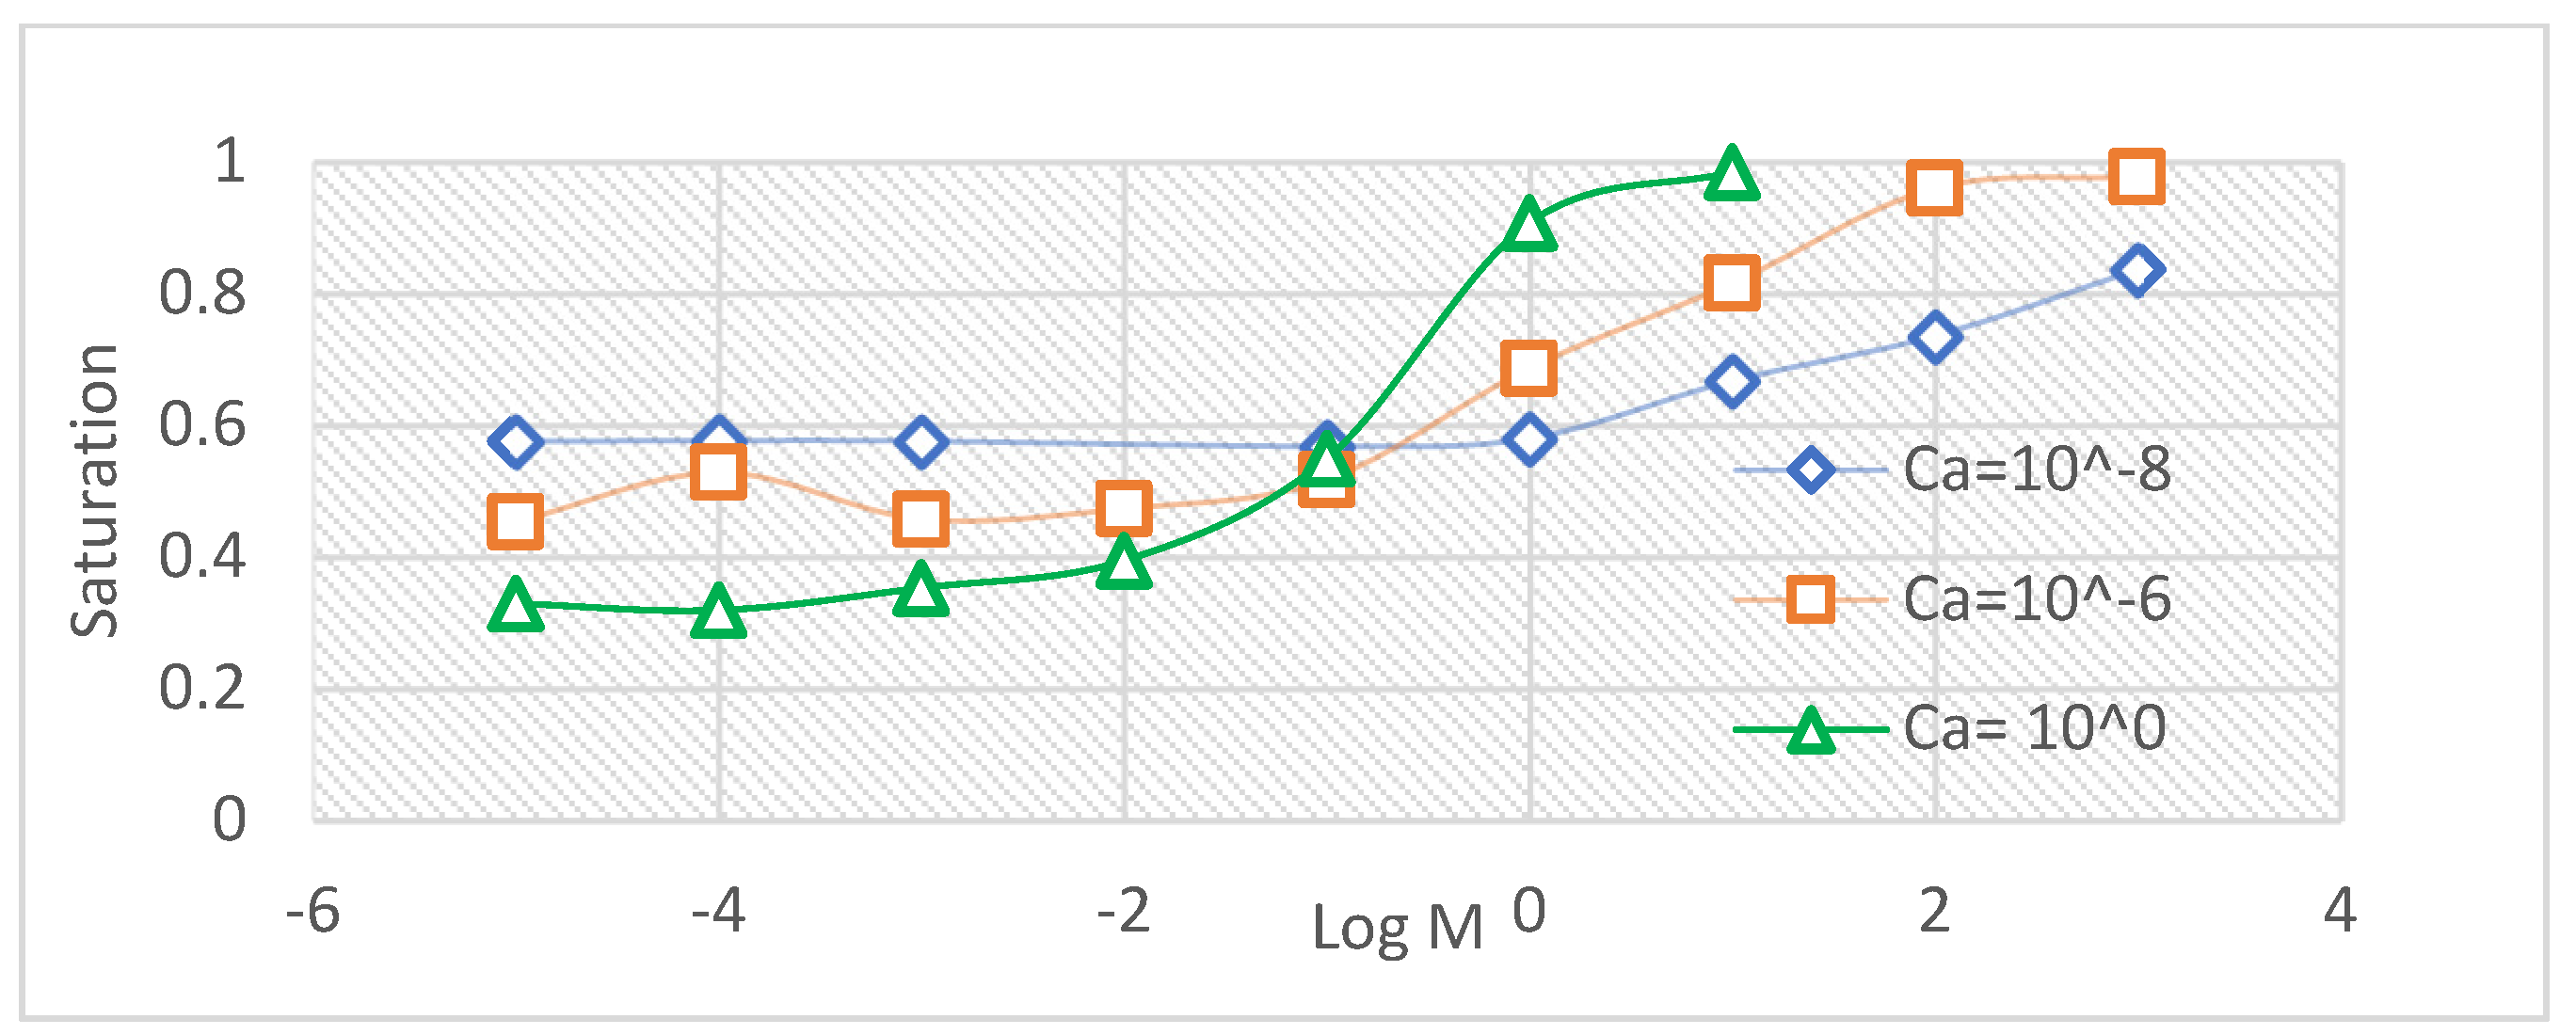
3. Results and Discussion

The dynamic (transient) pore network modelling was characterized for the sequestration of carbon dioxide CO2 in natural rocks to reduce greenhouse effect. In order to find the saturation behavior of the model, the network of (50 × 50) is realized in MATLAB software. CO2 as invading fluid (non-wetting fluid) and brine solution as defending fluid (wetting fluid). The defending fluid (brine solution in this case) is already present in natural rocks. The defending fluid is displaced by the invading fluid CO2, in order to reduce greenhouse gas for better environmental effects. Simulations were run over a variety of log M viscosity ratio (ranges from −5 to 3) and at three different capillary number Ca (10−8, 10−6 and 100). The final saturation was established in all situations at the model’s breakthrough. To reach breakthrough, the 2D flow network usually takes less than 300 s to compute.
Simulations were started with a preliminary analysis of the saturation behaviour for 2D flow networks with a single contact angle θ (cosθ = 1), over a variety of viscosity ratios and capillary numbers. The characterization of 2D network is shown in Figure 1.
It is evident from the Figure 1, that at lower viscosity ratio and lower capillary numbers, saturation of CO2 is almost constant and less than 60%. However, at higher viscosity ratio, the saturation percentage is increasing and becomes 80% at viscosity ratio log M (3) even at lower flowrates. The saturation point is almost constant at lower viscosity ratio and becomes gradually increasing from 60% to 80% at higher viscosity ratios.By increasing the capillary number, the saturation is lower at lower values of viscosity and gradually changing its value by increasing the viscosity ratio. However, at higher values of viscosity ratio, the saturation becomes increasing at higher rate than at lower capillary numbers. At lower values of viscosity ratio log M (−6 to −1), the saturation percentage increases from 32% to 58%, and at higher values of viscosity ratio log M (0–1), the saturation percentage increases from 58% to 98%.
From the above discussion, it is clear that decreasing the viscosity of defending fluid or increasing the viscosity of invading fluid and increasing the value of capillary numbers, the saturation of the network becomes higher.

Estimation of CO2 Quantity

The estimation of quantity of CO2 to be stored in the natural rocks is dependent on the volume of the rocks. Volume has been calculated and a saturated volume (per saturation of the network) has been considered for CO2 storage. The calculation is based on the porosity of 17% and permeability of 10 mD, and other conditions are same as mentioned in Table 2. Following table shows the quantity of CO2 that can be stored.

4. Conclusions

For the description of drainage simulations of structured porous media, a 2D pore network was presented. This means the invasion of supercritical CO2 into a brine-filled geological formation for sequestration of carbon dioxide. Using the saturation diagram over a range of viscosity ratio and capillary numbers, the network model was characterized. Porosity and permeability of the network plays an important role in the saturation. Higher porosity and permeability led to higher saturation.

Author Contributions

All authors contributed equally to this work. All authors have read and agreed to the published version of the manuscript.

Funding

This research received no external funding.

Data Availability Statement

Not applicable.

Conflicts of Interest

The authors declare no conflict of interest.

References

  1. Ellis, J.S.; Bazylak, A. Dynamic pore network model of surface heterogeneity in brine-filled porous media for carbon sequestration. Phys. Chem. Chem. Phys. 2012, 14, 8382–8390. [Google Scholar] [CrossRef] [PubMed]
  2. Rashid, M.I.; Benhelal, E.; Rafiq, S. Reduction of greenhouse gas emissions from Gas, oil, and coal power plants in Pakistan by carbon capture and storage (CCS). Chem. Eng. Technical. 2020, 43, 1–10. [Google Scholar] [CrossRef]
  3. Shamsul, M.; Ishfaq, A. Task Force on Climate Change; Planning Commission Government of Pakistan: Islamabad, Pakistan, 2010.
  4. Holloway, S.; Garg, A.; Kapshe, M.; Deshpande, A.; Pracha, A.S.; Khan, S.R.; Mahmood, M.A.; Singh, T.N.; Kirk, K.L.; Gale, J. An assessment CO2 storage potential of subcontinent. Energy Procedia 2009, 1, 2607–2613. [Google Scholar] [CrossRef] [Green Version]
  5. Benson, S.M.; David, D.R. CO2 Sequestration in Deep Sedimentary Formations. Clay Miner. Soc. 2008, 4, 325–331. [Google Scholar] [CrossRef]
  6. Gaus, I. Role & impact of CO2–rock CO2 storage in sedimentary rocks. Int. J. Greenh. Gas Control 2010, 4, 73–89. [Google Scholar]
  7. Saadatpoor, E.; Bryant, S.L.; Sepehrnoori, K. New Trapping Mechanism in Carbon Sequestration. Transp. Porous Media 2010, 82, 3–17. [Google Scholar] [CrossRef]
  8. Aker, E.; Maloy, K.J. A Two-Dimensional Network Simulator for 2-Phase. Transp. Porous Media 1998, 32, 163–186. [Google Scholar] [CrossRef]
  9. Lecomte, F.; Broutin, P.; Lebas, E. Pore-level modeling of CO2 sequestration. In Proceedings of the 1st National Conference on Carbon Seq, Washington DC, USA, 7–10 May 2001. [Google Scholar]
  10. Li, L.; Peters, C.A.; Celia, M.A. Upscaling geochemical reaction rates. Adv. Water Resour. 2006, 29, 1351–1370. [Google Scholar] [CrossRef]
  11. Silin, D.; Tomutsa, L.; Benson, S.M.; Patzek, T.W. Microtomography and Pore-Scale Modeling. Transp. Porous Media 2011, 86, 495–515. [Google Scholar] [CrossRef] [Green Version]
  12. Blunt, M.J.; Scher, H. Pore-level modeling of wetting. Phys. Rev. E 1995, 52, 6387. [Google Scholar] [CrossRef]
  13. Al-Futais, A.; Patzek, T.W. Impact of wettability alteration on two-phase flow. Water Resour. Res. 2003, 39. [Google Scholar] [CrossRef]
  14. Perrin, C.L.; Tardy, P.M.; Sorbie, K.S.; Crawshaw, J.C. Experimental and modelling study of Newtonian’s. J. Coll Interface Sci. 2006, 295, 542–550. [Google Scholar] [CrossRef] [PubMed]
Figure 1. Saturation effects over viscosity ratio at different capillary numbers.
Engproc 12 00064 g001
Table 1. Parameters used in the simulation.
Throat Radius (mm)PorosityPermeability (mD)Differential Pressure (MPa)
0.05–10.173010
Surface Tension (γ)Contact Angle (θ)Defending Viscosity (Pa-s)Invading Viscosity
0.021 N/m3110−310−4
Table 2. Estimation of quantity of CO2 storage.
Network SizeSaturated Volume (m3)Estimation of CO2 (grams)
50 × 500.212038381.23
100 × 1000.8655508121556
150 × 150 1.96063525
200 × 2003.537356359.8
250 × 2505.4759844.4
300 × 3007.89514194
Publisher’s Note: MDPI stays neutral with regard to jurisdictional claims in published maps and institutional affiliations.

