Abstract
Ocean wave energy is an abundant and clean source of energy; however, its potential is largely untapped. Although the concept of energy harvesting from ocean waves is antiquated, the advances in wave energy conversion technologies are embryonic. In many major studies related to wave-to-wire technologies, ocean waves are considered to be regular waves with a fixed amplitude and frequency. However, the actual ocean waves are the sum of multiple frequencies that exhibit a particular sea state with a significant wave height and peak period. Therefore, in this paper, detailed modelling of the ocean waves is presented and different wave spectra are analyzed. The wave spectra will eventually be used for the generation of wave elevation time series. Those time series can be used for the wave-to-wire model-based studies for improved investigations into wave energy conversion mechanisms, mimicking the real ocean conditions.
1. Introduction
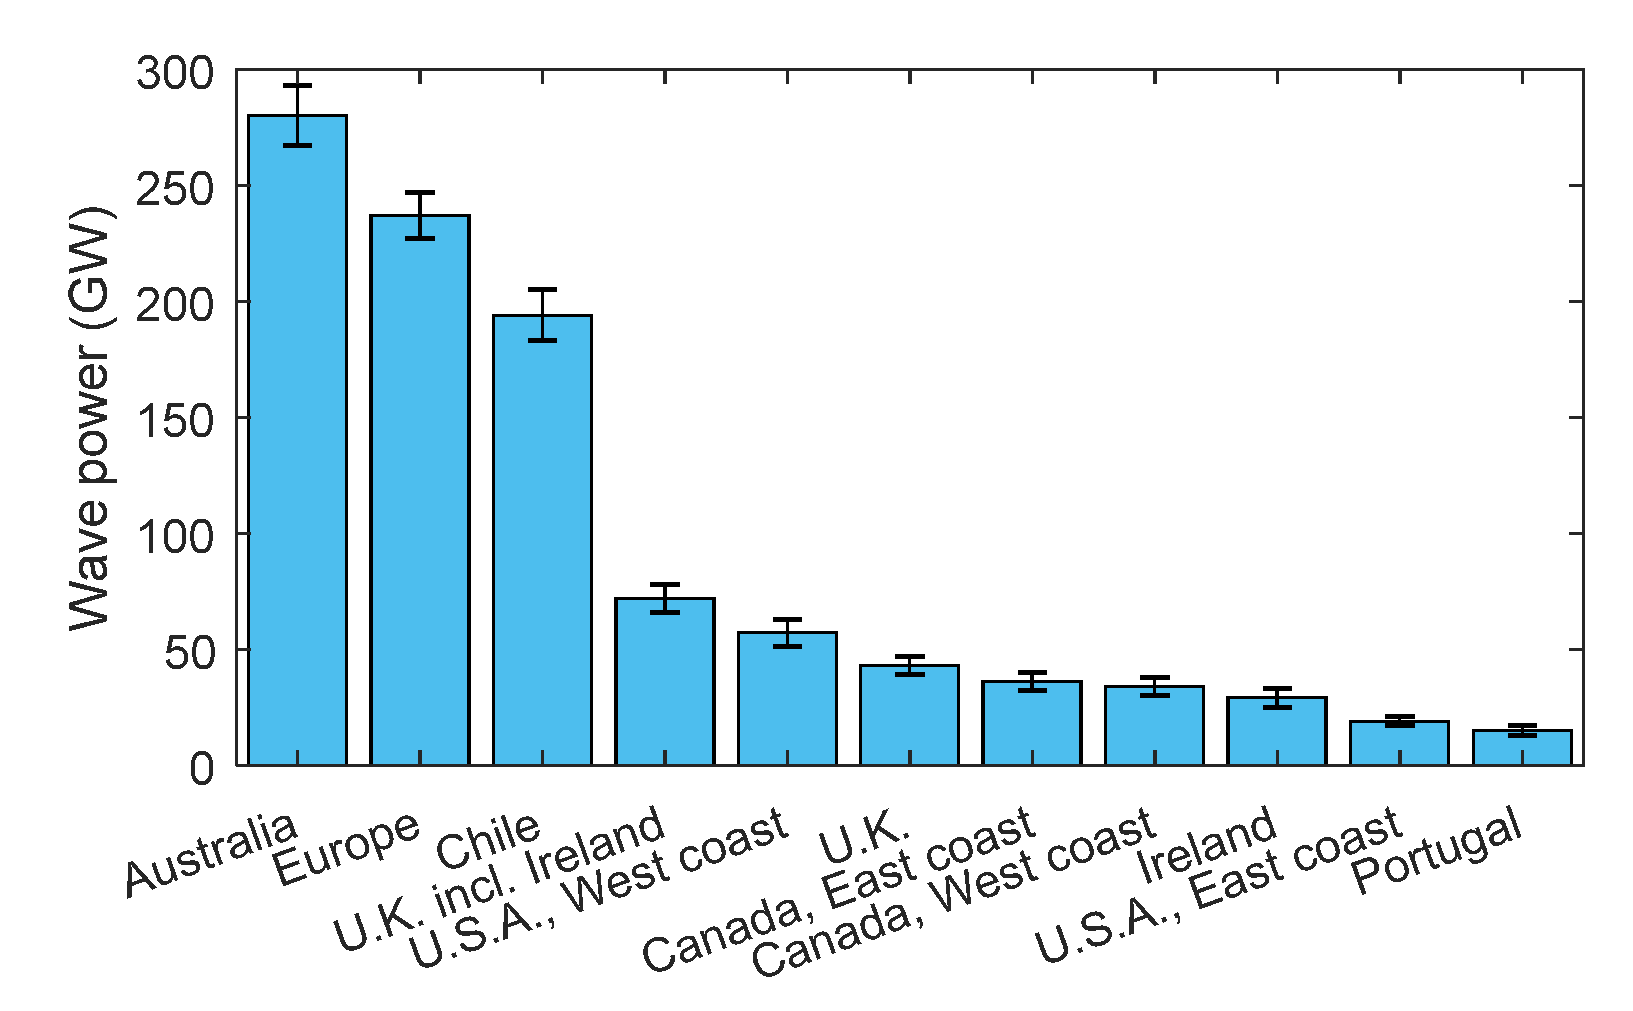
Ocean waves have huge potential to make serious contributions to renewable energy harnessing. The power potential of wave energy is around 1 TW along the coastal sites across the globe, and this potential can reach up to 10 TW when wave energy from the open ocean is also considered [1]. This energy would be enough to meet the world’s total energy demand [2]. Approximately 93,000 TWh per annum of energy can be harnessed from ocean waves [3]. A comparison of the wave power harnessed in different regions of the world is shown in Figure 1. Australia has the largest wave power system in the world [4].

Figure 1.
Estimation of wave power use in different regions of the world.
Keeping in view the enormous exploitable potential of wave energy, in this paper, detailed ocean modelling is presented and different wave spectra are analyzed. The wave elevation time series will be generated, which will represent the real wave conditions. Those time series would be very useful for the wave-to-wire model of energy harvesting [5].
2. Modelling Ocean Waves
Linear Wave Theory
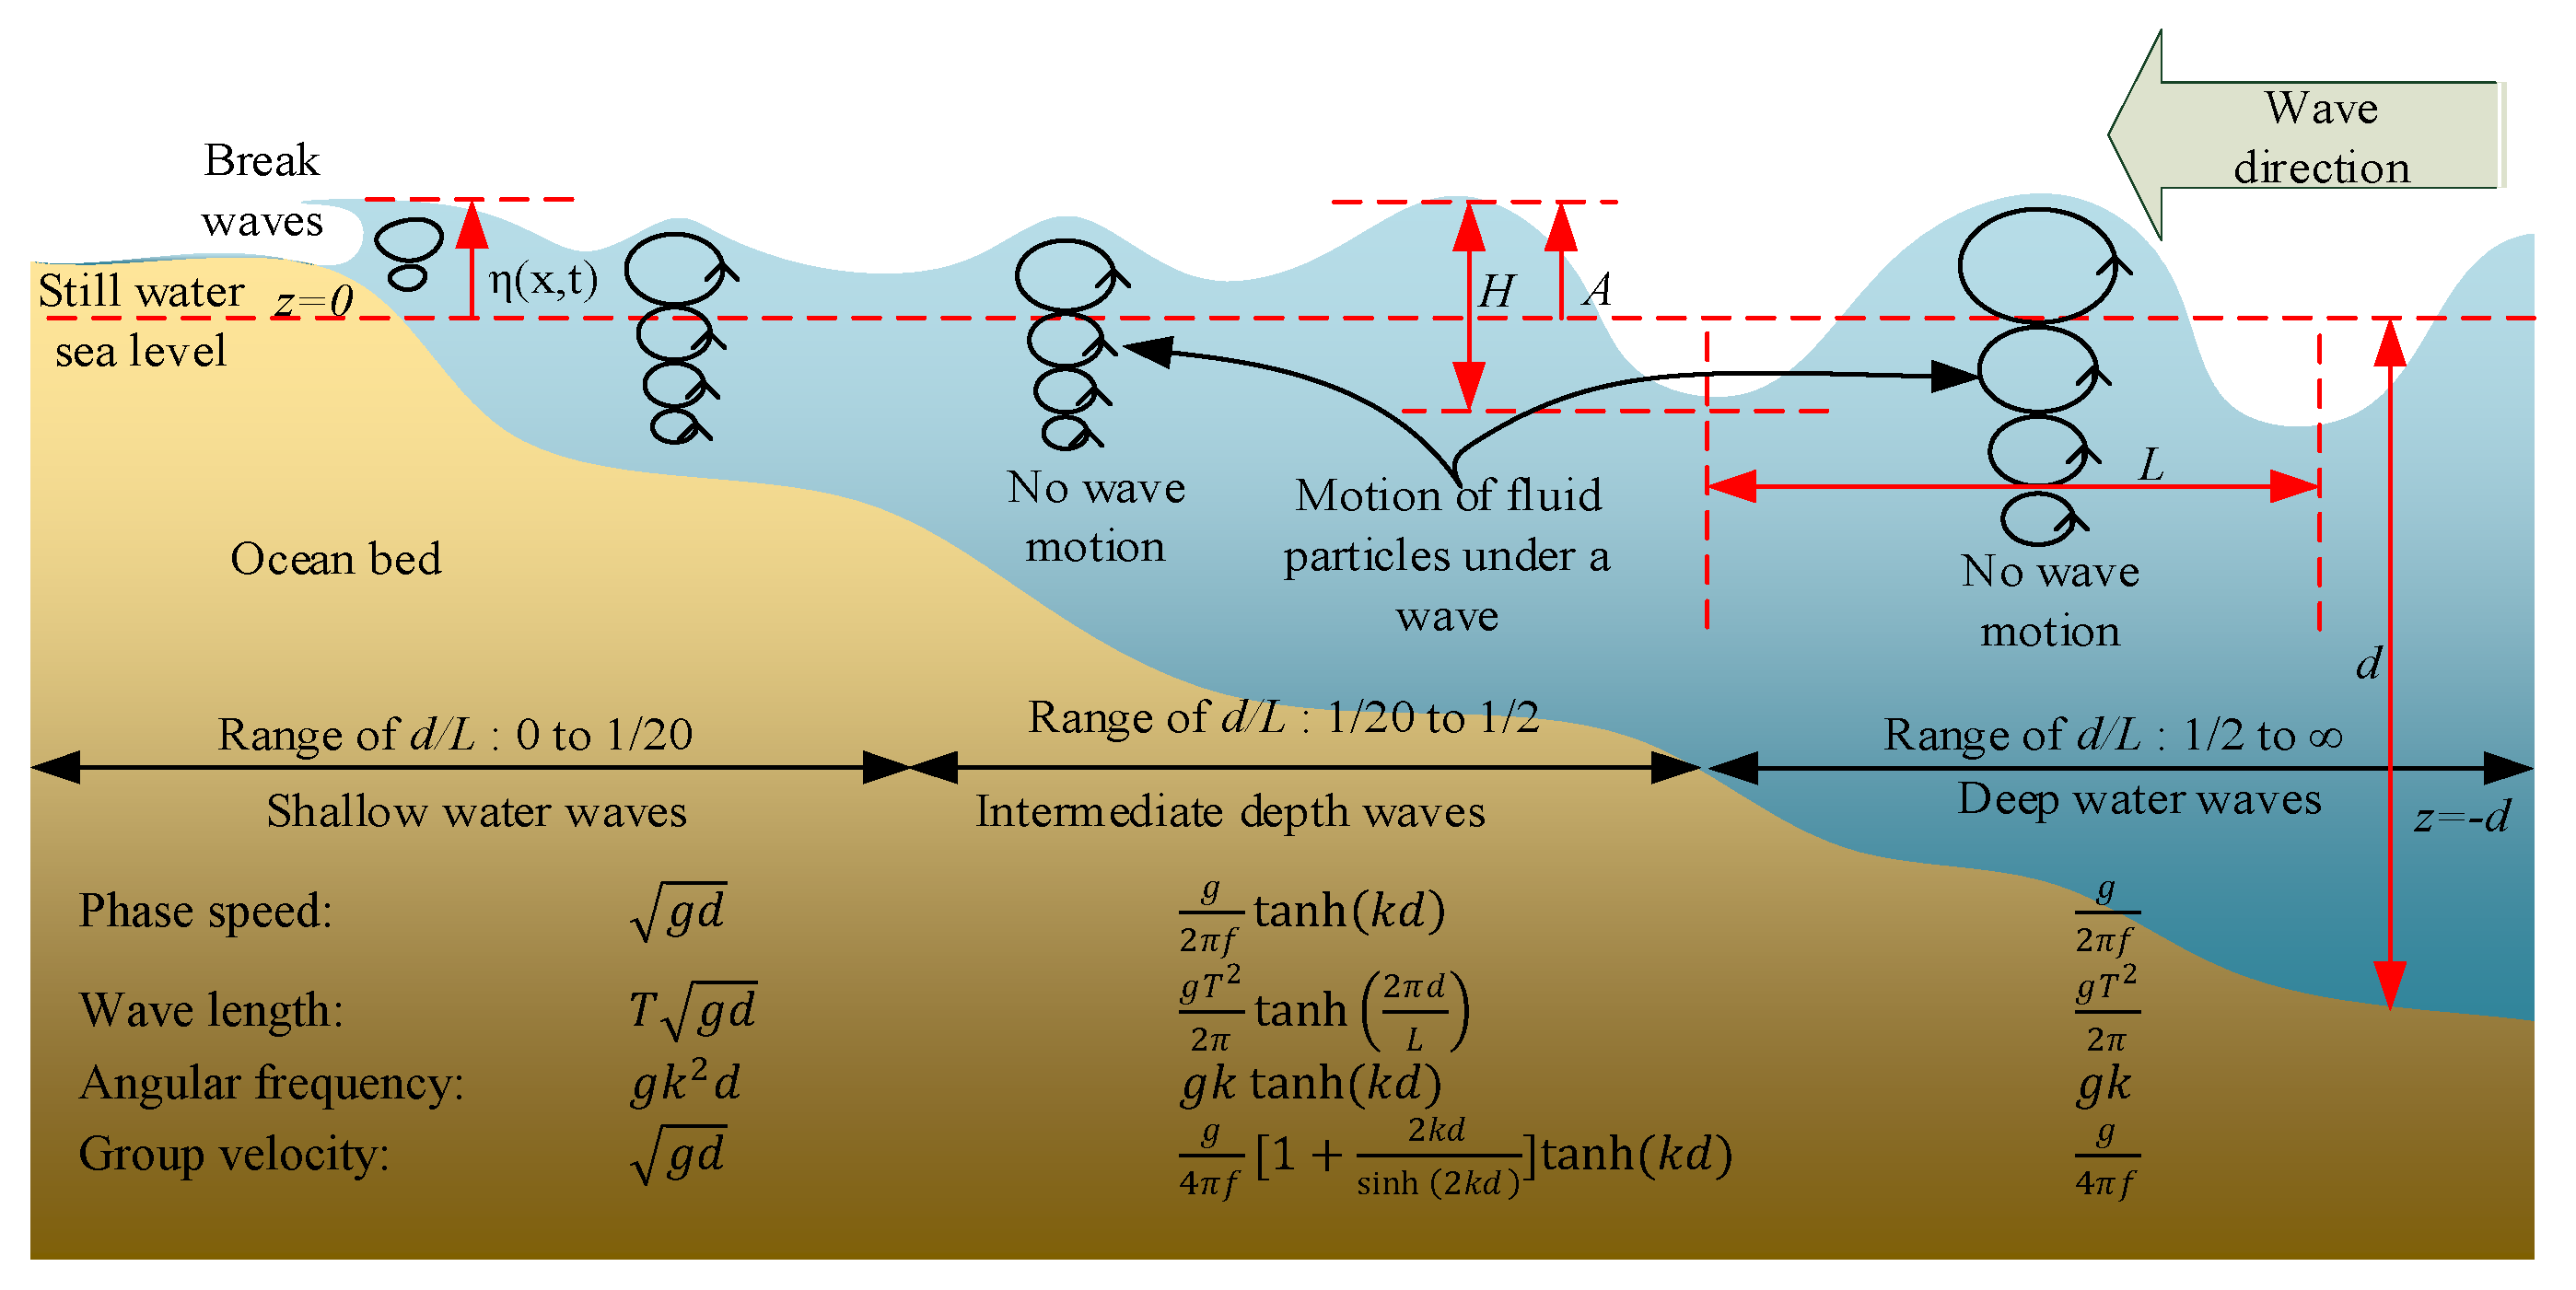
The determination of the parameters that are the most pertinent to ocean wave hydrodynamics is the first step in identifying the wave resources at a particular region of ocean space. Wave height, wave period, and wave direction are apparently the most relevant parameters to be investigated at the site of interest for the characterization of wave resources. However, there are other detailed parameters that are the basis of linear wave theory. Linear wave theory is a well-established theory concerning the hydrodynamics of waves, and it is explained in many books [6]. Although it has some limitations, it provides a basic theoretical rationale for wave modelling. Linear wave theory has the following assumptions: (a) the water depth is constant, (b) the wave motion is two-dimensional, (c) the waves are time independent, (d) the water is incompressible, (e) the viscosity, surface tension, and turbulence of the fluid (water) are neglected, (f) the wavelength L is large compared to wave height H, and (g) the water depth d is large compared to the wave height H. The phase speed of ocean waves varies with the depth of the water, and with a constant ω and k, waves will propagate at a faster phase speed in a deeper ocean. Similarly, the wavelength L of water waves will also change with the change in the water depth. The relations for phase speed, wavelength, angular frequency, and group velocity are shown in Figure 2. The direction of wave propagation, the varying ocean depth, and the induced waves are represented with a sketch in Figure 2.
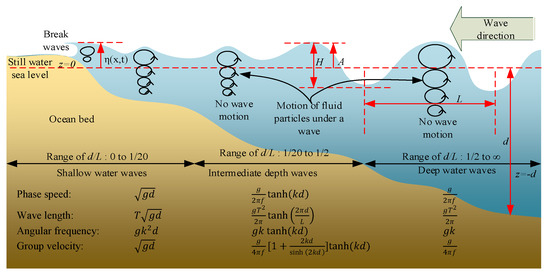
Figure 2.
Sketch of ocean waves representing the prominent wave parameters in the varying depths of water.
The relation for the time series of wave elevation η can be represented as follows [7]:
where φi is a random phase.
3. Parametric Wave Spectra
A wave spectrum S(f) or S(ω) can be mathematically represented with any of the empirical spectrum relations, such as the Scott, the Torsethaugen, the TMA, the Ochi-Hubble, the Mitsuyasu, the Liu, the ITTC, the Neumann, the Phillips, the Pierson–Moskowitz, the Bretschneider, or the Joint North Sea Wave Project (JONSWAP) spectra. The most commonly used wave spectra are presented in Table 1.

Table 1.
Parametric wave spectra.
4. Results and Discussions
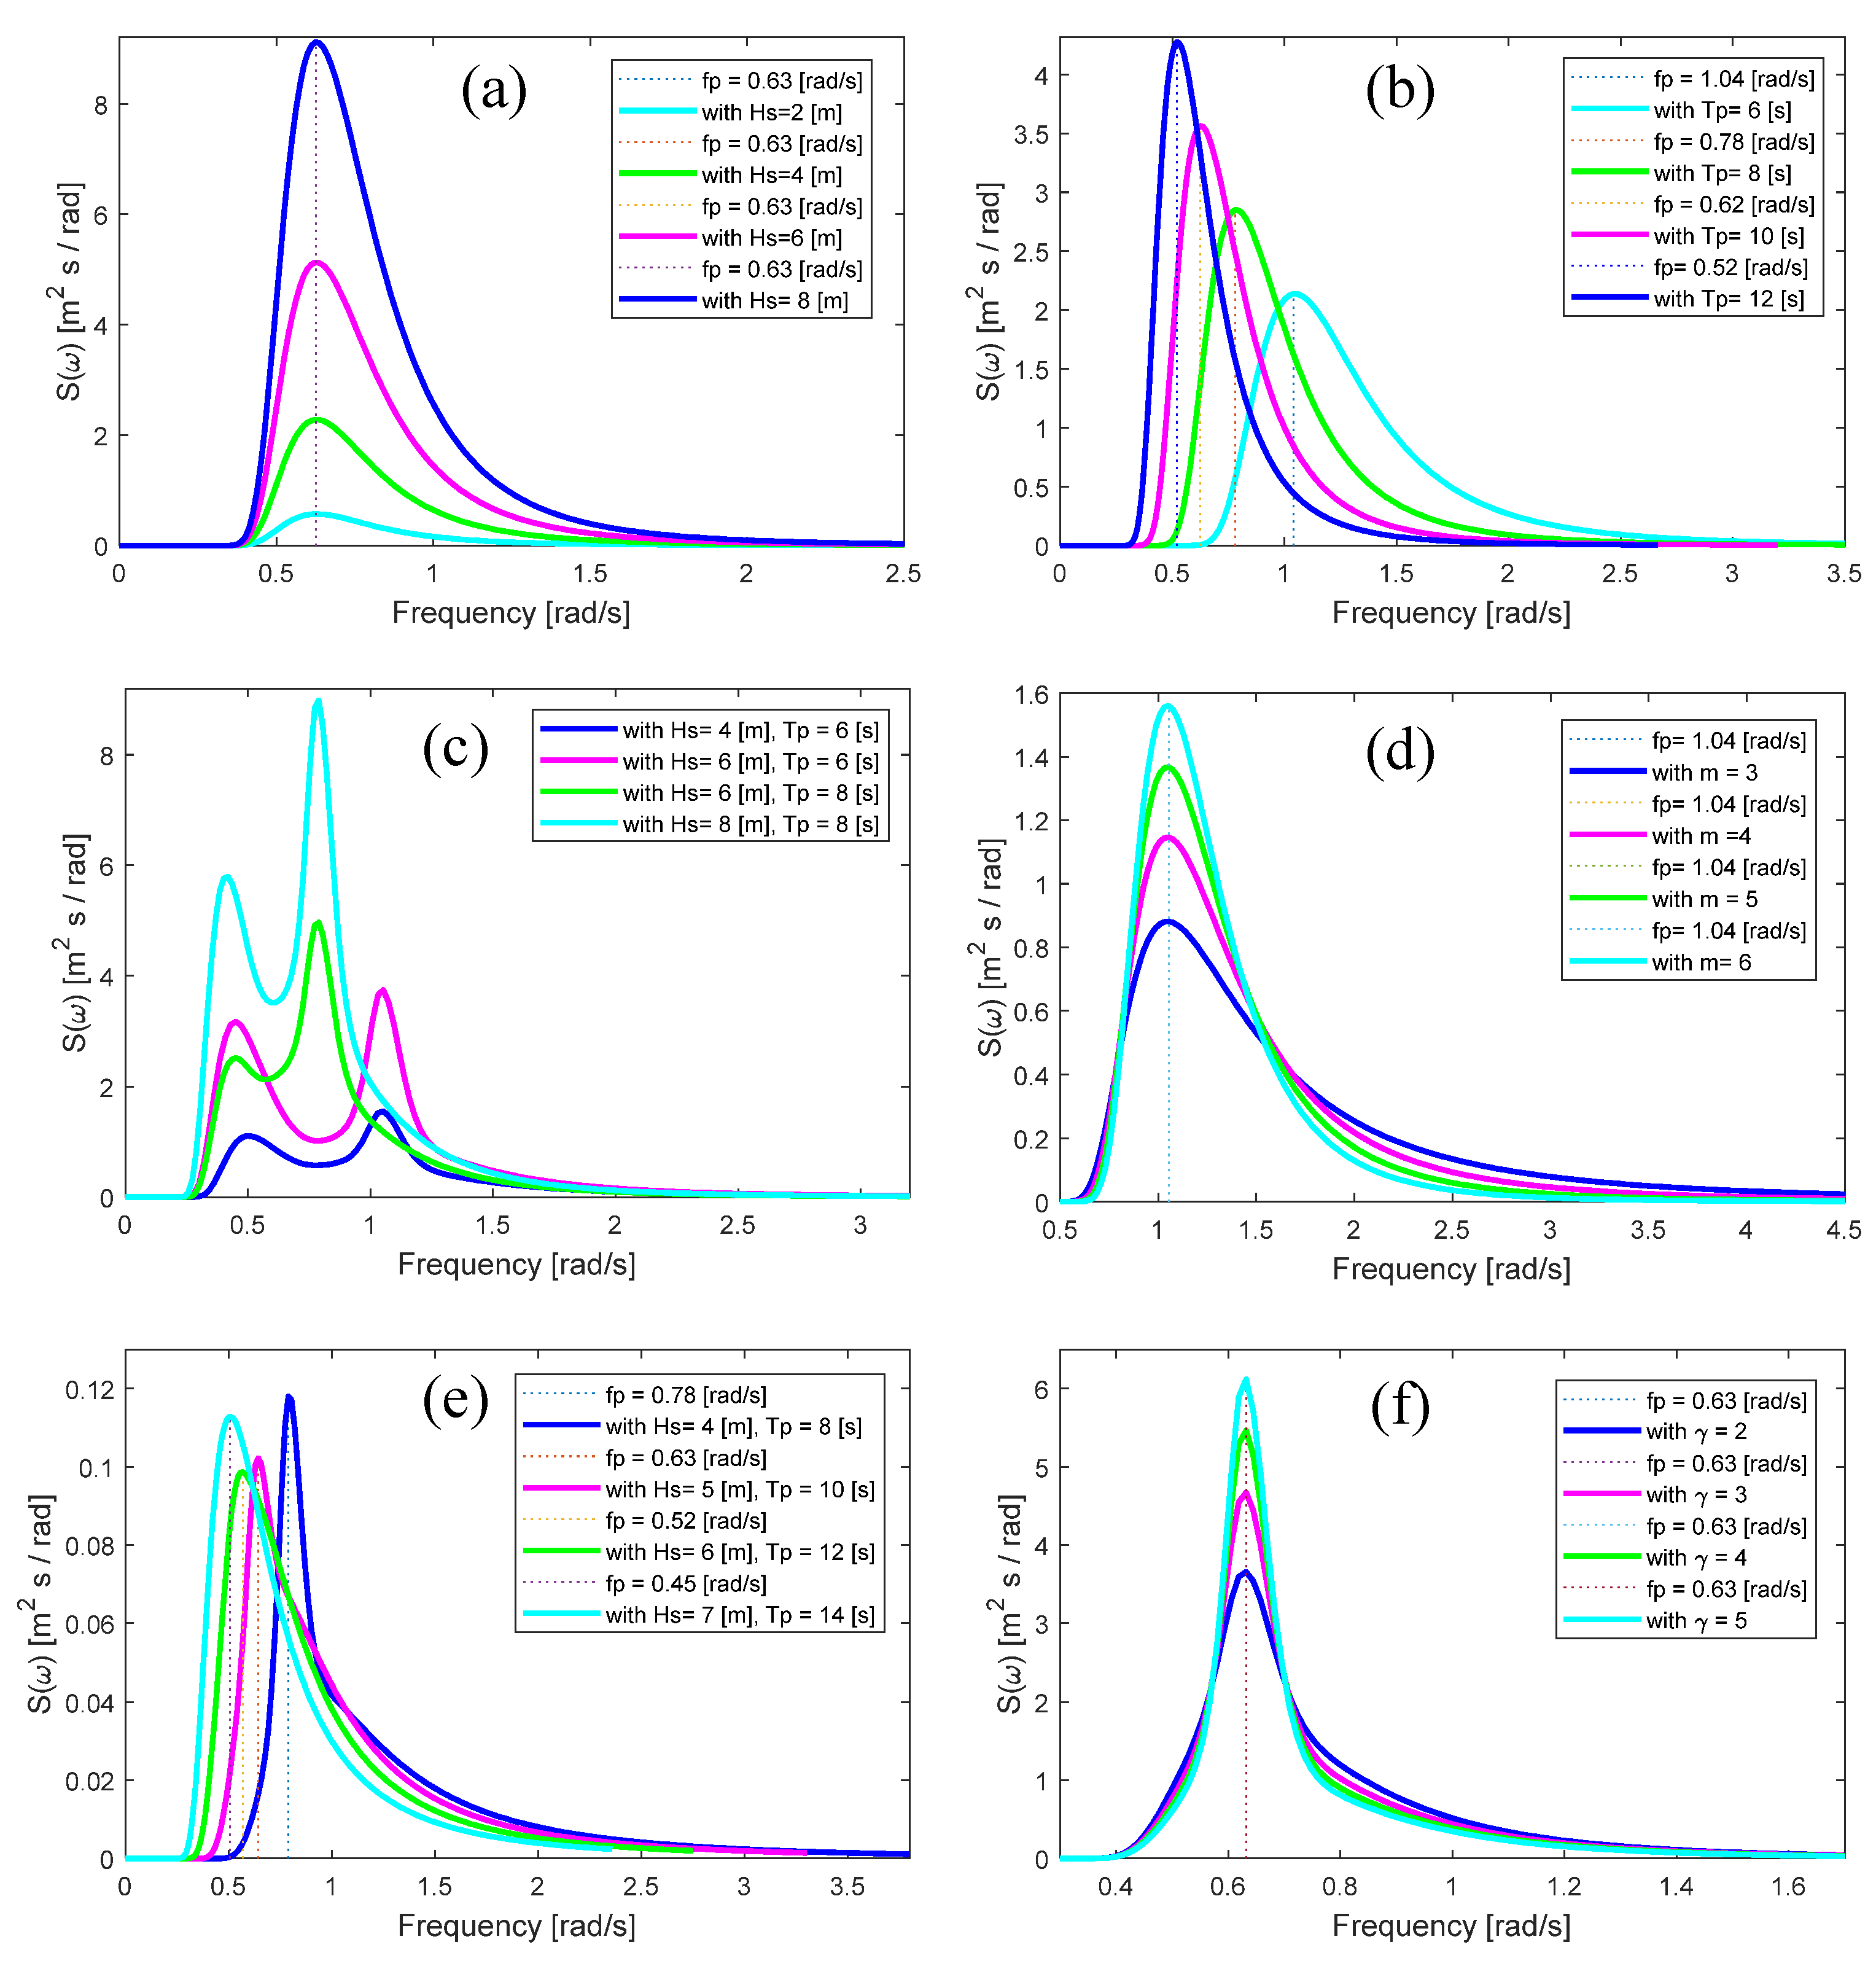
The Bretschneider spectrum for , and is shown in Figure 3a. The Pierson–Moskowitz (PM) spectrum with is shown in Figure 3b. The Torsethaugen spectrum with is shown Figure 3c. The Wallop spectrum with is shown in Figure 3d. The TMA spectrum with is shown in Figure 3e. The JONSWAP spectrum with is shown in Figure 3f.
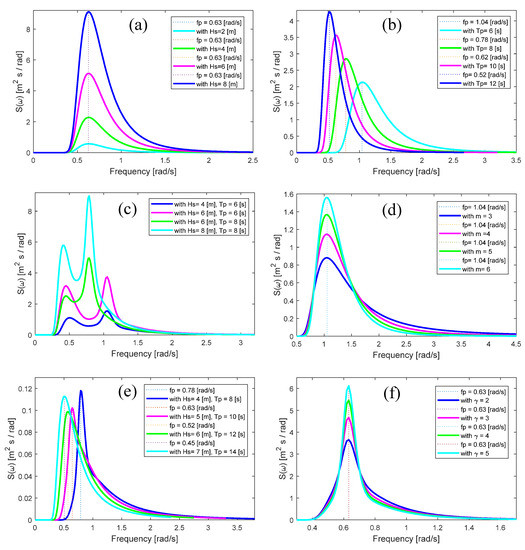
Figure 3.
MATLAB-simulated wave spectrum; (a) Bretschneider, (b) PM, (c) Torsethaugen, (d) Wallop, (e) TMA, and (f) JONSWAP.
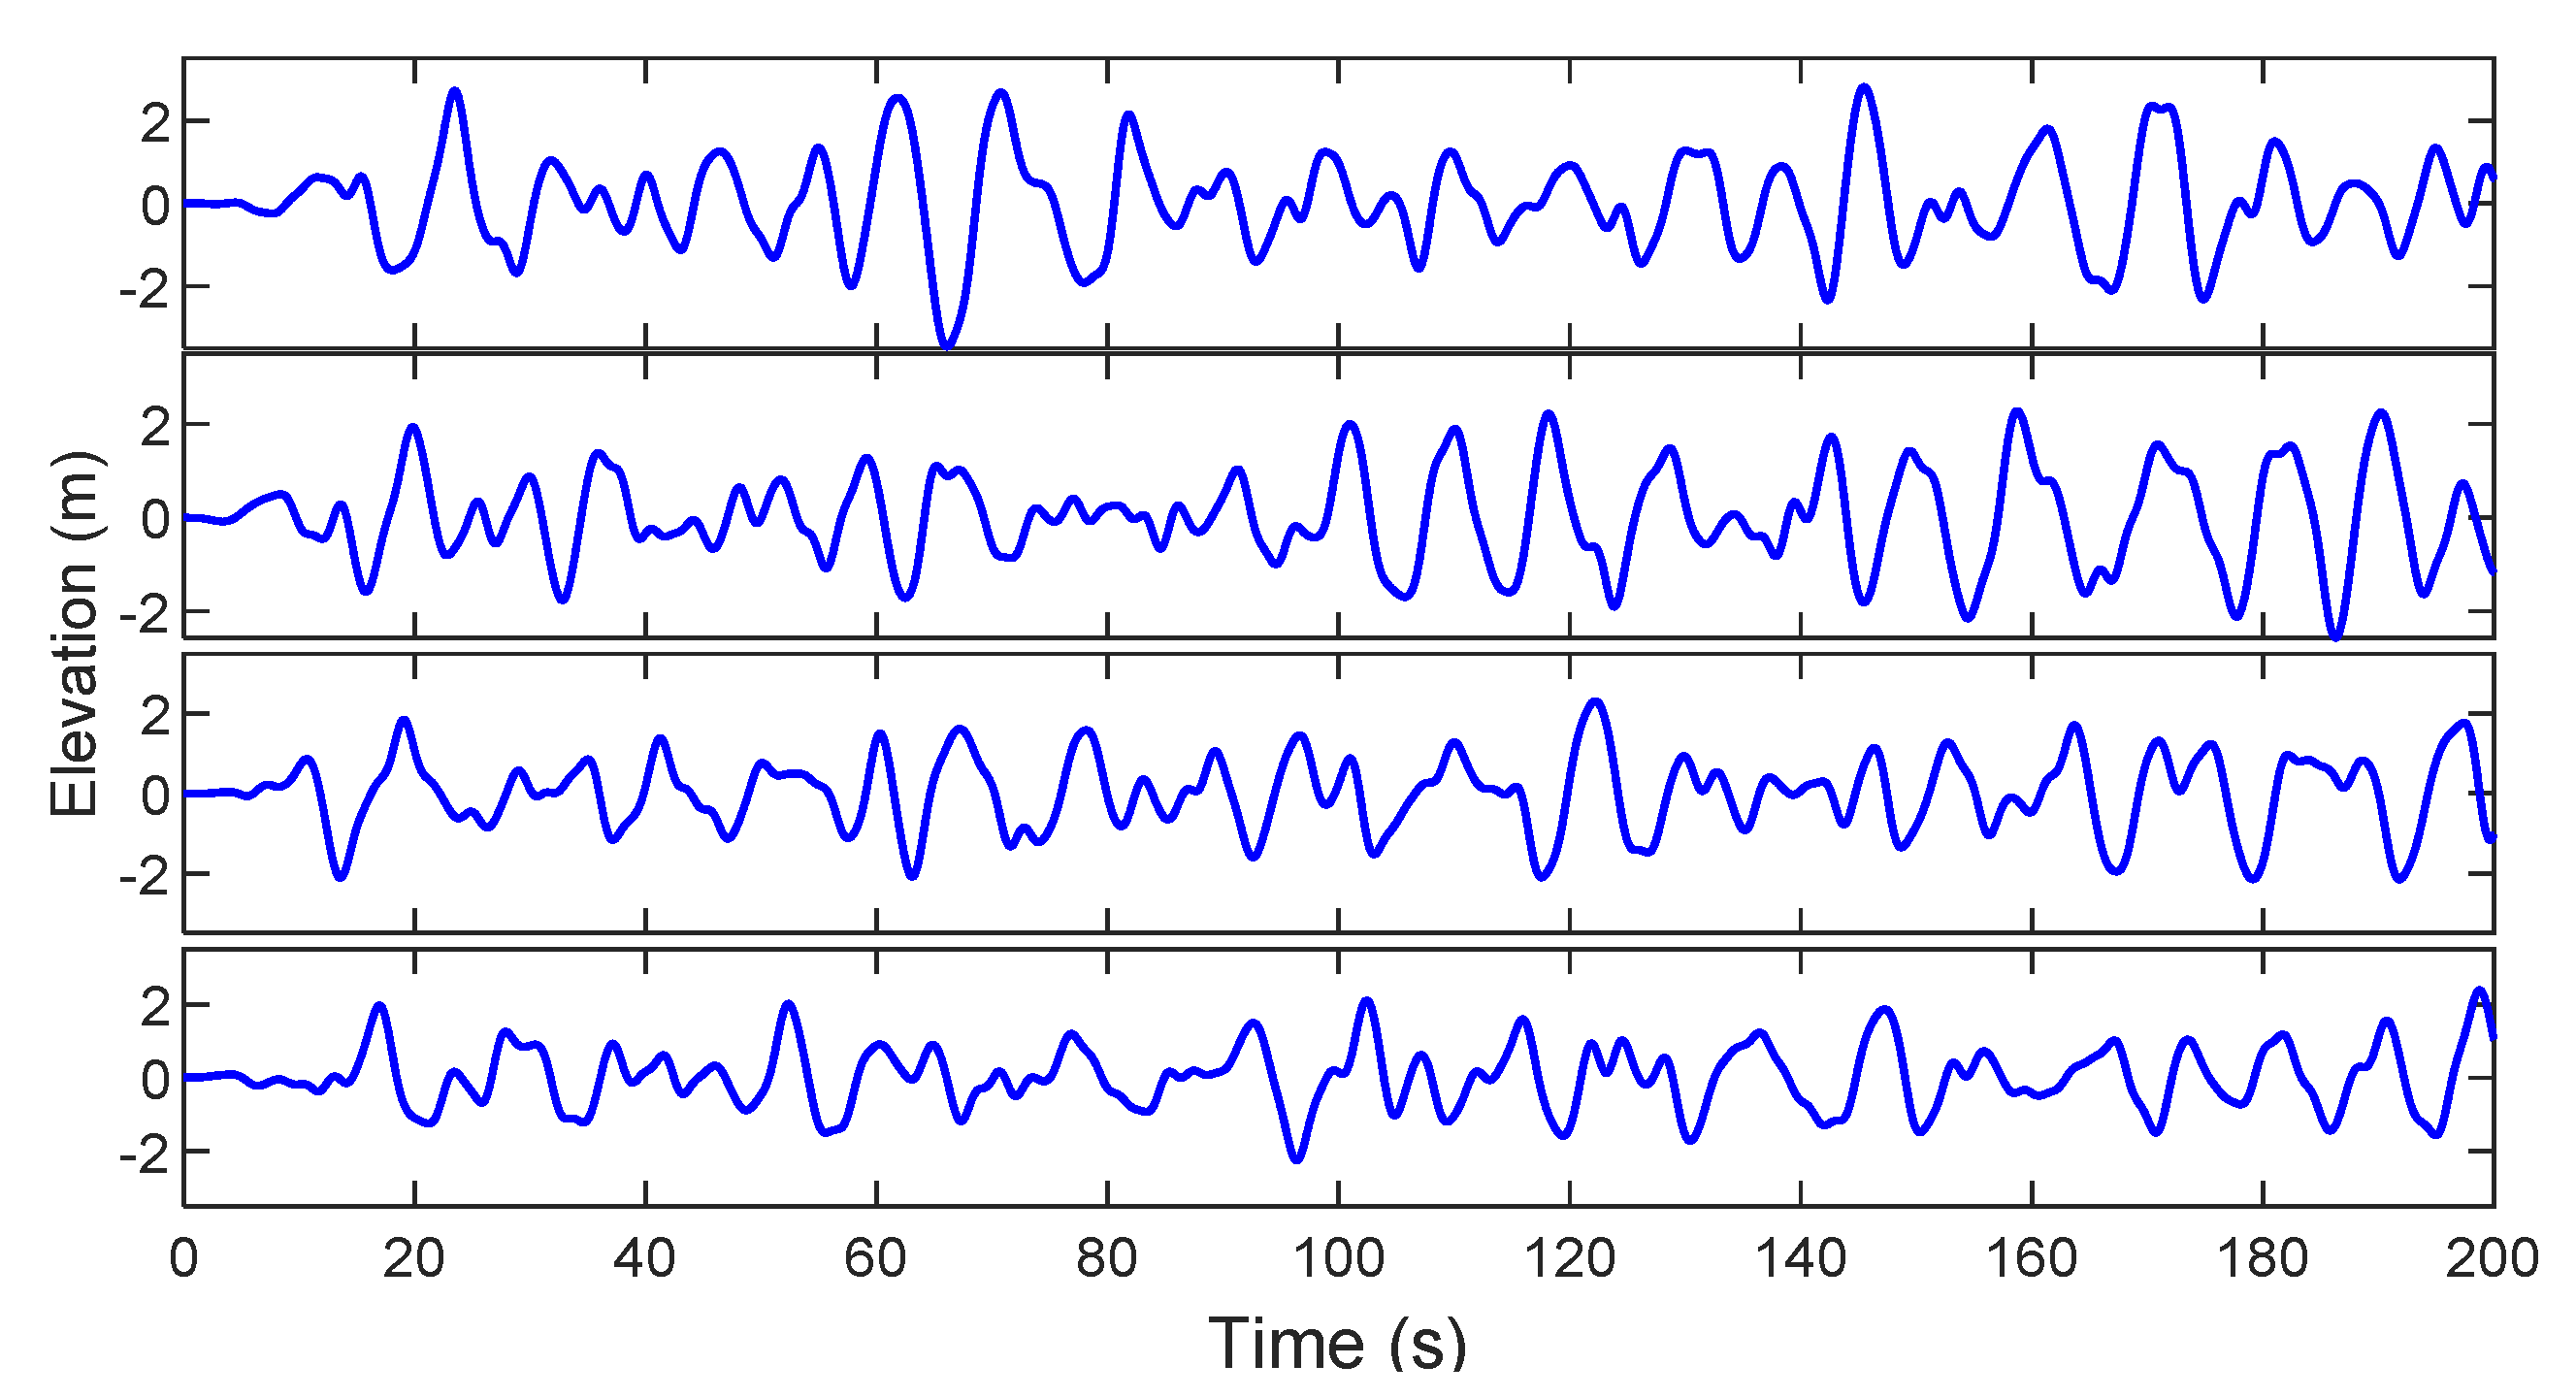
From the shape of the spectrum, the energy content of a wave with a specific frequency can be estimated. Figure 3 shows that the JONSWAP spectrum has a sharp shape, showing that most of the energy lies within a limited band. This represents a perfect fetch-limited condition based on the parametric observation. Therefore, such a JONSWAP spectrum is most suited for engineering applications specifically for the wave-to-wire model of wave energy conversion. Using inverse fast Fourier transform (IFFT) and Equation (1), a JONSWAP spectrum-based wave elevation signal is generated for 200 s, and shown in Figure 4. This can serve as an input to any wave-to-wire model for further analysis of the wave energy conversion technology.
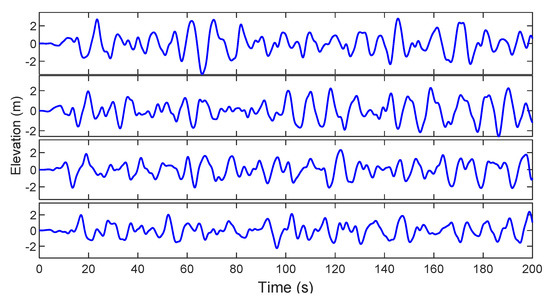
Figure 4.
The obtained wave elevation profile for 200 s duration for , respectively.
5. Conclusions
In this paper, different wave spectra are parametrically observed. The wave spectrum that is more suitable for its application in wave-to-wire models of ocean energy harvesting is identified based on the limited fetch. Based on IFFT, ocean wave elevation time series are obtained which will can act as input data for any of the wave energy converters deployed for the harnessing of ocean wave energy.
Author Contributions
Writing—original draft preparation, S.R.; writing—review and editing, S.R.; supervision, K.M.M.; supervision, D.S. All authors have read and agreed to the published version of the manuscript.
Conflicts of Interest
The authors declare no conflict of interest.
References
- Melikoglu, M. Current status and future of ocean energy sources: A global review. Ocean Eng. 2018, 148, 563–573. [Google Scholar] [CrossRef]
- Rasool, S.; Islam, M.R.; Muttaqi, K.M.; Sutanto, D. The Grid Connection of Linear Machine-Based Wave Power Generators. In Advanced Linear Machines and Drive Systems; Springer: Singapore, 2019; pp. 303–341. [Google Scholar]
- Mustapa, M.A.; Yaakob, O.B.; Ahmed, Y.M.; Rheem, C.-K.; Koh, K.K.; Adnan, F.A. Wave energy device and breakwater integration: A review. Renew. Sustain. Energy Rev. 2017, 77, 43–58. [Google Scholar] [CrossRef]
- Gunn, K.; Stock-Williams, C. Quantifying the global wave power resource. Renew. Energy 2012, 44, 296–304. [Google Scholar] [CrossRef]
- Rasool, S.; Islam, M.R.; Muttaqi, K.M.; Sutanto, D. Coupled Modeling and Advanced Control for Smooth Operation of a Grid-Connected Linear Electric Generator Based Wave-to-Wire System. IEEE Trans. Ind. Appl. 2020, 56, 5575–5584. [Google Scholar] [CrossRef]
- Falnes, J. Ocean Waves and Oscillating Systems; Cambridge University Press: Cambridge, UK, 2002; ISBN 9780511754630. [Google Scholar]
- Rasool, S.; Muttaqi, K.M.; Sutanto, D. Modelling of a wave-to-wire system for a wave farm and its response analysis against power quality and grid codes. Renew. Energy 2020, 162, 2041–2055. [Google Scholar] [CrossRef]
Publisher’s Note: MDPI stays neutral with regard to jurisdictional claims in published maps and institutional affiliations. |
© 2021 by the authors. Licensee MDPI, Basel, Switzerland. This article is an open access article distributed under the terms and conditions of the Creative Commons Attribution (CC BY) license (https://creativecommons.org/licenses/by/4.0/).