1. Introduction
Domestic buildings consume almost half of the total energy production in Pakistan [
1]. Making buildings more energy-efficient and smart is therefore important to reduce energy demand. Zero energy homes are energy efficient and use renewable energy sources to perform all operations of life. Typically, after a couple of years, the building reaches to the energy balance of zero. The efficient utilization and conservation of energy is an important element of government methodology to meet the issues the power sector has been facing. National energy efficiency and conservation authority have been given the responsibility to conserve energy by planning and initiating different actions, making the policies nationwide.
According to geographical measures, Pakistan is situated at the latitudes between 24° N and 37° N therefore it receives high solar radiation. Due to its sunny climate and high solar radiation, the temperature in the southern areas of Pakistan remains high for 7 months of the year. Considering these realities, Pakistan is the most feasible for solar technologies [
2].
Poorly designed buildings become hot in summer and to obtain a comfortable indoor temperature, the HVAC load needs to be increased. This causes greater pressure and demand on the national grid. For energy conservation and a better indoor environment, a proper structure and the standardized architecture of residential buildings are required. The use of proper passive design techniques can make buildings more comfortable and temperature efficient [
3].
The government created policies for energy conservation and Energy Conservation Cell, National Energy Conservation Center (ENERCON), and the Ministry of Water and Power convey these guidelines [
4].
The efficient thermal envelope and energy-efficient houses result in the reduction of demand [
5]. In [
6], the authors performed a comparison between official buildings and energy-efficient buildings by using the simulation software e-Quest. It explains the effects of different structures in the building architecture such as the size of the windows, lighting material, and setting point of the thermostat for the air conditioner and refrigerators. It shows that 5% of energy can be saved by the setting size of the windows [
7] and 12% to 16.4% of energy is saved by the appropriate setting of the thermostat for the air conditioners. This shows that energy can be saved when small changes are made such as the use of insulation and coating of the walls of the building and the setting up the temperature of the appliances [
8].
Cavity structured walls are better for the buildings to reduce the heating effect. By building cavity structured walls, the HVAC load of the buildings and solar heat gain is reduced [
9]. Moreover, it was suggested that the use of LED lights instead of traditional ones was more beneficial. In [
10,
11], the authors described the different energy conservation techniques for building the structure of the walls, the heating, cooling, and ventilation system design.
2. Energy Efficient Building Design
For the reasons stated above, a South-East oriented 5 marlas house with a flat rooftop, housing a family of 4, was designed in order to estimate the solar potential from the utilization of photovoltaic, solar thermal, and photovoltaic-thermal in an effort to achieve zero energy building. The geometry of the building is defined in
Table 1. We use BEopt [
12] software to design the house. BE-opt is a software that allows the user to evaluate and compare the building designs and retrofit the existing building designs as well as analyze the cost and provide a cost-optimization solution. It allows us to incorporate all the information in the simulation about the architecture, the structure, and the material used in the building as well as the use of different appliances in the household. The national renewable energy laboratory developed this software to be easily used by engineers to make the buildings zero-energy buildings.
For the energy supply system, we used the POLYSUN [
13] software, which allows for the best template to make the design for the heat pump, solar-thermal and photo-voltaic, and their combined systems. The simulation is assisted by the metronome data. Simulation time can be set by the user.
Figure 1a shows the energy usage in different ways in a house, and, in
Figure 1b, the overall energy and temperature profile of the house is presented. The energy used for cooling throughout the year and the total energy used are shown in the graph. The dark green line shows indoor temperature, the orange line shows total energy in BTU and the brown line shows energy for cooling the building.
We examined the different combinations of solar collectors, photovoltaic, and storage tanks to check the impact of these combinations on the total solar coverage. In order to meet the building load, each building was assumed to have a backup of natural gas. In order to meet the electrical loads of the buildings, different sized photo-voltaic systems were evaluated with different capacities.
3. Results
We proposed a thermal energy system, for different cities, but in this paper, we present the results for the city of Quetta.
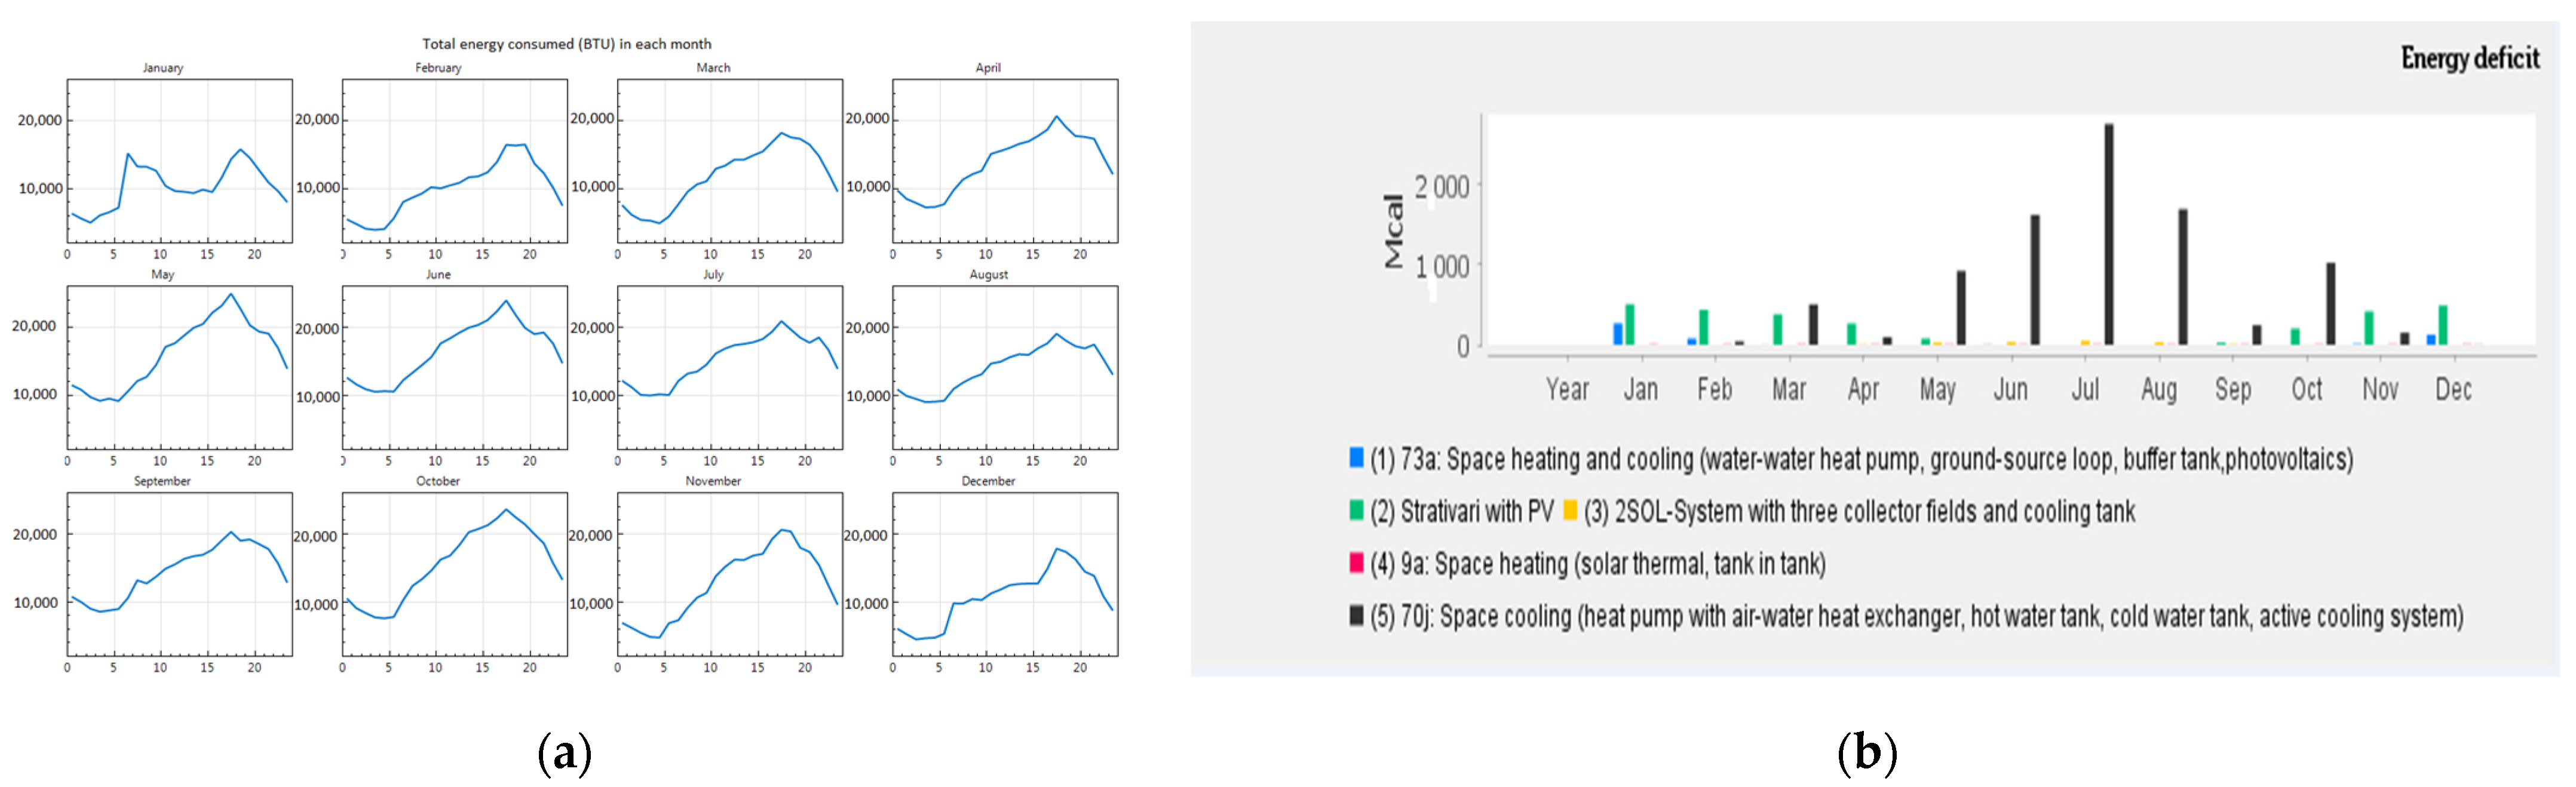
Figure 2a shows a monthly energy profile of the house and
Figure 2b shows the energy deficit in the city of Quetta for the different months of the year. During the analysis of the results, the PVT shows the best results. These results are given in
Table 2.
The simulations show that more than half of the energy used in the domestic building is consumed to maintain the indoor temperature. The following graph shows the energy used in heating, cooling, domestic hot water, lights, and other usages. The indoor temperature in Fahrenheit, energy used for cooling throughout the year, and the total energy used, are shown in graph 3. The dark green line shows the indoor temperature, the orange line shows the total energy in Btu and the brown line shows energy for cooling the building. The need for energy for cooling, lighting, and heating is remarkably less. There is a noticeable effect of doing small changes in the structure and using advanced technology. The total energy index of the house transfer is from 94.6 to 67.6. This is the noticeable energy conservation as shown in
Figure 2b.
4. Conclusions
In this paper, energy conservation and the investigation of the utilization of solar techniques such as photo-voltaic, solar-thermal, and photo-voltaic-thermal modules in typical residential buildings of different cities were carried out. This study was performed to analyze the impact of zero-energy buildings. Many factors have influenced the results such as the boundary conditions and, energy balance calculations, and the aim is either to get closer to the energy demand or fulfill the energy demand at a low cost.
Three systems are studied for the single-family house. The photo-voltaic-based energy system, the solar-thermal collector, the photo-voltaic-thermal module system, and the combination of PV and collector systems are studied for different cities. The overall aim is to conserve energy and achieve the demand for the operation of a domestic house. Through the proper insulation and construction of buildings, energy can be conserved. The energy index rating can be transferred from 94.6% to 67.6%.
Author Contributions
Conceptualization, M.S.E.; methodology, Z.M.; software, Z.M.; writing—original draft preparation, Z.M.; writing—review and editing, M.S.E.; supervision, M.S.E. All authors have read and agreed to the published version of the manuscript.
Funding
This research received no external funding.
Institutional Review Board Statement
Not applicable.
Informed Consent Statement
Not applicable.
Data Availability Statement
Not applicable.
Conflicts of Interest
The authors declare no conflict of interest.
References
- Farooq, M.; Shakoor, A. Severe energy crises and solar thermal energy as a viable option for Pakistan. J. Renew. Sustain. Energy 2013, 5, 013104. [Google Scholar] [CrossRef]
- Ahmad, K.; Badshah, S.; Rafique, A.F. A simulated case study of office building in Pakistan to improve the energy efficiency. Int. J. Eng. Adv. Technol. 2014, 4, 7–9. [Google Scholar]
- Khalid, H.; Zakaria, M. Estimation of solar radiation in Southern areas of Pakistan using radiation models. J. Renew. Sustain. Energy 2016, 8, 37–43. [Google Scholar] [CrossRef]
- Hameed, R.; Nadeem, O.; Altaf, S.; Ameen, F. Improving the Energy Efficiency of Existing Commercial Buildings in Lahore Through Retrofitting Technique. J. Fac. Eng. Technol. 2014, 21, 95–104. [Google Scholar]
- Mohammed, M.A.; Budaiwi, I.M. Strategies for reducing energy consumption in a student cafeteria in a hot-humid climate: A case study. J. Sustain. Dev. Energy Water Environ. Syst. 2013, 1, 14–26. [Google Scholar]
- Bojic, M.; Yik, F.; Wan, K.; Burnett, J. Influence of envelope and partition characteristics on the space cooling of high-rise residential buildings in Hong Kong. Build. Environ. 2002, 37, 347–355. [Google Scholar] [CrossRef]
- Daouas, N. A study on optimum insulation thickness in walls and energy savings in Tunisian buildings based on analytical calculation of cooling and heating transmission loads. Appl. Energy 2011, 88, 156–164. [Google Scholar] [CrossRef]
- Pan, D.; Chan MDeng, S.; Lin, Z. The Effect of External Wall insulation thikness on annual colling and heating enenergy uses under different climates. Appl. Energy 2012, 97, 313–318. [Google Scholar] [CrossRef]
- Joudi, A.; Svedung, H.; Cehlin, M.; Ronnelid, M. Reflective coatings for interior and exterior of buildings and improving thermal performance. Appl. Energy 2013, 103, 562–570. [Google Scholar] [CrossRef]
- Fergus, N.; Najam, J.; Oliver, S.; Humphreys, M.; Roaf, S.; Hancock, M. A Survey of Thermal Comfort in Pakistan towards New Indoor Temperature Standards; Oxford Brookes University: Oxford, UK, 1994. [Google Scholar]
- Yang, M.; Rumsey, P. Energy conservation in typical Asian countries. Energy Sources 1997, 19, 507–521. [Google Scholar] [CrossRef]
- BEopt: Building Energy Optimization Tool. Available online: https://www.nrel.gov/buildings/beopt.html (accessed on 12 June 2021).
- Polysun. Available online: https://www.velasolaris.com/?lang=en (accessed on 12 June 2021).
| Publisher’s Note: MDPI stays neutral with regard to jurisdictional claims in published maps and institutional affiliations. |
© 2022 by the authors. Licensee MDPI, Basel, Switzerland. This article is an open access article distributed under the terms and conditions of the Creative Commons Attribution (CC BY) license (https://creativecommons.org/licenses/by/4.0/).


