Proceeding Paper

Enzyme-Assisted Extraction of Bioactive Compounds from Origanum dictamnus L. †

by
Zafeiria Lemoni
1,‡,
Roza Konstantina Leka
1,‡,
Theopisti Lymperopoulou
2 and
Diomi Mamma
1,*
1
Biotechnology Laboratory, School of Chemical Engineering, National Technical University of Athens, Zografou Campus, 9 Iroon Polytechniou Str., 15780 Athens, Greece
2
Products and Operations Quality Control Laboratory, School of Chemical Engineering, National Technical University of Athens, Zografou Campus, 9 Iroon Polytechniou Str., 15780 Athens, Greece
*
Author to whom correspondence should be addressed.
Presented at the 4th International Electronic Conference on Processes, 20–22 October 2025; Available online: https://sciforum.net/event/ECP2025.
These authors contributed equally to this work.
Eng. Proc. 2025, 117(1), 2; https://doi.org/10.3390/engproc2025117002
Published: 19 November 2025

Abstract

Enzyme-assisted extraction (EAE) was applied to extract bioactive compounds from the leaves of Origanum dictamnus L. using the commercial enzyme preparation Cellic® CTec3 HS. A Taguchi experimental design was applied to determine the optimal EAE conditions. The variables were enzyme loading, solid-to-liquid ratio, extraction time and the responses of total phenolic content (TPC), and total flavonoid content (TFC). Under optimized conditions, EAE achieved TPC yield of 164.8 ± 5.2 mg GAE/g and TFC yield reached 92.5 ± 5.7 mg CAE/g. The results support the potential of EAE as an efficient method for extraction of bioactive compounds from Origanum dictamnus L.

1. Introduction

Origanum dictamnus L., commonly known as dittany of Crete, belongs to the Lamiaceae family and is an aromatic, endemic herb thriving from sea level to mountainous regions. It has been historically used as a panacea, with references dating back to Hippocrates and Aristotle, and later recognized by Galen for its therapeutic properties—antioxidant, antimicrobial, anti-diabetic, anti-aging, and anticancer [1]. The leaves of O. dictamnus are rich in bioactive compounds such as flavonoids, phenolic acids, terpenes, and tannins, which contribute to the plant’s therapeutic potential and make it a promising raw material for applications in cosmetics, pharmaceuticals, and nutraceuticals. An efficient extraction method of these compounds is therefore essential to maximize their utilization and economic value [2,3].
Conventional extraction methods, such as maceration, Soxhlet extraction, and solvent extraction, are widely employed to recover bioactive compounds from plant matrices; however, they often require organic solvents, prolonged extraction times, and elevated temperatures [4]. To overcome these limitations, sustainable and environmentally friendly extraction methods have been developed. Among them, enzyme-assisted extraction (EAE) has gained considerable attention as a green technology that enhances the extraction of the valuable bioactive compounds [5,6].
EAE is based on the inherent ability of hydrolytic enzymes to effectively degrade the plant cell wall, facilitating the release of intracellular compounds, thus offering improved selectivity and higher yields. The type of enzyme used in EAE depends largely on the composition of the plant material [7]. Although EAE demonstrates promising potential, its application to Origanum dictamnus L. has been underexplored.
The present study aims to investigate the application of EAE of bioactive compounds from Origanum dictamnus L. leaves using the commercial cellulolytic preparation Cellic® CTec3 HS. A Taguchi experimental design was employed to optimize the process variables, namely enzyme loading, solid-to-liquid ratio, and extraction time, while maximizing the responses of total phenolic content (TPC) and total flavonoid content (TFC). The results provide insight into the potential of EAE as an efficient and sustainable method for the extraction of bioactive compounds from Origanum dictamnus leaves.

2. Materials and Methods

2.1. Plant Material

The raw material used in the experiments was dried Origanum dictamnus L. leaves, cultivated in the region of Crete and supplied by the company El Greco. Initially, the branches of the plant were removed (Figure 1a) and the leaves were collected for the study (Figure 1b). The leaves were then downsized in a laboratory mill (Figure 1c). The milled material was stored in plastic containers at room temperature until further analysis.

2.2. Chemical and Reagents

All reagents were of the highest purity, commercially available, and were obtained from Sigma Chemical Co. (St. Louis, MO, USA).

2.3. Enzyme Preparation

The commercial enzyme preparation Cellic® CTec3 HS was a generous gift of Novozymes A/S (Bagsværd, Denmark).

2.4. Enzyme-Assisted Extraction

The milled material was mixed with 50 mM of phosphate buffer pH = 5.5 and a specific amount of enzyme was added. Extraction was performed in a thermoshaker (Thermomixer®, Eppendorf, Hamburg, Germany) under constant stirring conditions (1300 rpm), operating at 50 °C. The samples were centrifuged at 10,000 rpm for 10 min at 4 °C and the supernatants were collected and stored at −18 °C until further analysis.

2.5. Conventional Extraction

The milled material was mixed with hydroethanolic mixtures of varying ethanol concentrations under constant stirring at 200 rpm, at 25 °C for 24 h, and with a solid-to-liquid ratio of 4% w/v. Six solvent systems with increasing ethanol content (0, 20, 40, 60, 80, and 100% v/v) were investigated. The samples were centrifuged at 10,000 rpm for 10 min at 4 °C and the supernatants were collected and stored at −18 °C until further analysis.

2.6. Total Phenolic Content

The total phenolic content (TPC) was determined according to the Folin–Ciocalteu method, as previously described [8]. Briefly, the extract was mixed with Folin–Ciocalteu reagent, distilled water, and aqueous sodium carbonate solution (22% w/v). The mixture was allowed to stand in the dark at room temperature for 1 h. The absorbance was measured at 755 nm and the results were expressed as mg of gallic acid equivalents (GAEs) per g of dry material (mg GAE/g). All measurements were performed in triplicate.

2.7. Total Flavonoid Content

The total flavonoid content (TFC) was measured using the aluminum chloride colorimetric method, following the procedure reported in our previous study [8]. Briefly, the extract was mixed with NaNO2 (5% w/v aqueous solution), AlCl3 (10% w/v aqueous solution), NaOH (1 M), and distilled water. The mixture was allowed to stand for 15 min at room temperature. The absorbance was measured at 510 nm. The results were expressed as mg catechin equivalents (CAEs) per g of dry material, (mg CAE/g).

2.8. Taguchi Method

The Taguchi method was developed to enhance process performance and quality by systematically evaluating the influence of multiple factors using orthogonal arrays. The identification of factor levels that optimize the responses is performed by integrating signal-to-noise (S/N) ratio analysis [9]. An L9 (33) orthogonal array was selected to investigate the effects of three independent factors, each at three levels, generated by Minitab® 17 and used to create a mathematical model to obtain the optimal conditions for maximum yield of the responses. The factors were solid-to-liquid ratio (1, 4, and 7% w/v), enzyme loading (50, 100, and 200 Units/g), and extraction time (1, 3, and 6 h), and the responses were TPC (mg GAE/g) and TFC (mg CAE/g). Experiments were conducted in triplicate, and results were analyzed via analysis of variance (ANOVA) to identify significant factors and interactions. The results were expressed as mean values with the standard deviation (SD) of three independent measurements (n = 3) and significance was assumed at p < 0.05.
Since the present study concerned the maximization of the responses, the S/N ratio for the “the higher the better” approach was evaluated as follows [10] (Equation (1)):
S N = 10 log 1 n i = 1 n 1 / Y i 2
where n is the total number of replications of each test run; Y i is the number of responses realized in the replication experiment; i is carried out under the same experimental conditions of each test run.
The data obtained from the Taguchi method for each response were then subjected to regression analysis and fitted to the following quadratic polynomial model (Equation (2)).
y = β 0 + i = 1 n β i X i + i = 1 n j = i + 1 n β i j X i X j + i = 1 n β i i X i i 2  
where Y is the predicted response; β0 is an offset term; βi, βii, and βij are the linear, quadratic, and interactive coefficients, respectively; n is the number of independent variables; Xi and Xj are the levels of the independent variables.

3. Results and Discussion

3.1. Conventional Extraction

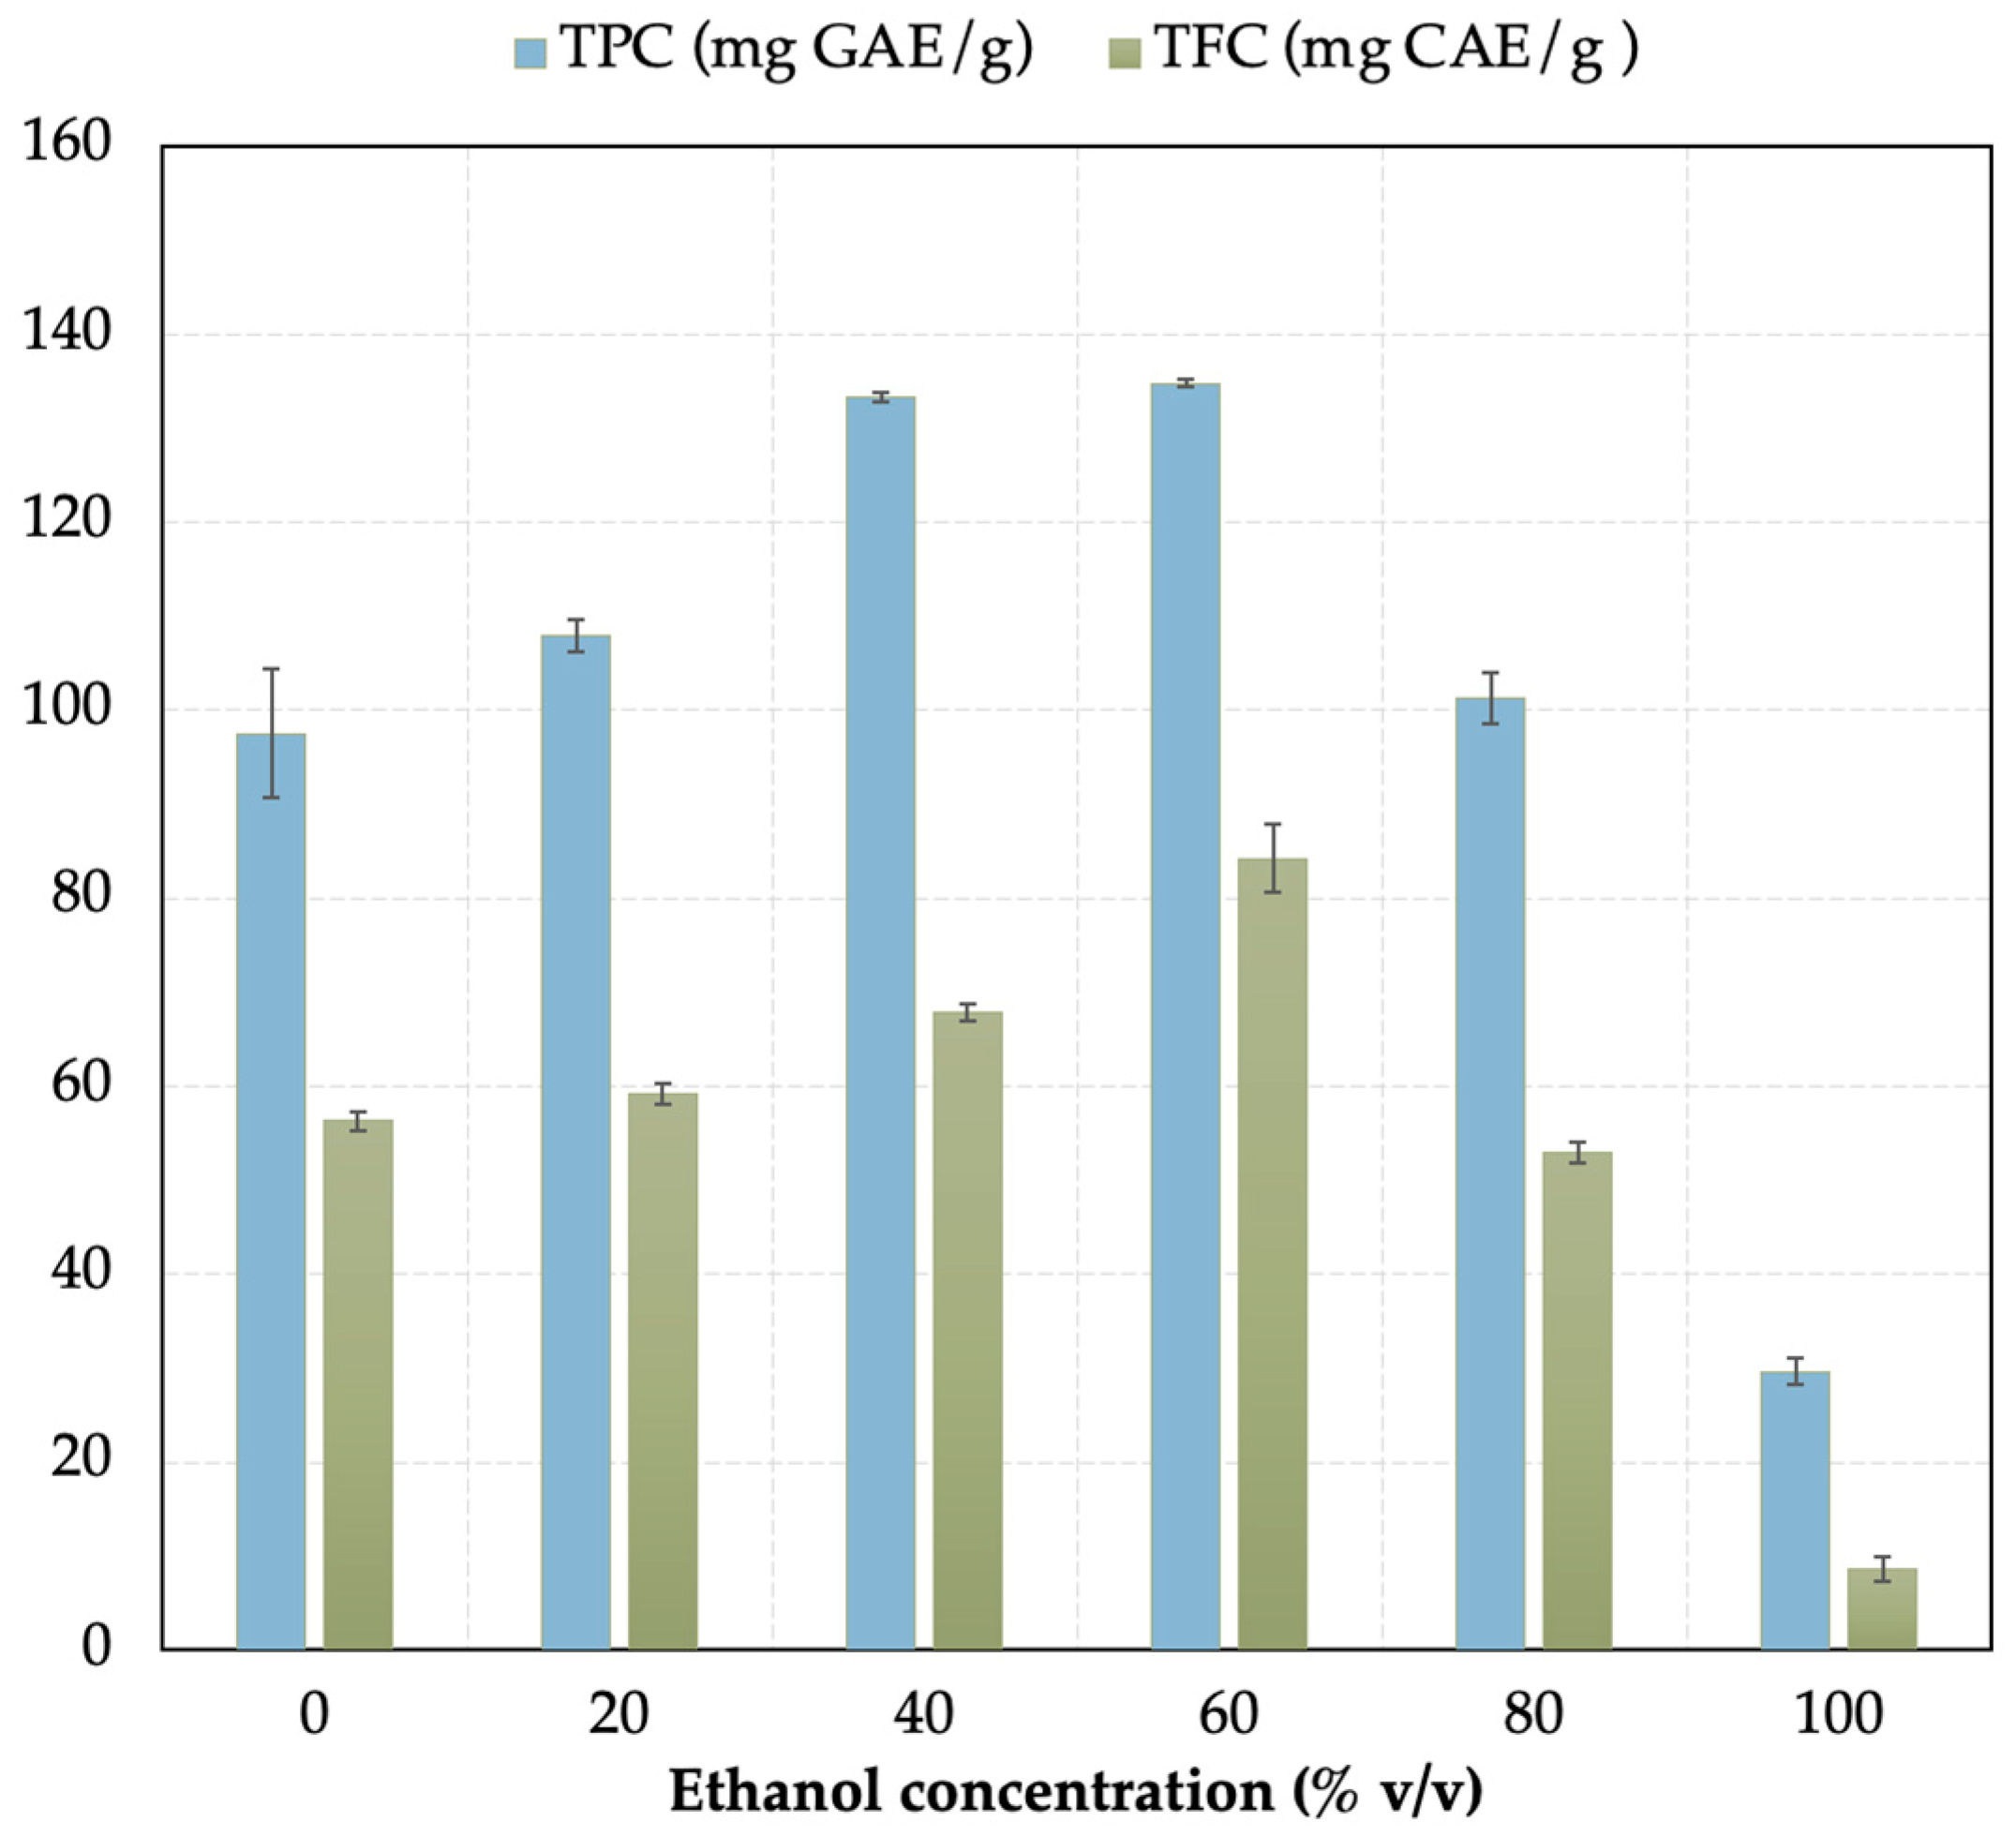
Conventional extraction was performed in six different ratios of hydroethanol mixture with increasing ethanol content (0, 20, 40, 60, 80, 100% v/v). Figure 2 shows the results of the total phenolic content (TPC) and total flavonoid content (TFC) measurements in all experiments performed.
The highest TPC was observed at a 60:40 ethanol–water ratio, reaching 134.7 ± 0.4 mg GAE/g, whereas the maximum TFC was 84.2 ± 3.6 mg CAE/g, showing a noticeable difference. In general, as the ethanol content increased, all three measured variables initially rose, reaching their respective maxima. Beyond this point, further increases in ethanol content led to a gradual decline in these values, likely due to the differing polarities of the two solvents.

3.2. Taguchi Method

The data of TPC and TFC obtained from the Taguchi method are presented in Table 1. The results indicated that phenolic and flavonoid extracted responded differently to the tested factors, emphasizing the importance of optimizing extraction conditions according to the target compound class.
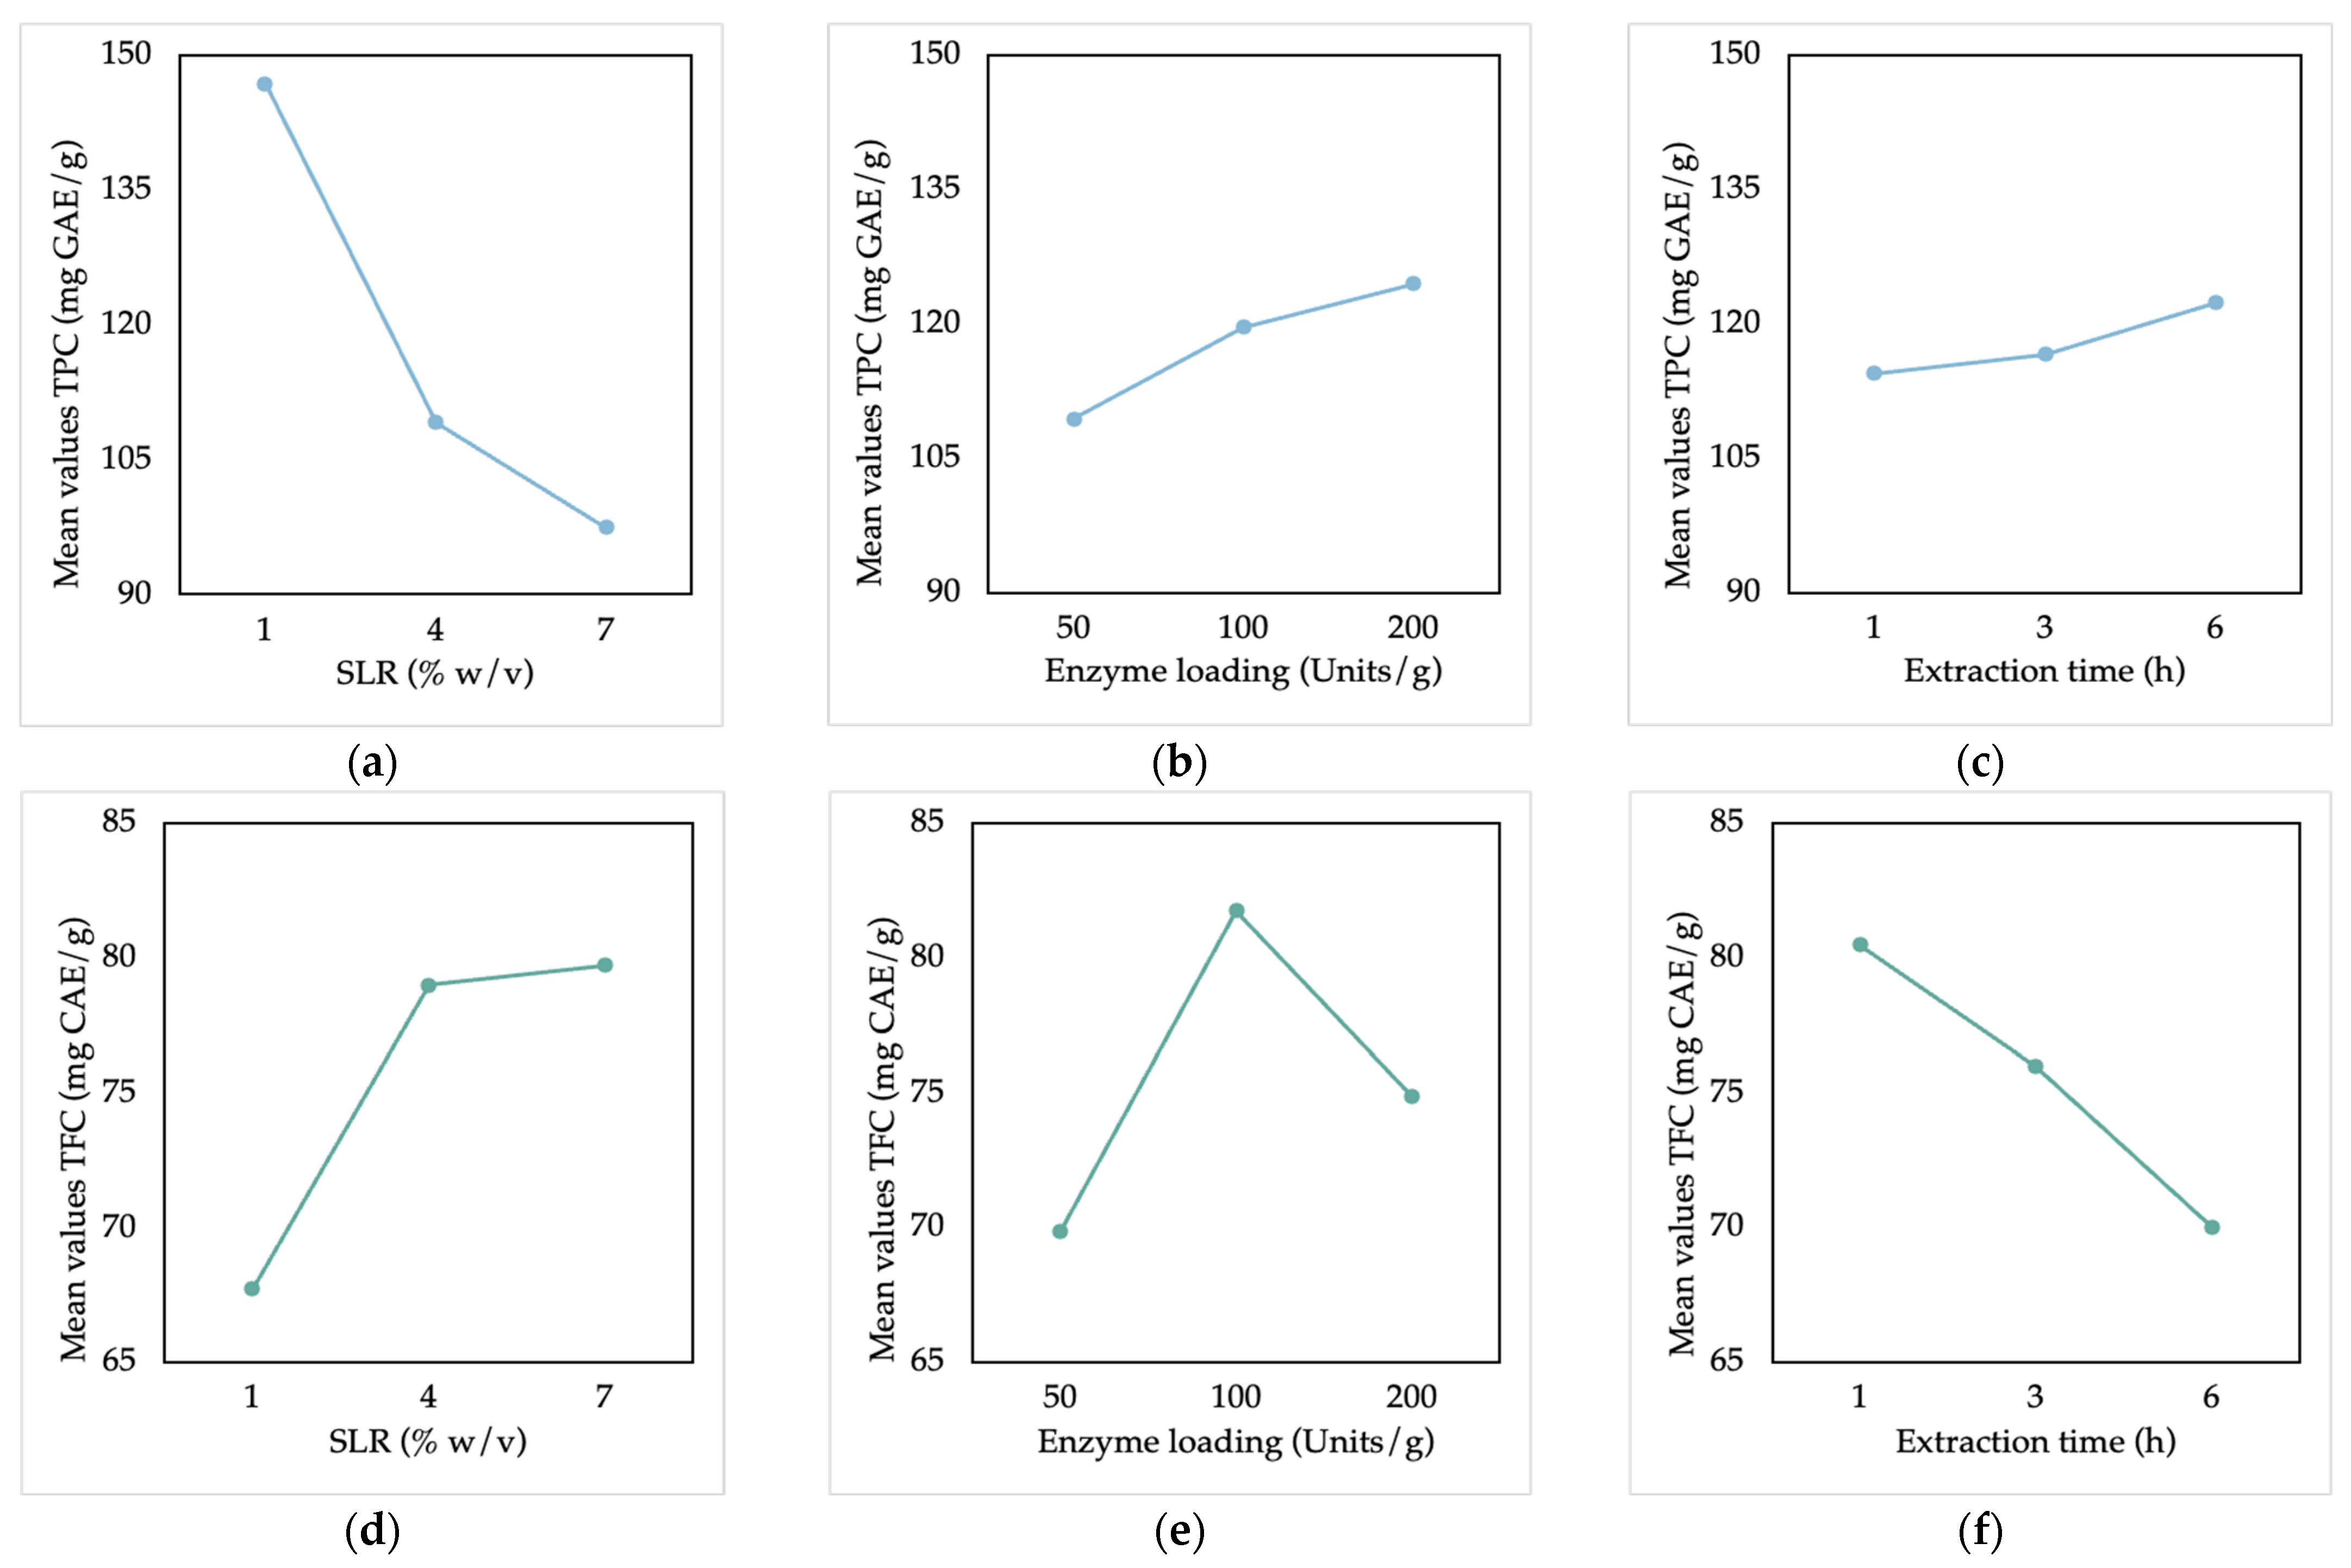
Particularly, a sharp decrease in TPC was observed as the SLR increased from 1% to 7% (w/v) (Figure 3a), indicating that greater solvent availability enhances mass transfer, while excessive solid content may hinder diffusion. Increasing enzyme loading up to 200 units/g resulted in higher TPC (Figure 3b), likely due to the greater number of active sites promoting cell wall degradation and phenolic release. Prolonging extraction time from 1 to 6 h caused a modest rise in TPC (Figure 3c), suggesting that extended incubation facilitates phenolic diffusion until equilibrium is reached [7]. On the contrary, the effect of the SLR on average TFC values appeared to be opposite to that previously observed in phenolic compounds (Figure 3d). Mainly from 1% to 4%, there was a large increase in average TFC, with a further increase in the value of the SLR factor, and saturation seemed to occur. Also, as expected, there was a large increase from 50 to 100 Units/g; however, at 200 Units/g the average values showed a slight decrease (Figure 3e). It is possible that the additional enzyme addition did not cause any change in extraction. Finally, the average TFC decreased with increasing time, possibly due to degradation or oxidation (Figure 3f) [11].

3.2.1. Signal-to-Noise Ratios

Signal-to-noise (S/N) ratios were calculated using the “higher the better” criterion to maximize both responses independently based on Equation (1) (Table 2).
Analysis of the average S/N ratios revealed that the optimal conditions for TPC were solid-to-liquid ratio of 1% w/v, enzyme loading of 100 U/g, and extraction time of 6 h, whereas TFC was maximized at the same enzyme loading, but for solid-to-liquid ratio of 7% w/v and extraction time of 1 h. These results highlight the differential influence of process variables on phenolic versus flavonoid extraction and demonstrate the effectiveness of the Taguchi design in identifying extraction conditions with minimal experimental effort.

3.2.2. Optimization and Confirmation

Optimization was performed to identify the parameter values that maximize both TPC and TFC simultaneously. The optimal conditions were solid-to-liquid ratio of 1% w/v, enzyme loading of 165 Units/g, and extraction time of 2 h. Also, the TPC and TFC data were fitted to the following quadratic models (Equations (3) and (4)).
TPC (mg GAE/g) = 137.5 − 19.76 SLR + 0.360 E + 0.38 t + 1.441 SLR2 − 0.00104 E2 + 0.17 t2
TFC (mg CAE/g) = 41.4 + 6.67 SLR + 0.54 E − 2.49 t − 0.58 SLR2 − 0.002 E2 − 0.06 t2
where SLR is solid-to-liquid ratio (% w/v); E is enzyme loading (Units/g); t is extraction time (h).
Both models showed a good fit, with coefficients of determination R2 of 0.957 and 0.868 for TPC and TFC, respectively. Although, based on the ANOVA results, neither model was statistically significant (p > 0.05), under optimized conditions, the predicted TPC and TFC values (151.7 mg GAE/g and 76.8 mg CAE/g, respectively) closely matched the results of the confirmation experiments (152.9 ± 2.2 mg GAE/g and 67.3 ± 2.8 mg CAE/g). Compared to the results of conventional extraction, EAE of bioactive compounds from Origanum dictamnus L. leaves resulted in approximately 15% higher yields of TPC and TFC, and 12 times lower extraction time.
According to the literature, limited studies have focused specifically on the extraction of TPC from Origanum dictamnus L., while, to our knowledge, none have investigated its TFC. However, Letisou et al. [3] extracted TPC from Origanum dictamnus L. using ultrasound-assisted extraction (10% w/v, 10 min) and obtained approximately 200 mg GAE/g. Nonetheless, their extraction required a 10-fold higher solid-to-liquid ratio to obtain only about 30% higher yield, which may not be cost-effective or sustainable from a process optimization perspective. These findings highlight EAE as a sustainable and reliable approach for maximizing the recovery of bioactive compounds from Origanum dictamnus L.

4. Conclusions

Enzyme-assisted extraction (EAE) using Cellic® CTec3 HS proved more efficient than conventional ethanol–water extraction for extracting bioactive compounds from Origanum dictamnus L. leaves under optimized conditions, demonstrating its potential as a sustainable and effective method for valorizing this medicinal plant.

Author Contributions

Conceptualization, D.M. and T.L.; methodology, D.M. and T.L., software, T.L.; validation, Z.L. and R.K.L.; formal analysis, Z.L. and R.K.L.; investigation, R.K.L.; resources, D.M.; data curation, Z.L. and R.K.L.; writing—original draft preparation, Z.L.; writing—review and editing, D.M. and T.L.; supervision, D.M. and T.L. All authors have read and agreed to the published version of the manuscript.

Funding

This research received no external funding.

Data Availability Statement

Data are contained within the article.

Acknowledgments

The authors would like to thank Novozymes A/S, Denmark for generously providing the enzyme preparation used in the present study.

Conflicts of Interest

The authors declare no conflicts of interest.

Abbreviations

The following abbreviations are used in this manuscript:
EAEEnzyme-assisted extraction
TPCTotal phenolic content
TFCTotal flavonoid content
GAEGallic acid equivalents
CAECatechin equivalents
S/NSignal-to-noise ratio
SLRSolid-to-liquid ratio

References

  1. Liolios, C.C.; Graikou, K.; Skaltsa, E.; Chinou, I. Dittany of Crete: A Botanical and Ethnopharmacological Review. J. Ethnopharmacol. 2010, 131, 229–241. [Google Scholar] [CrossRef] [PubMed]
  2. Solomou, A.D.; Fountouli, A.; Molla, A.; Petrakis, M.; Manolikaki, I.; Skoufogianni, E. Ecology, Cultivation, and Utilization of the Dittany of Crete (Origanum dictamnus L.) from Ancient Times to the Present: A Short Review. Agronomy 2024, 14, 1066. [Google Scholar] [CrossRef]
  3. Letsiou, S.; Trapali, M.; Vougiouklaki, D.; Tsakni, A.; Antonopoulos, D.; Houhoula, D. Antioxidant Profile of Origanum dictamnus L. Exhibits Antiaging Properties against UVA Irradiation. Cosmetics 2023, 10, 124. [Google Scholar] [CrossRef]
  4. da Silva, R.F.; Carneiro, C.N.; Cheila, C.B.; Gomez, F.J.V.; Espino, M.; Boiteux, J.; de los, Á.; Fernández, M.; Silva, M.F.; de S. Dias, F. Sustainable Extraction Bioactive Compounds Procedures in Medicinal Plants Based on the Principles of Green Analytical Chemistry: A Review. Microchem. J. 2022, 175, 107184. [Google Scholar] [CrossRef]
  5. Nadar, S.S.; Rao, P.; Rathod, V.K. Enzyme Assisted Extraction of Biomolecules as an Approach to Novel Extraction Technology: A Review. Food Res. Int. 2018, 108, 309–330. [Google Scholar] [CrossRef] [PubMed]
  6. Lemoni, Z.; Kalantzi, S.; Lymperopoulou, T.; Tzani, A.; Stavropoulos, G.; Detsi, A.; Mamma, D. Optimization of Bioactive Compounds Extraction from Rosa canina L. Pseudofruit through the Action of Two Hydrolytic Enzyme Preparations. J. Chem. Technol. Biotechnol. 2025, 1–14. [Google Scholar] [CrossRef]
  7. Gligor, O.; Mocan, A.; Moldovan, C.; Locatelli, M.; Crișan, G.; Ferreira, I.C.F.R. Enzyme-Assisted Extractions of Polyphenols—A Comprehensive Review. Trends Food Sci. Technol. 2019, 88, 302–315. [Google Scholar] [CrossRef]
  8. Lemoni, Z.; Kalantzi, S.; Lymperopoulou, T.; Tzani, A.; Stavropoulos, G.; Detsi, A.; Mamma, D. Kinetic Modeling and Biological Activities of Rosa canina L. Pseudo-Fruit Extracts Obtained via Enzyme-Assisted Extraction. Antioxidants 2025, 14, 558. [Google Scholar] [CrossRef] [PubMed]
  9. Meena, K.; Kumar, A.; Pandya, S.N.; Pandya, S.N. Optimization of Friction Stir Processing Parameters for 60/40 Brass Using Taguchi Method. Mater. Today Proc. 2017, 4, 1978–1987. [Google Scholar] [CrossRef]
  10. Idris, F.N.; Nadzir, M.M.; Abd Shukor, S.R. Optimization of Solvent-Free Microwave Extraction of Centella Asiatica Using Taguchi Method. J. Environ. Chem. Eng. 2020, 8, 103766. [Google Scholar] [CrossRef]
  11. Biesaga, M. Influence of Extraction Methods on Stability of Flavonoids. J. Chromatogr. A 2011, 1218, 2505–2512. [Google Scholar] [CrossRef] [PubMed]
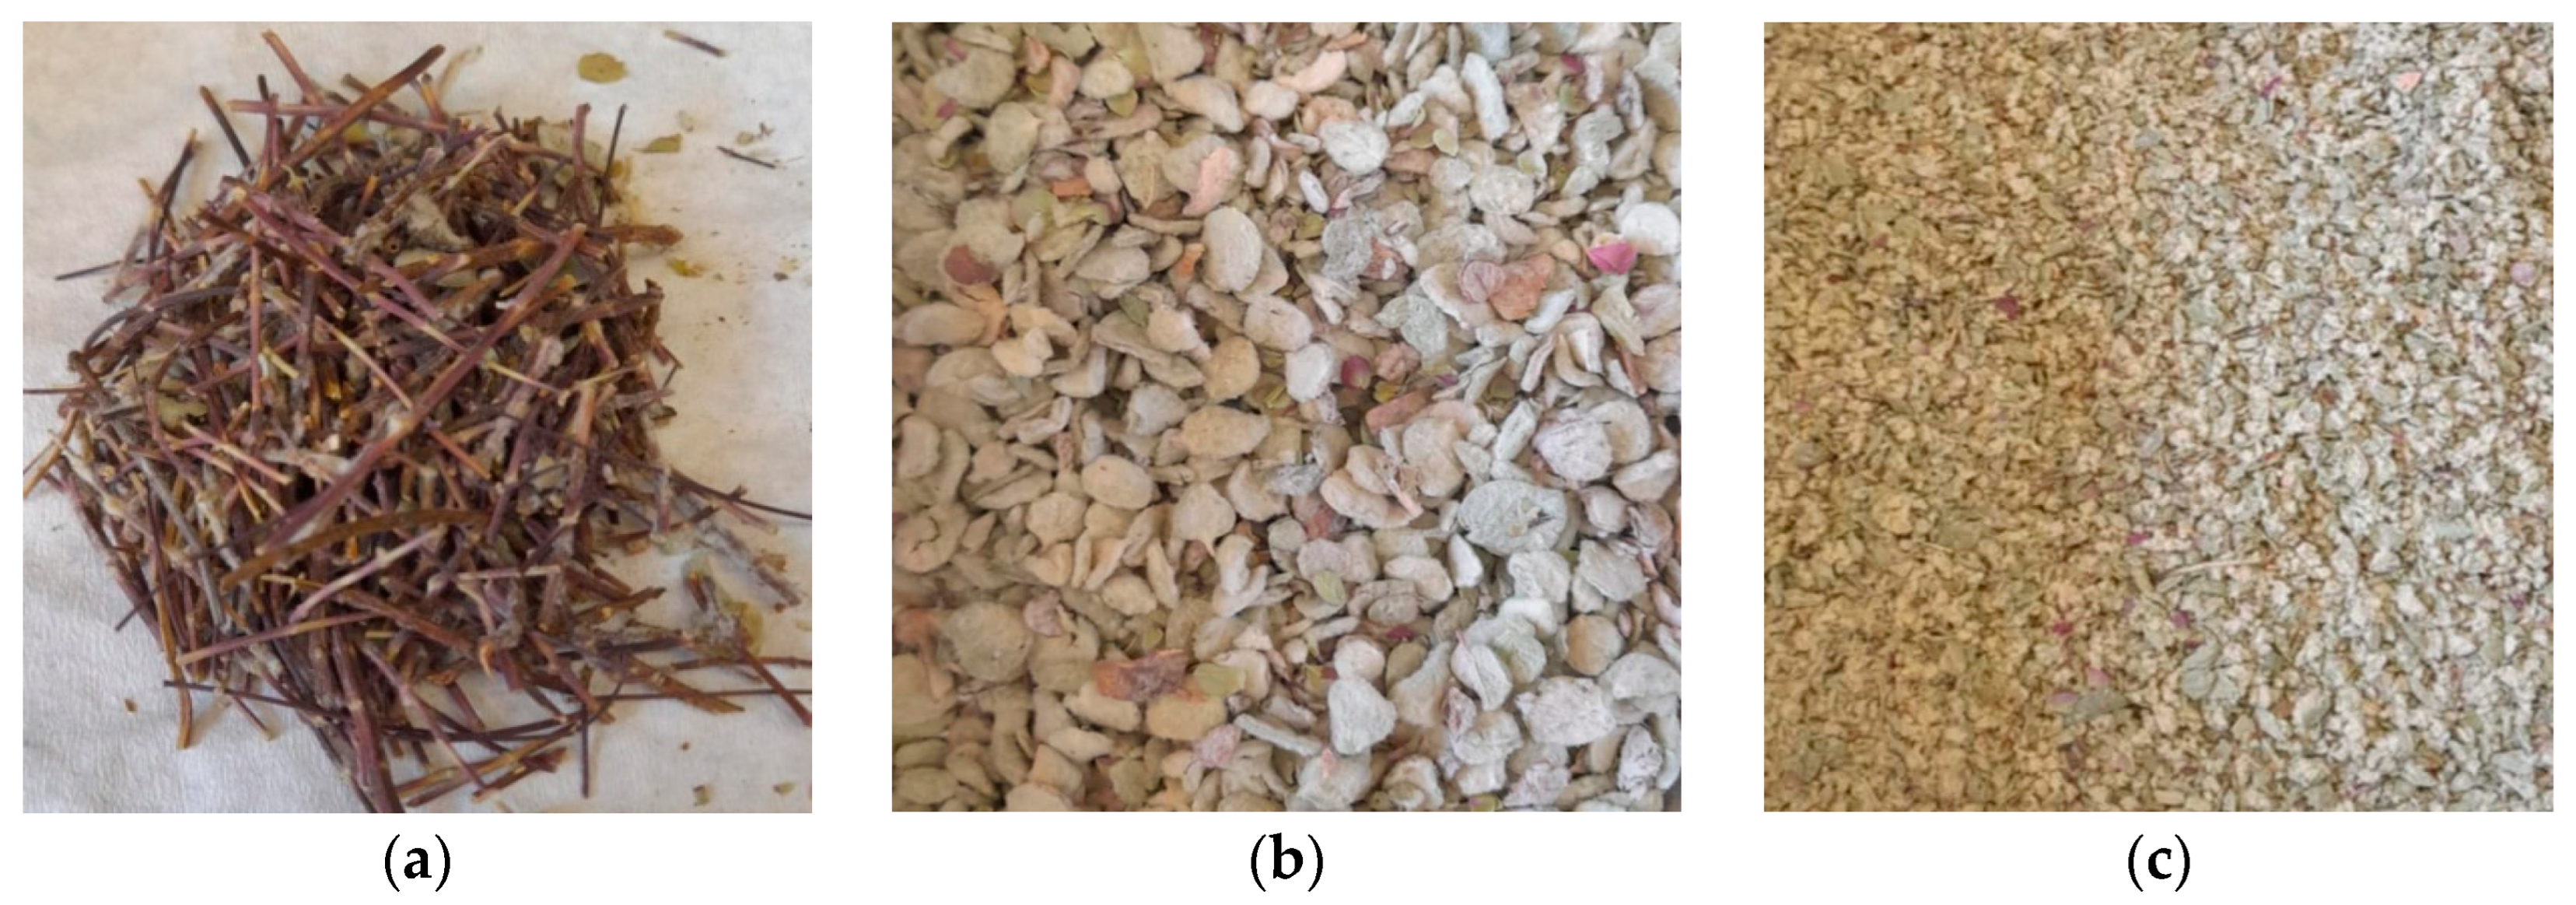
Figure 1. Stages of preparation of the plant material: (a) removal of branches, (b) selection of leaves, (c) cutting of the final.
Engproc 117 00002 g001
Figure 2. Total phenolic content (TPC) and total flavonoid content (TFC) results from conventional extraction of Origanum dictamnus L. leaves. The values are presented as mean values ± SD.
Engproc 117 00002 g002
Figure 3. Main effects of factors on the mean values of the total phenolic content (TPC) (ac) and total flavonoid content (TFC) (df) from EAE of Origanum dictamnus L. leaves.
Engproc 117 00002 g003
Table 1. Results of total phenolic content (TPC) and total flavonoid content (TFC) of Taguchi.
A/ASolid to
Liquid Ratio
(% w/v)
Enzyme
Loading (Units/g)
Extraction Time
(h)
TPC
(mg GAE/g)
TFC
(mg CAE/g)
11501131.6 ± 2.862.5 ± 6.1
211003144.2 ± 0.677.5 ± 6.6
312006164.8 ± 5.263.2 ± 5.6
44503106.2 ± 2.875.4 ± 0.8
541006112.0 ± 2.475.2 ± 2.9
642001109.3 ± 3.686.4 ± 5.1
7750690.3 ± 5.271.7 ± 2.4
871001102.6 ± 7.492.5 ± 5.7
97200399.4 ± 0.775.0 ± 3.1
Table 2. Signal-to-noise (S/N) ratios for TPC and TFC.
RunS/N TPCS/N TFC
142.3835.92
243.1837.78
344.3436.01
440.5237.55
541.0037.53
640.7738.73
739.1137.11
840.2239.32
939.9537.50
Disclaimer/Publisher’s Note: The statements, opinions and data contained in all publications are solely those of the individual author(s) and contributor(s) and not of MDPI and/or the editor(s). MDPI and/or the editor(s) disclaim responsibility for any injury to people or property resulting from any ideas, methods, instructions or products referred to in the content.