1. Introduction
The logistics sector is a critical component of the global economy, responsible for the seamless movement of goods from suppliers to consumers. Traditional logistics systems have often been plagued by inefficiencies, delays, and a lack of real-time data, leading to increased costs and customer dissatisfaction. From the era of telephones to wireless phones and now talking about interconnected devices and things, the evolution of technology has been massive. One technology that has shown promise in terms of increasing the efficacy and efficiency of logistics operations is the Internet of things, also known as IoT [
1]. In the contemporary era of globalization and rapid technological advancement, the logistics industry is undergoing a transformative phase, driven by the integration of the Internet of Things (IoT). The advent of IoT technology offers a promising solution to these challenges by enabling better visibility, predictive analytics, and automation throughout the supply chain. The Internet of Things is defined as interconnected devices that include sensors, networks, software, and hardware that collect, analyze, and send/share information [
1]. The IoT, characterized by its ability to connect everyday objects through the Internet, has the potential to revolutionize logistics by enhancing efficiency, transparency, and responsiveness.
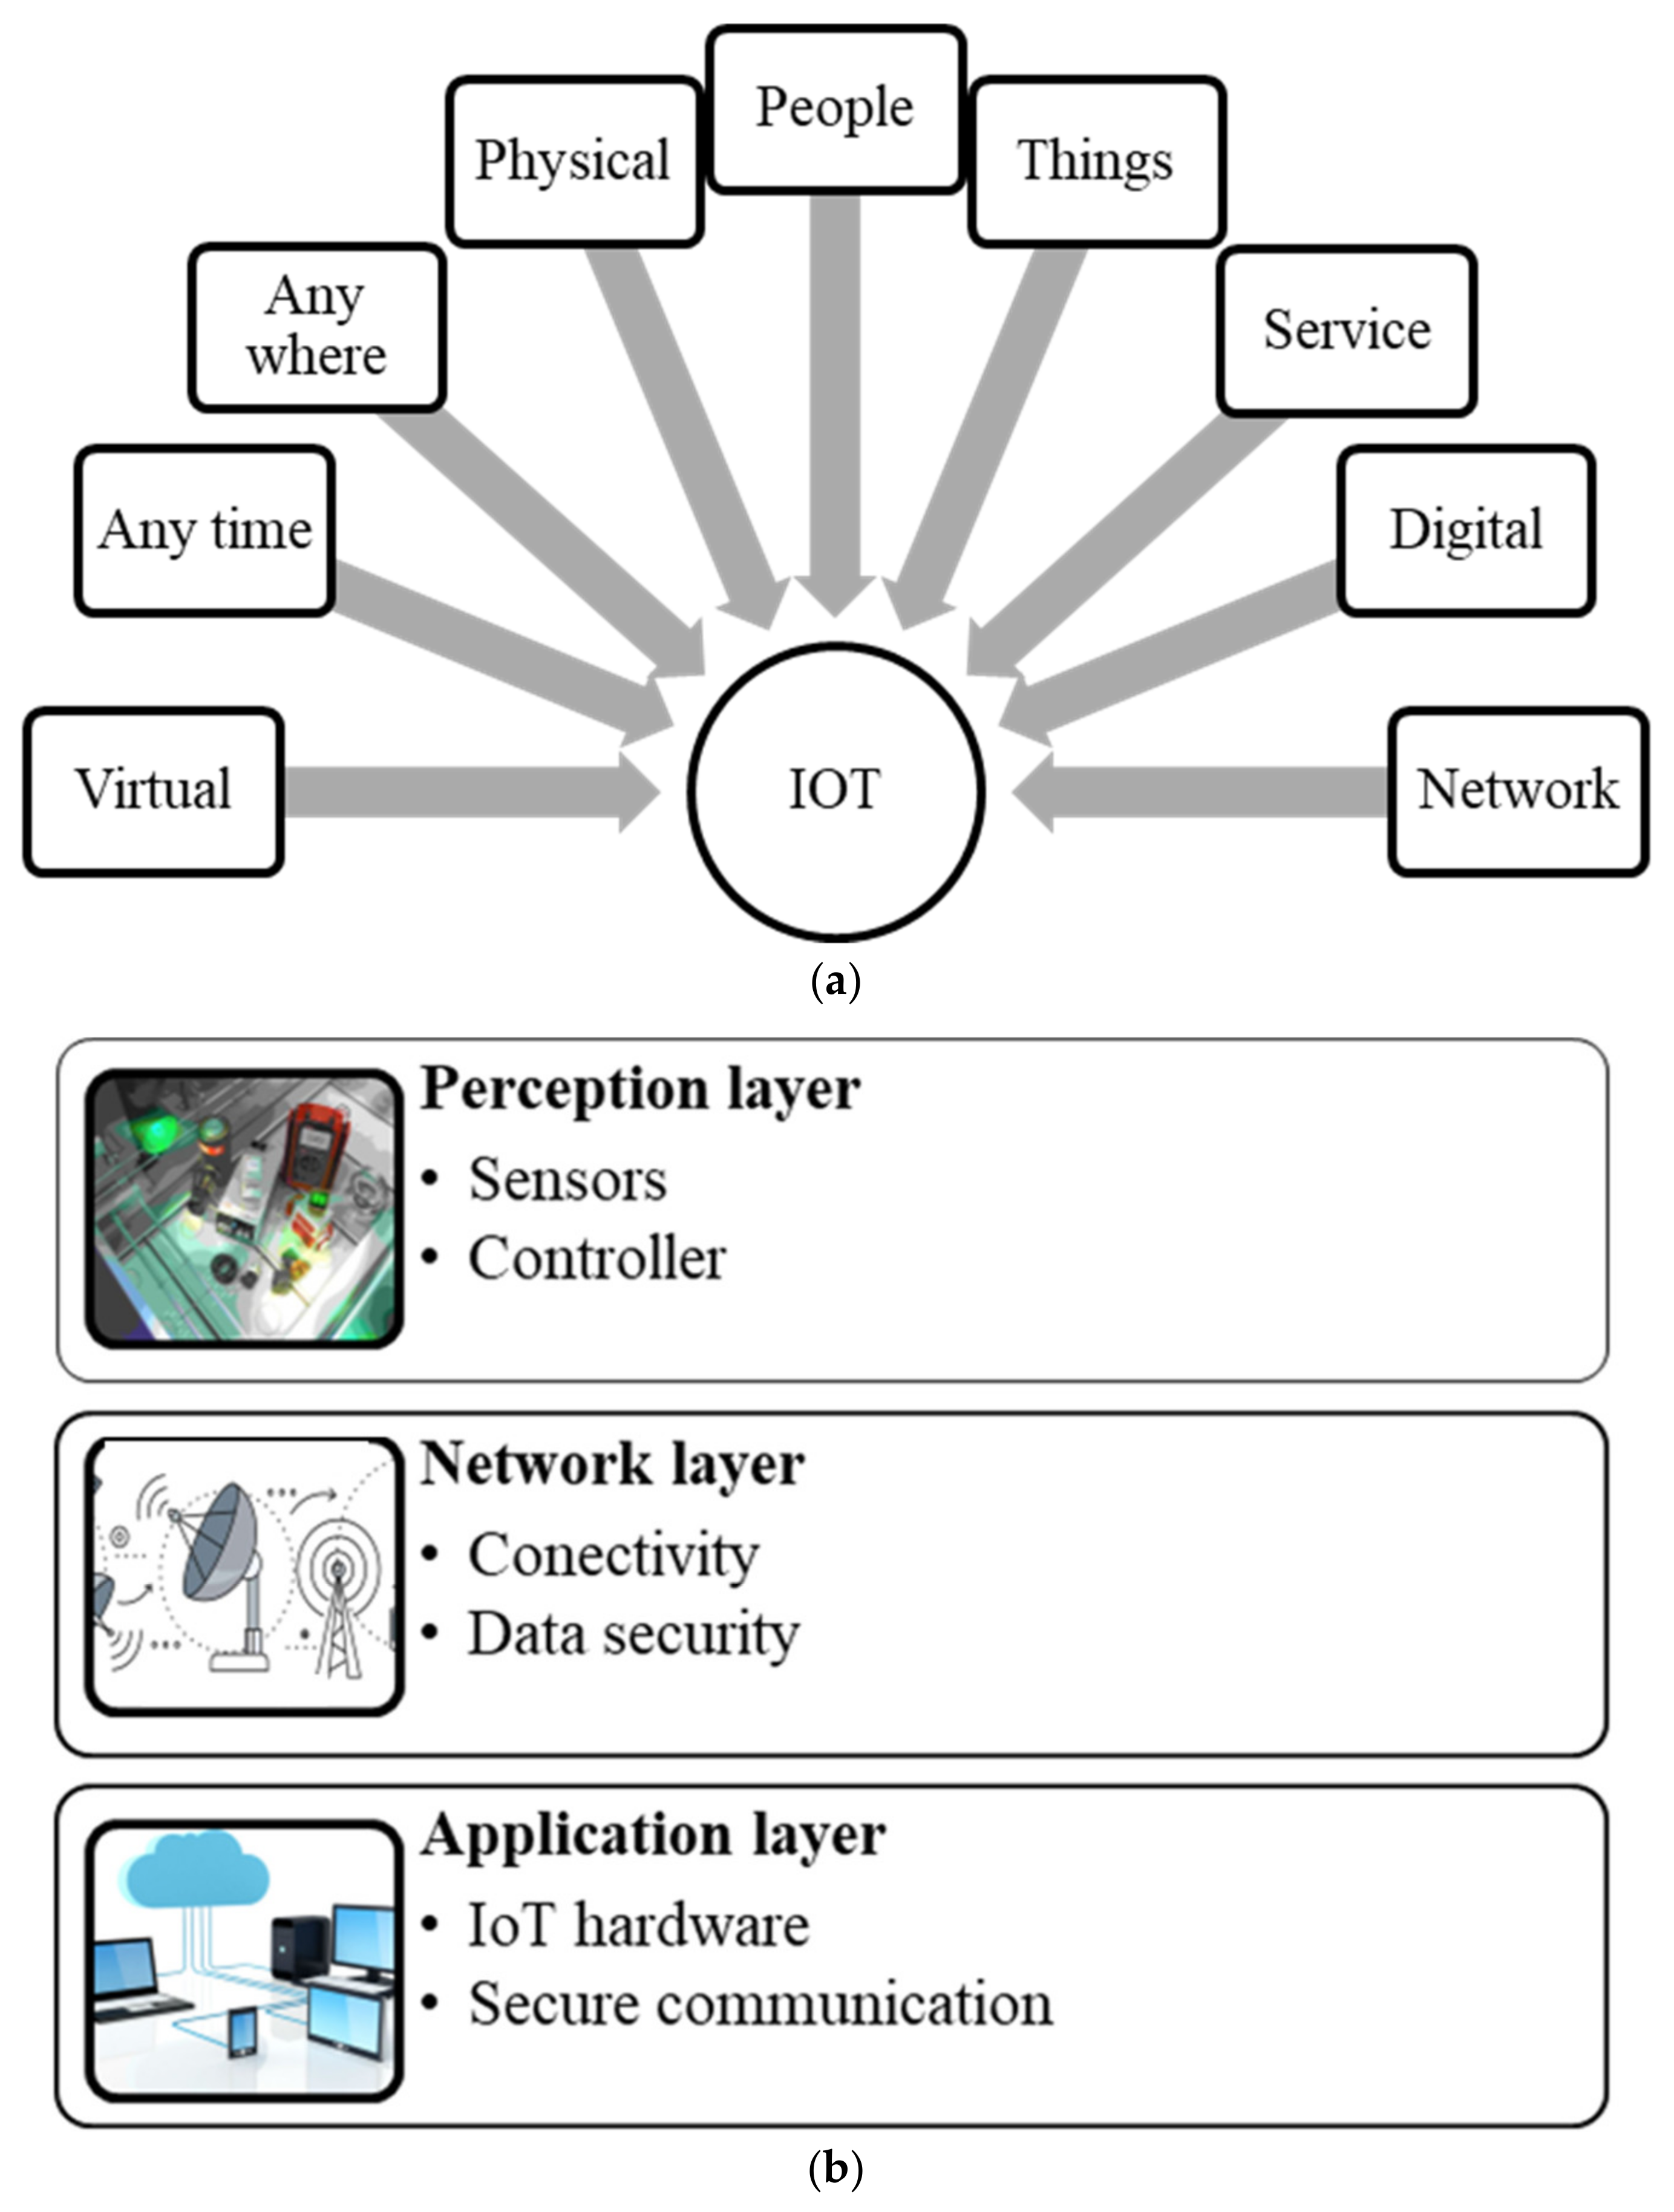
Figure 1 shows the Internet of Things with its related entities and architecture base. As evident in Fig. 1a, IoT has various entities such as people, service, digital etc. related to its characteristics and applications. Having an experienced materials management partner can protect parts from expiration, damage, and theft, minimizing the need for costly replacements and repairs. This highlights the importance of having reliable logistics processes in place.
There has been a significant shift in the way businesses operate in the past decade, with continued improvements in the operations of companies. In recent years, companies have been incorporating digital technologies into their day-to-day operations [
2]. This enables companies to be more sensitive to and aware of what is happening around them. The concept of sensing enterprises works hand in hand with the Internet of Things, which is a big tool in intelligent systems. As explained above, the Internet of Things allows for interaction between humans and things; in fact, in recent times, connections between things have become possible.
The integration of logistics and information systems technology in the forms of hardware, software, telegrams, and databases influences a greater improvement in an organization’s supply chain. In the manufacturing world, a large number of organizations are using smart warehouses to supply their production lines with raw materials. This increases accuracy in terms of timing and the use of the right materials at the right stations, further enhancing the quality of processes and products while increasing the competitiveness of organizations. Thus, quality has become the scale of completeness in global business rankings, placing the focus on quality improvement for the survival of organizations.
The IoT is critical to making any system smarter and more intelligent [
3]. It consists of interconnected devices that include sensors, networks, software, and hardware that collect, analyze, and send/share information [
1]. The idea of the Internet of Things is to trigger communication between devices and things all around us with little to no human intervention. As shown in
Figure 1b, the architectural base of the IoT has three layers: a perception/insight layer; a network/Web layer; and, lastly, an application layer [
4].
Several studies have explored the use of the IoT in areas such as inventory management, warehouse operations, and transportation, but limited studies exist on the line supply process.
The IoT can be used to improve inventory management by providing real-time data on inventory levels and location. An important past study explored the use of the IoT in inventory management for a pharmaceutical supply chain [
5]. The study investigated an IoT-enabled supply chain to deliver drugs to customers, with measures in place to detect counterfeit drugs, maintain accurate location information from the warehouse to the delivery destination, and monitor the temperature and humidity of drug packets. The use of the IoT was explored in warehouse management for an e-commerce company [
6]. The study found that IoT-enabled devices could improve efficiency by reducing the time required for inventory checks and by improving the accuracy of order picking. The IoT can also be used to optimize transportation processes by providing real-time data on the location and status of shipments. It is believed that the IoT types of Industry 4.0 technologies have the potential to empower manufacturing enterprise to achieve sustainability objectives [
7]. IoT interventions ensure a real-time logistics system, with integration of technologies such as RFID, Bluetooth, etc. with higher visibility and better traceability [
8]. To monitor and maintain the quality of products in storage, an IoT-based cargo monitoring system was introduced [
9]. Such a system was found to be effective in controlling the storage conditions and achieved good customer satisfaction. A smart logistics warehouse management system was also successfully implemented, and an increase in order-picking accuracy was achieved, as well as improved productivity and efficiency [
10].
Industry 4.0 technologies can notably improve logistics management with the enhancement of information flow, which can bring about further improvements in contract negotiation, the tracking of products, logistics information quality, the transfer of information, and network traffic [
11]. Information technology in smart logistics consists of technologies used for sensing, disseminating, analyzing, forecasting, and processing logistics information [
12]. Something as small as a glass of water can be connected and tracked by the IoT through the use of a sensor or a tag [
13].
As the world evolves, human errors continue to increase, and manual procedures, on their own, are no longer reliable. The manual processes of supplying parts to the line are not reliable and have a considerable effect on production volume.
In the present case of a multinational automotive company (which we refer to as ABC company), the manual logistics process was causing a lot of late deliveries, wrong de-liveries, and line stoppages, which compelled management to convert the manual call-off process to a fully system-controlled process. The aim of the research reported in this work was to introduce a centralized Internet of Things system into logistics and warehouse processes by implementing system-controlled warehouse call-offs and scheduling processes and to evaluate the effect of information systems on overall improvement and efficiency. The re-search is based on the implementation of the Internet of Things in logistics processes by introducing system-controlled warehouse call-offs and scheduling processes, with the aim of reducing manual logistics line supply issues such as late supply, the supply of incorrect parts, and the supply of parts to incorrect stations, which can lead to line stoppages and the use of incorrect parts production.
The research intends to implement system-controlled warehouse call-offs and scheduling processes to reduce line stoppages caused by late and incorrect part delivery to the line and improve the overall efficiency of line supply routes. These goals can be achieved by reducing hot call-offs, emergency call-offs released without enough time for preparation, which need to be prepared as fast as possible to avoid line stoppages. The following are the major objectives of the present work:
To implement system-controlled warehouse call-offs and scheduling processes;
To improve the efficiency of line supply routes;
To introduce a takted warehouse process;
To reduce line stoppages caused by late and incorrect part delivery to the line.
2. Methodology
The research method of this study is structured on the basis of finding the answers to the research questions. The raised research questions are structured in a way that opens possibilities for a mixed-method study. The mixed method is defined by Creswell as a method that uses a strategy of enquiry involving data collection techniques that work either concurrently or consecutively for the best comprehension of the research questions and problems. The collection of data in the mixed method entails collecting both text and numeric data to ensure that the database comprises qualitative and quantitative data. Under the technique used in this study, neither dominated; rather, qualitative and quantitative data were evenly distributed [
14]. The use of the mixed method is preferred because it provides in-depth analysis and enhances validity and reliability through triangulation; qualitative feedback provides context for quantitative data, and quantitative analysis supports qualitative observations with empirical evidence. This integration of numerical data with personal narratives offers a holistic perspective, informing effective analysis through data collection and process observation.
Primary data are gathered through trial-based process introductions, capturing employee participation. Initially, the theory of IoT in logistics is covered, followed by the implementation and trial of smart logistics strategies. A comparison is then made between manual and automated processes.
- (a)
Qualitative Data
Process Observation: Observations before and after implementation to assess the need for change and any differences.
Discussions: Brief discussions with stakeholders, including associates, IT personnel, and process specialists.
Document Analysis: Review of available data and documents to understand the current process.
- (b)
Quantitative Data
Industrial Engineering Tools: Tools like Pareto charts, cause-and-effect diagrams, and histograms for analysis of performance before and after IoT implementation. FMEA and fishbone diagrams are used for risk identification and predictive problem solving.
Time and Motion Studies: Used to compare logistics process improvements before and after IoT implementation.
Statistical Data Analysis: Company data are analyzed to quantify the impact of IoT implementation on logistics processes.
The data gathered in the current study was analyzed using both qualitative and quantitative approaches. The collected quantitative data was analyzed using coding and thematic analysis in a bid to establish the various patterns and themes. Quantitative data was analyzed using statistical tests on the efficiency, accuracy, and cost/benefits of the IoT implementation. In addition, the following tools were used:
2.1. Failure Mode and Effects Analysis
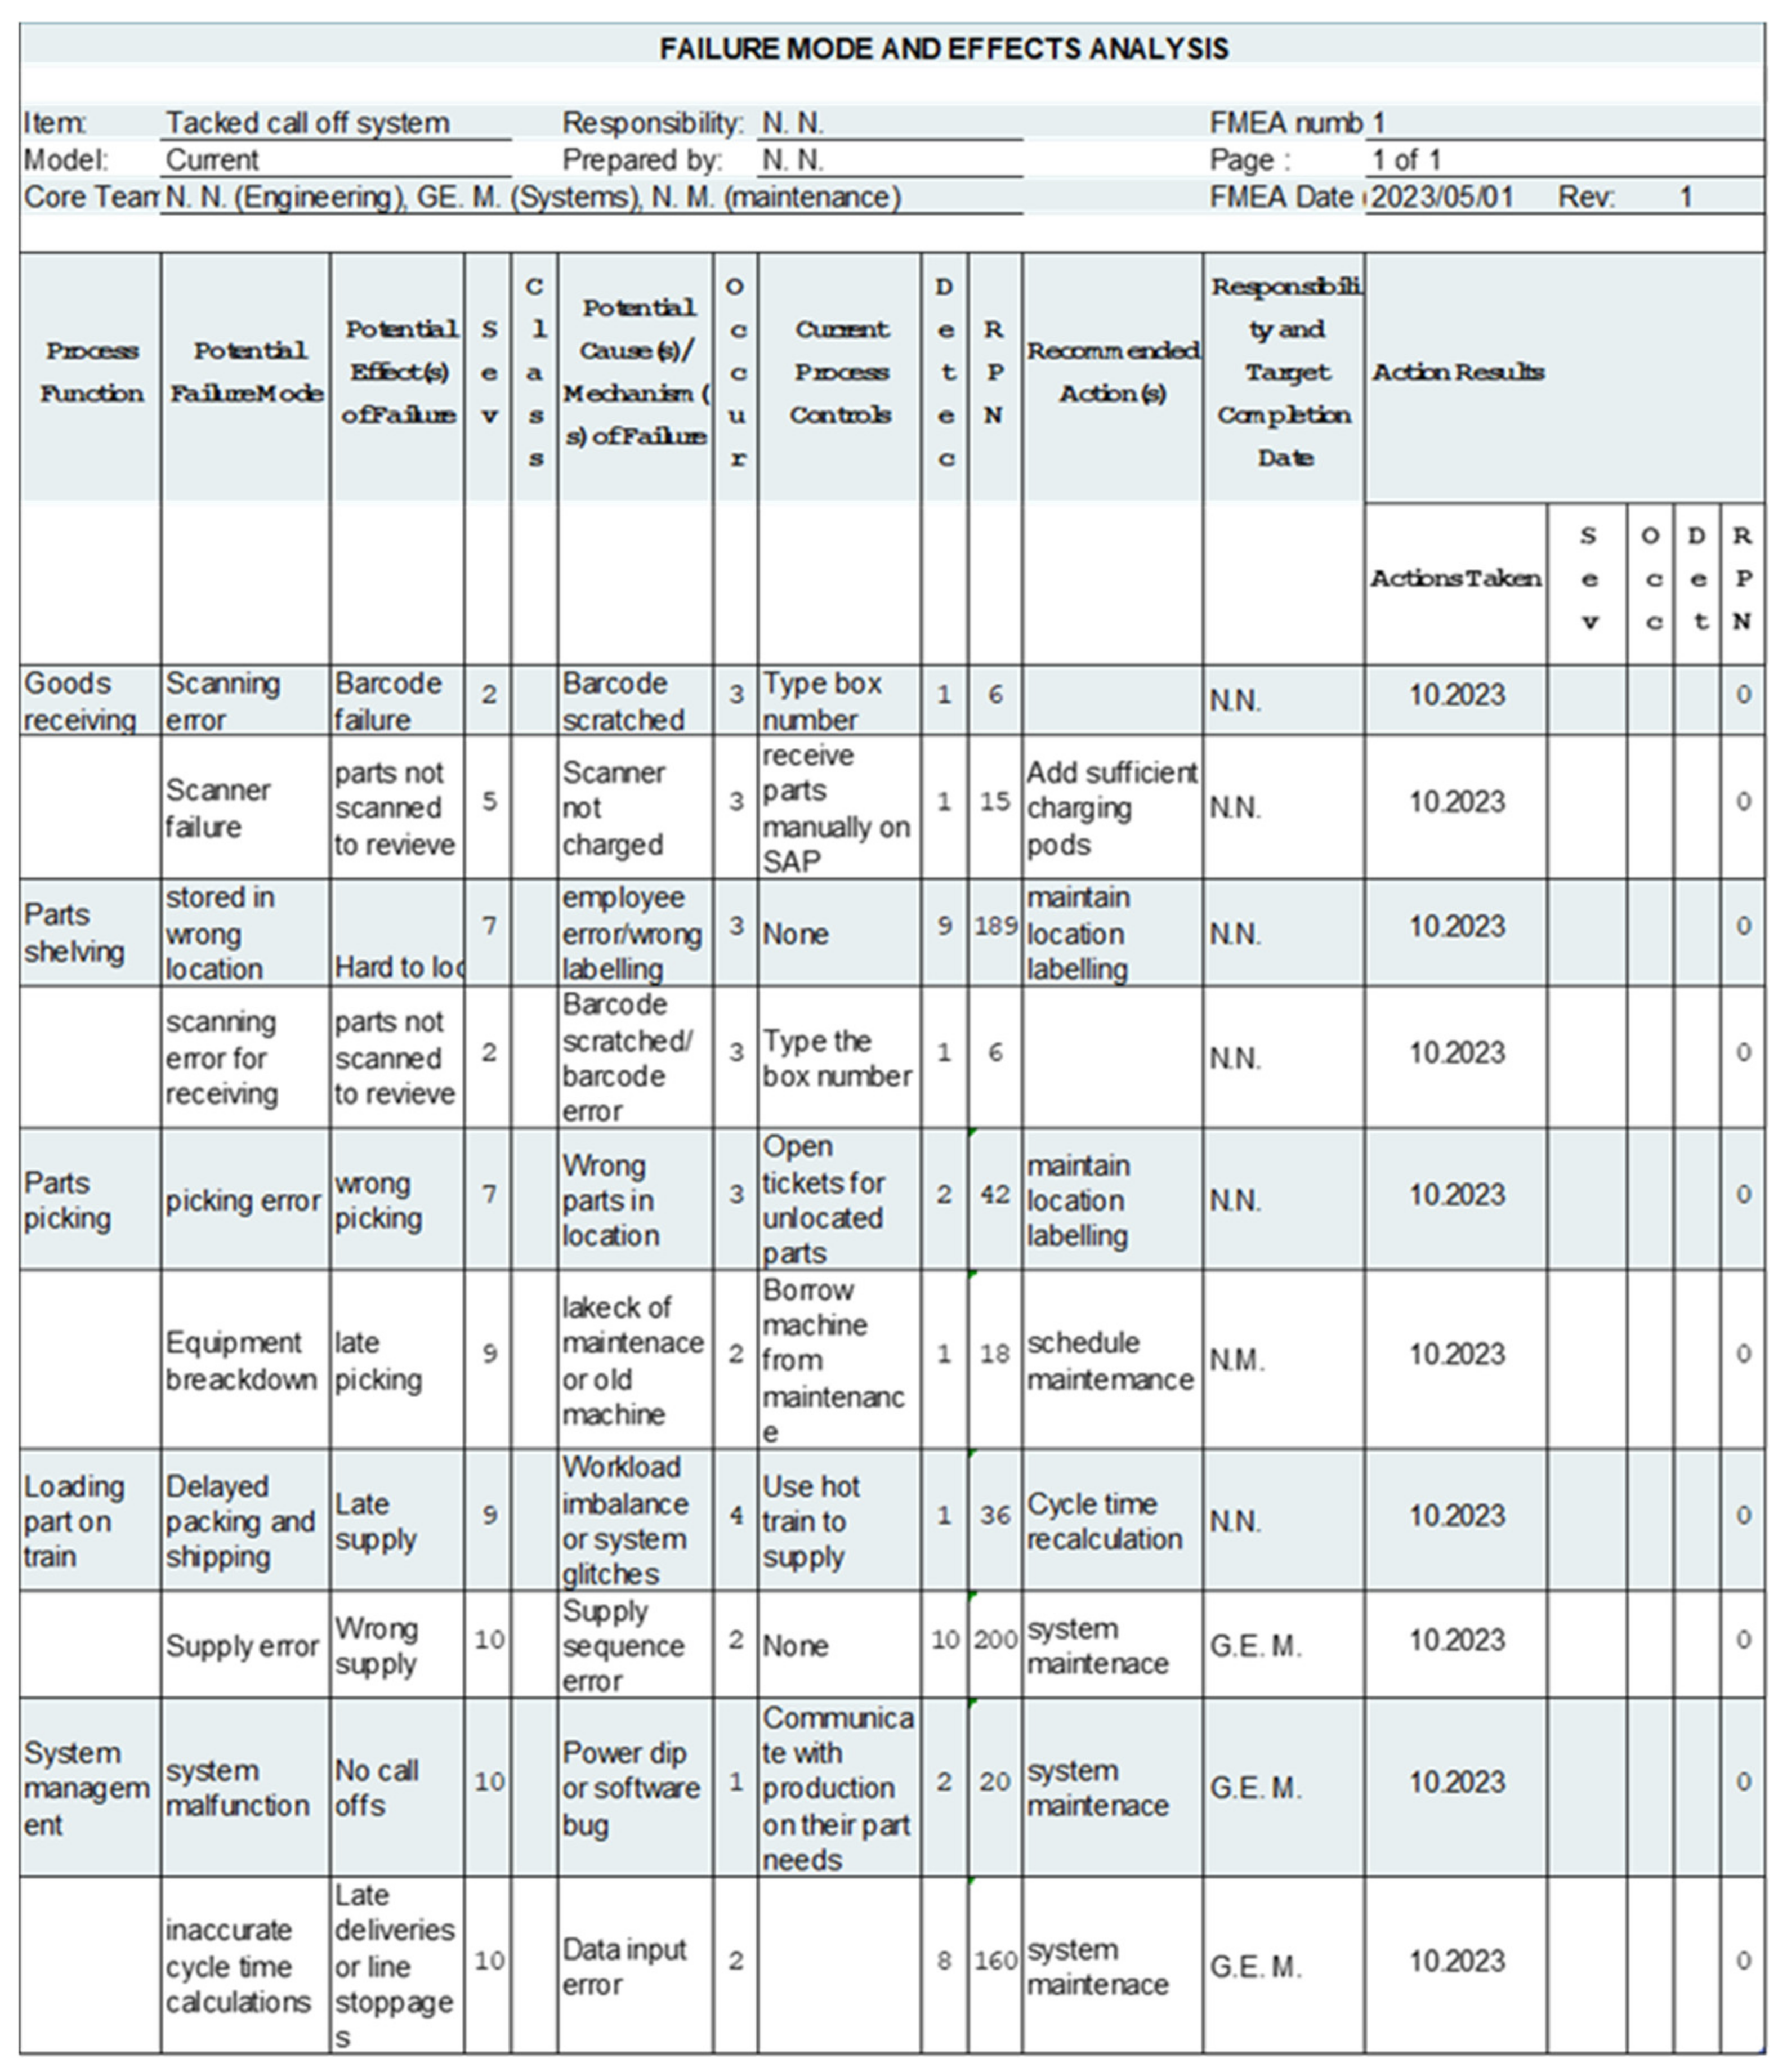
Creating a Failure Modes and Effects Analysis (FMEA) for a system-controlled takted warehouse process can help identify potential failure modes, as well as their causes and effects and the corresponding risk prioritization. This can, in turn, help company ABC be ready for anything post implementation.
Figure 2 shows an FMEA performed by company ABC to analyze the potential failures that the new system will come with.
2.2. Problem Solving
While in the process of performing a failure mode and effect analysis, company ABC used a problem-solving tool to help them dig deep and discover the root cause of potential failures that their new system might be exposed to. Below are a few scenarios that were looked into using problem-solving tools.
- (a)
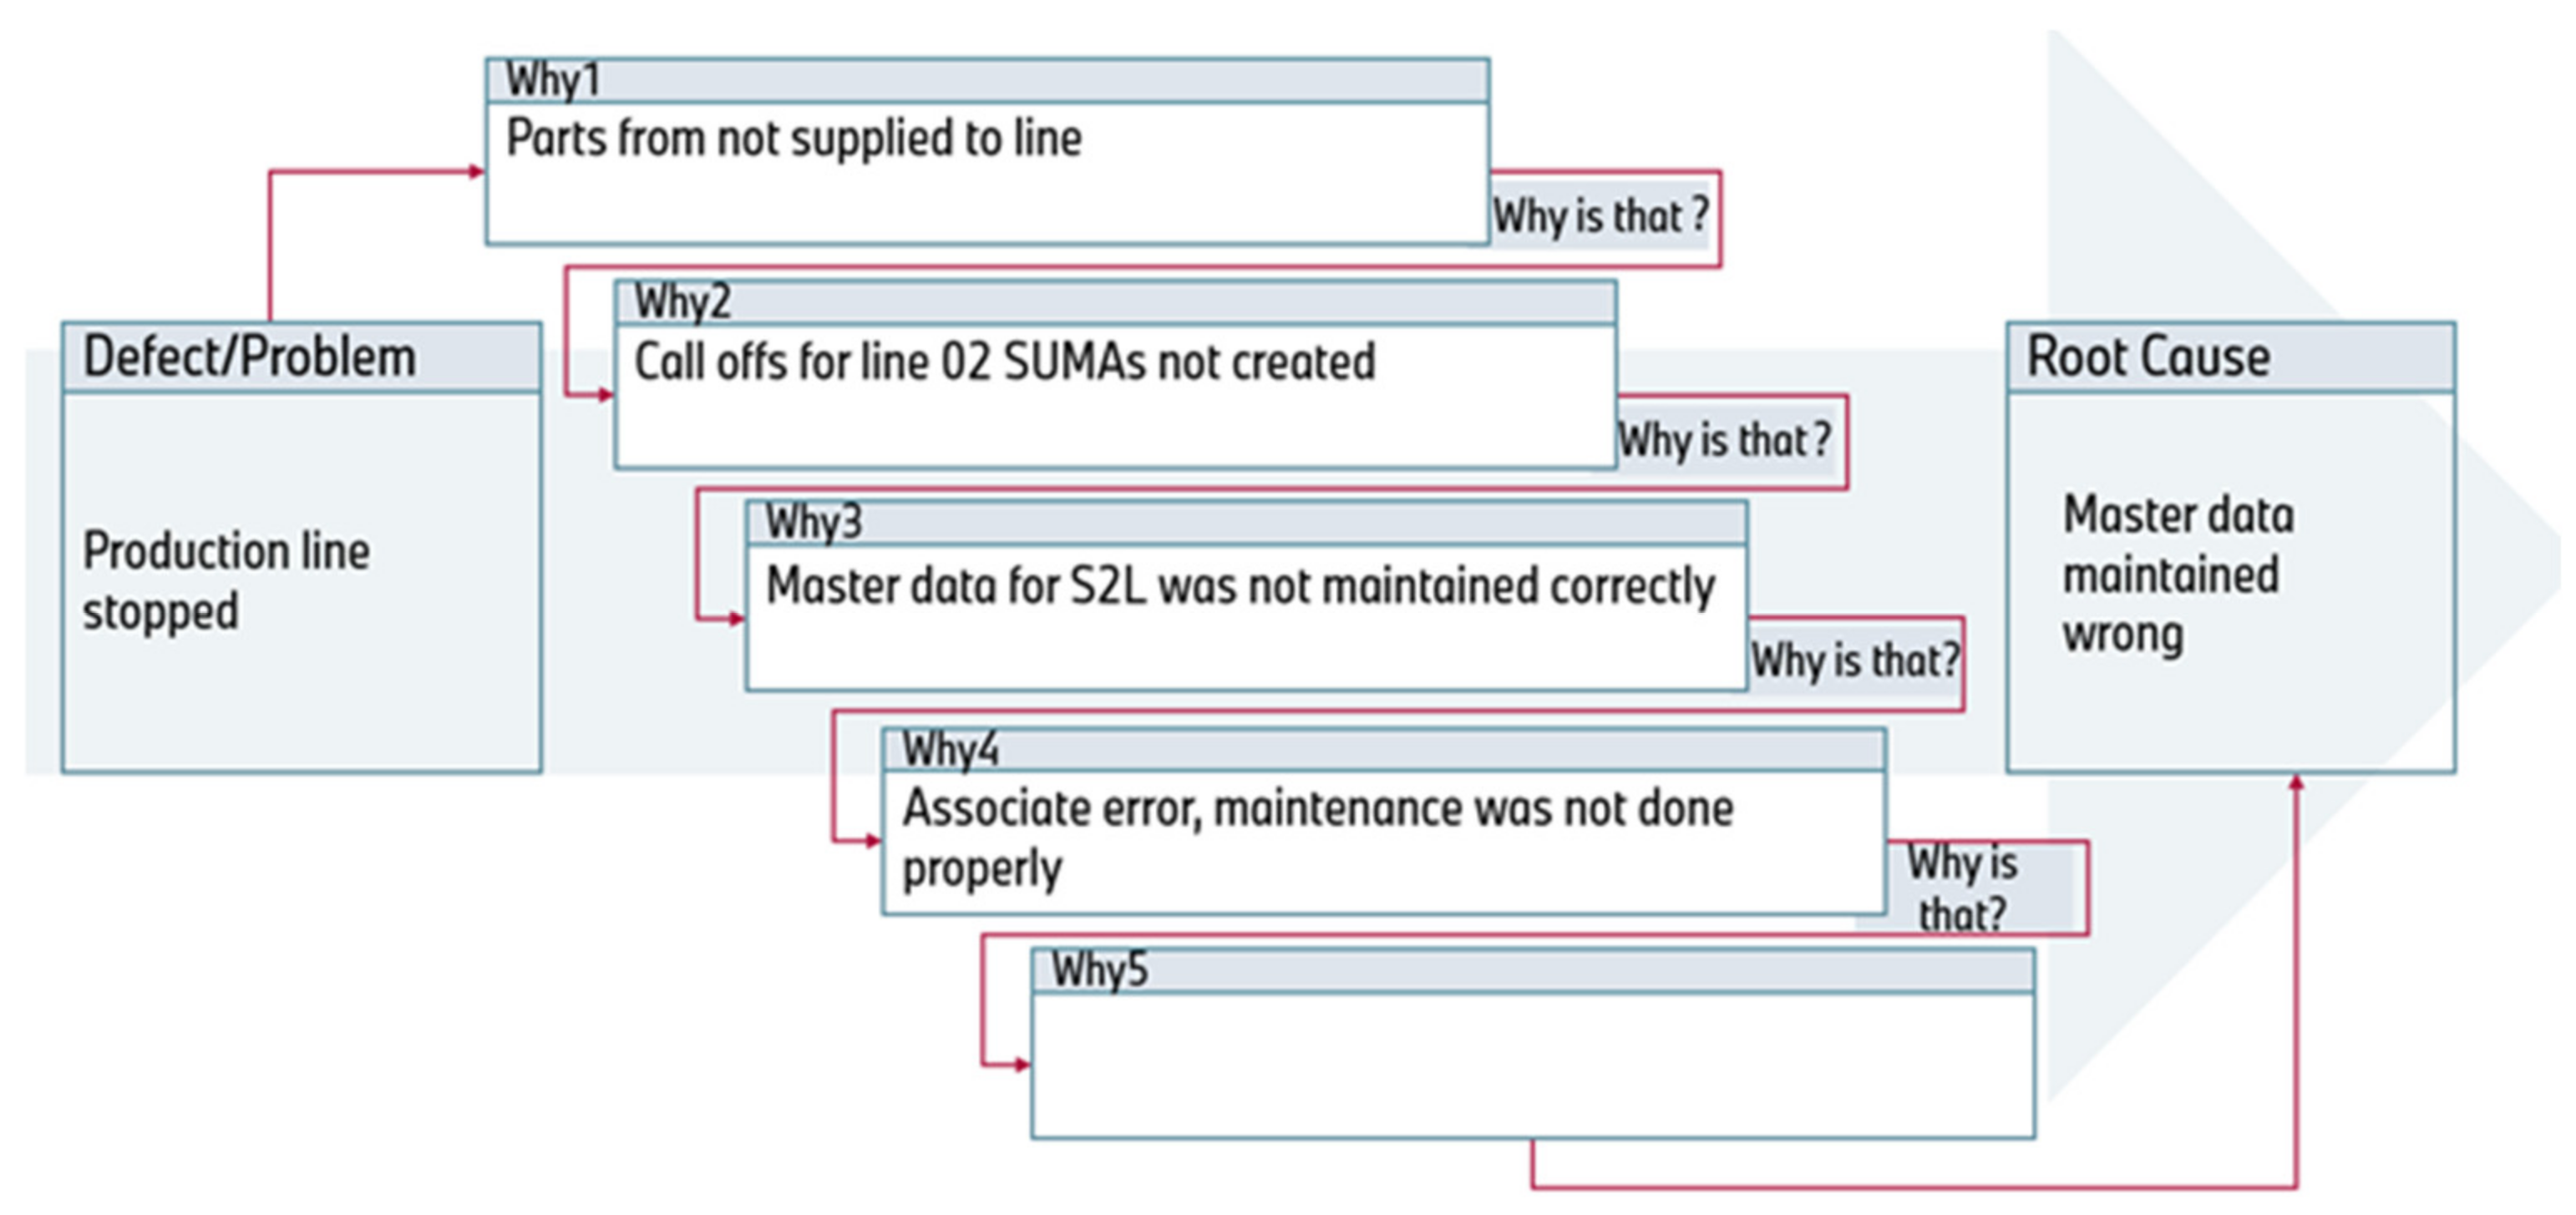
‘5 Whys’: This is an interrogative technique that is very interactive, with the aim of exploring the effects of a particular problem. This process asks “why” repeatedly in order to determine more than the obvious causes of a problem.
Figure 3 shows the ‘5 Whys’ analysis for production line stoppages.
- (b)
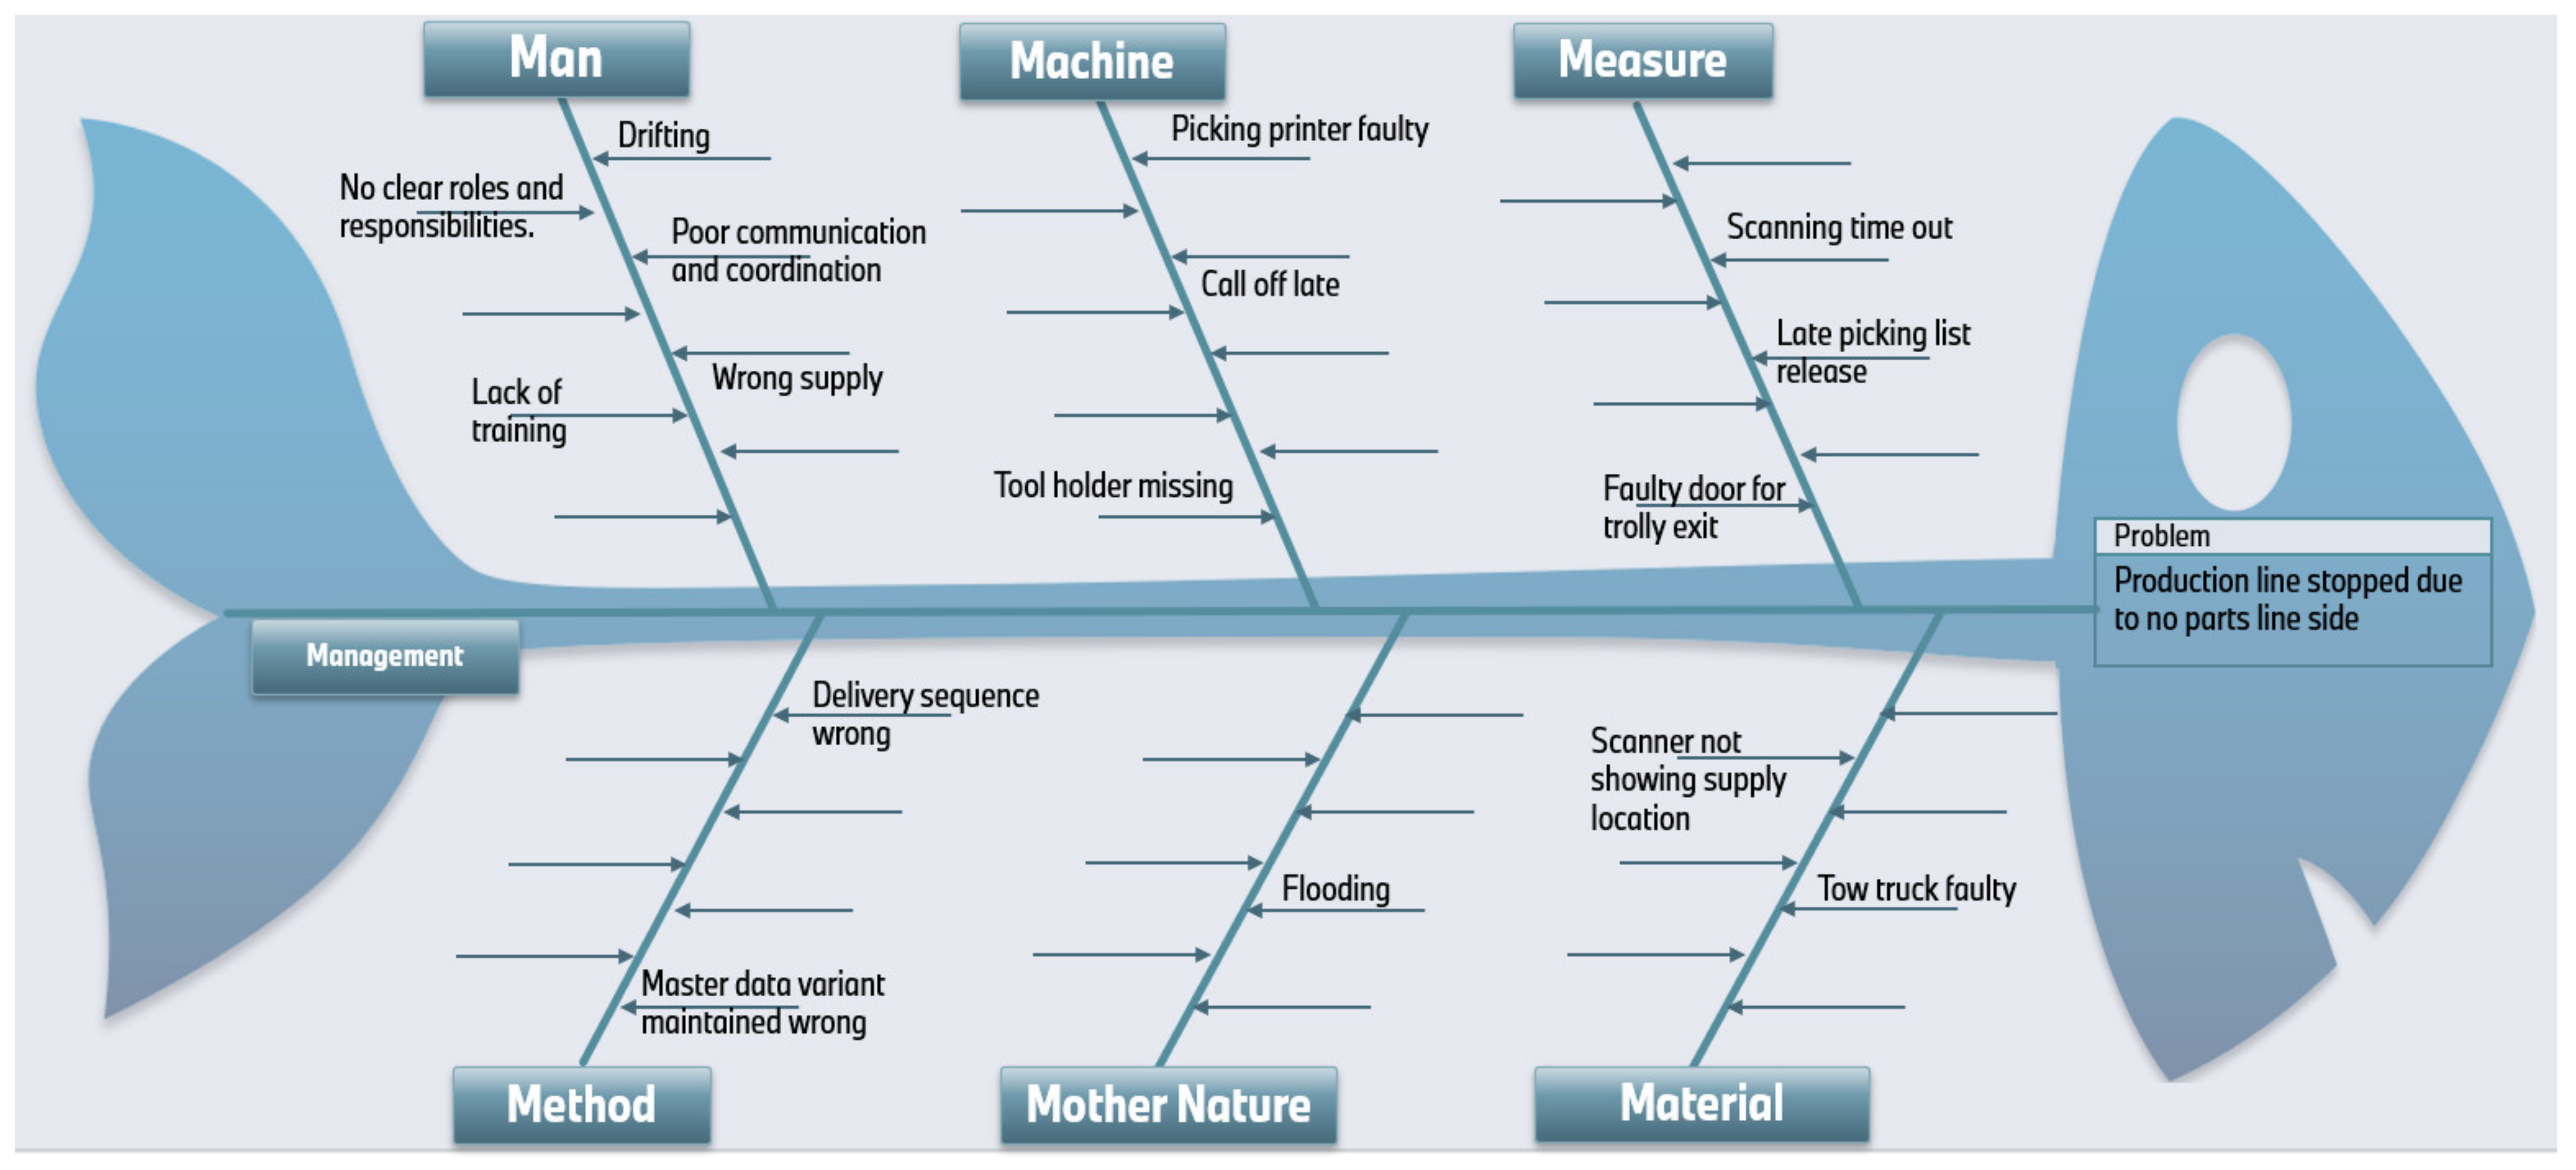
Ishikawa or Fish-bone Diagram: An Ishikawa diagram, also known as a fish-bone diagram or cause-and-effect diagram, can be used to analyze and identify the potential causes of problems or issues in a system-controlled takted warehouse. By using an Ishikawa diagram, one can visually identify and analyze the potential causes of inefficiencies in a system-controlled takted warehouse and develop appropriate solutions to address them.
Figure 4 is a fish-bone diagram for potential system failures.
4. Results and Discussion
This section discusses the implementation of a call-off system in warehouse management, focusing on the streamlining of order fulfilment. It outlines the objectives, methodology, and results of the implementation at ABC company. The study involved intensive data collection through process observations, trials, and operational data extraction from IoT-enabled systems. A mixed-method approach was used to gain both quantitative and qualitative insights. The findings are analyzed to evaluate the impact of the IoT implementation on logistics efficiency, highlighting benefits and challenges and offering recommendations for improvements and future research.
4.1. Comparison Before and After Implementation
Among others, a reduction in line stoppages was identified as one of the objectives of this study. For comparison, data on different topics was collected both before and after implementation, as discussed in the following paragraphs.
Line stoppages:
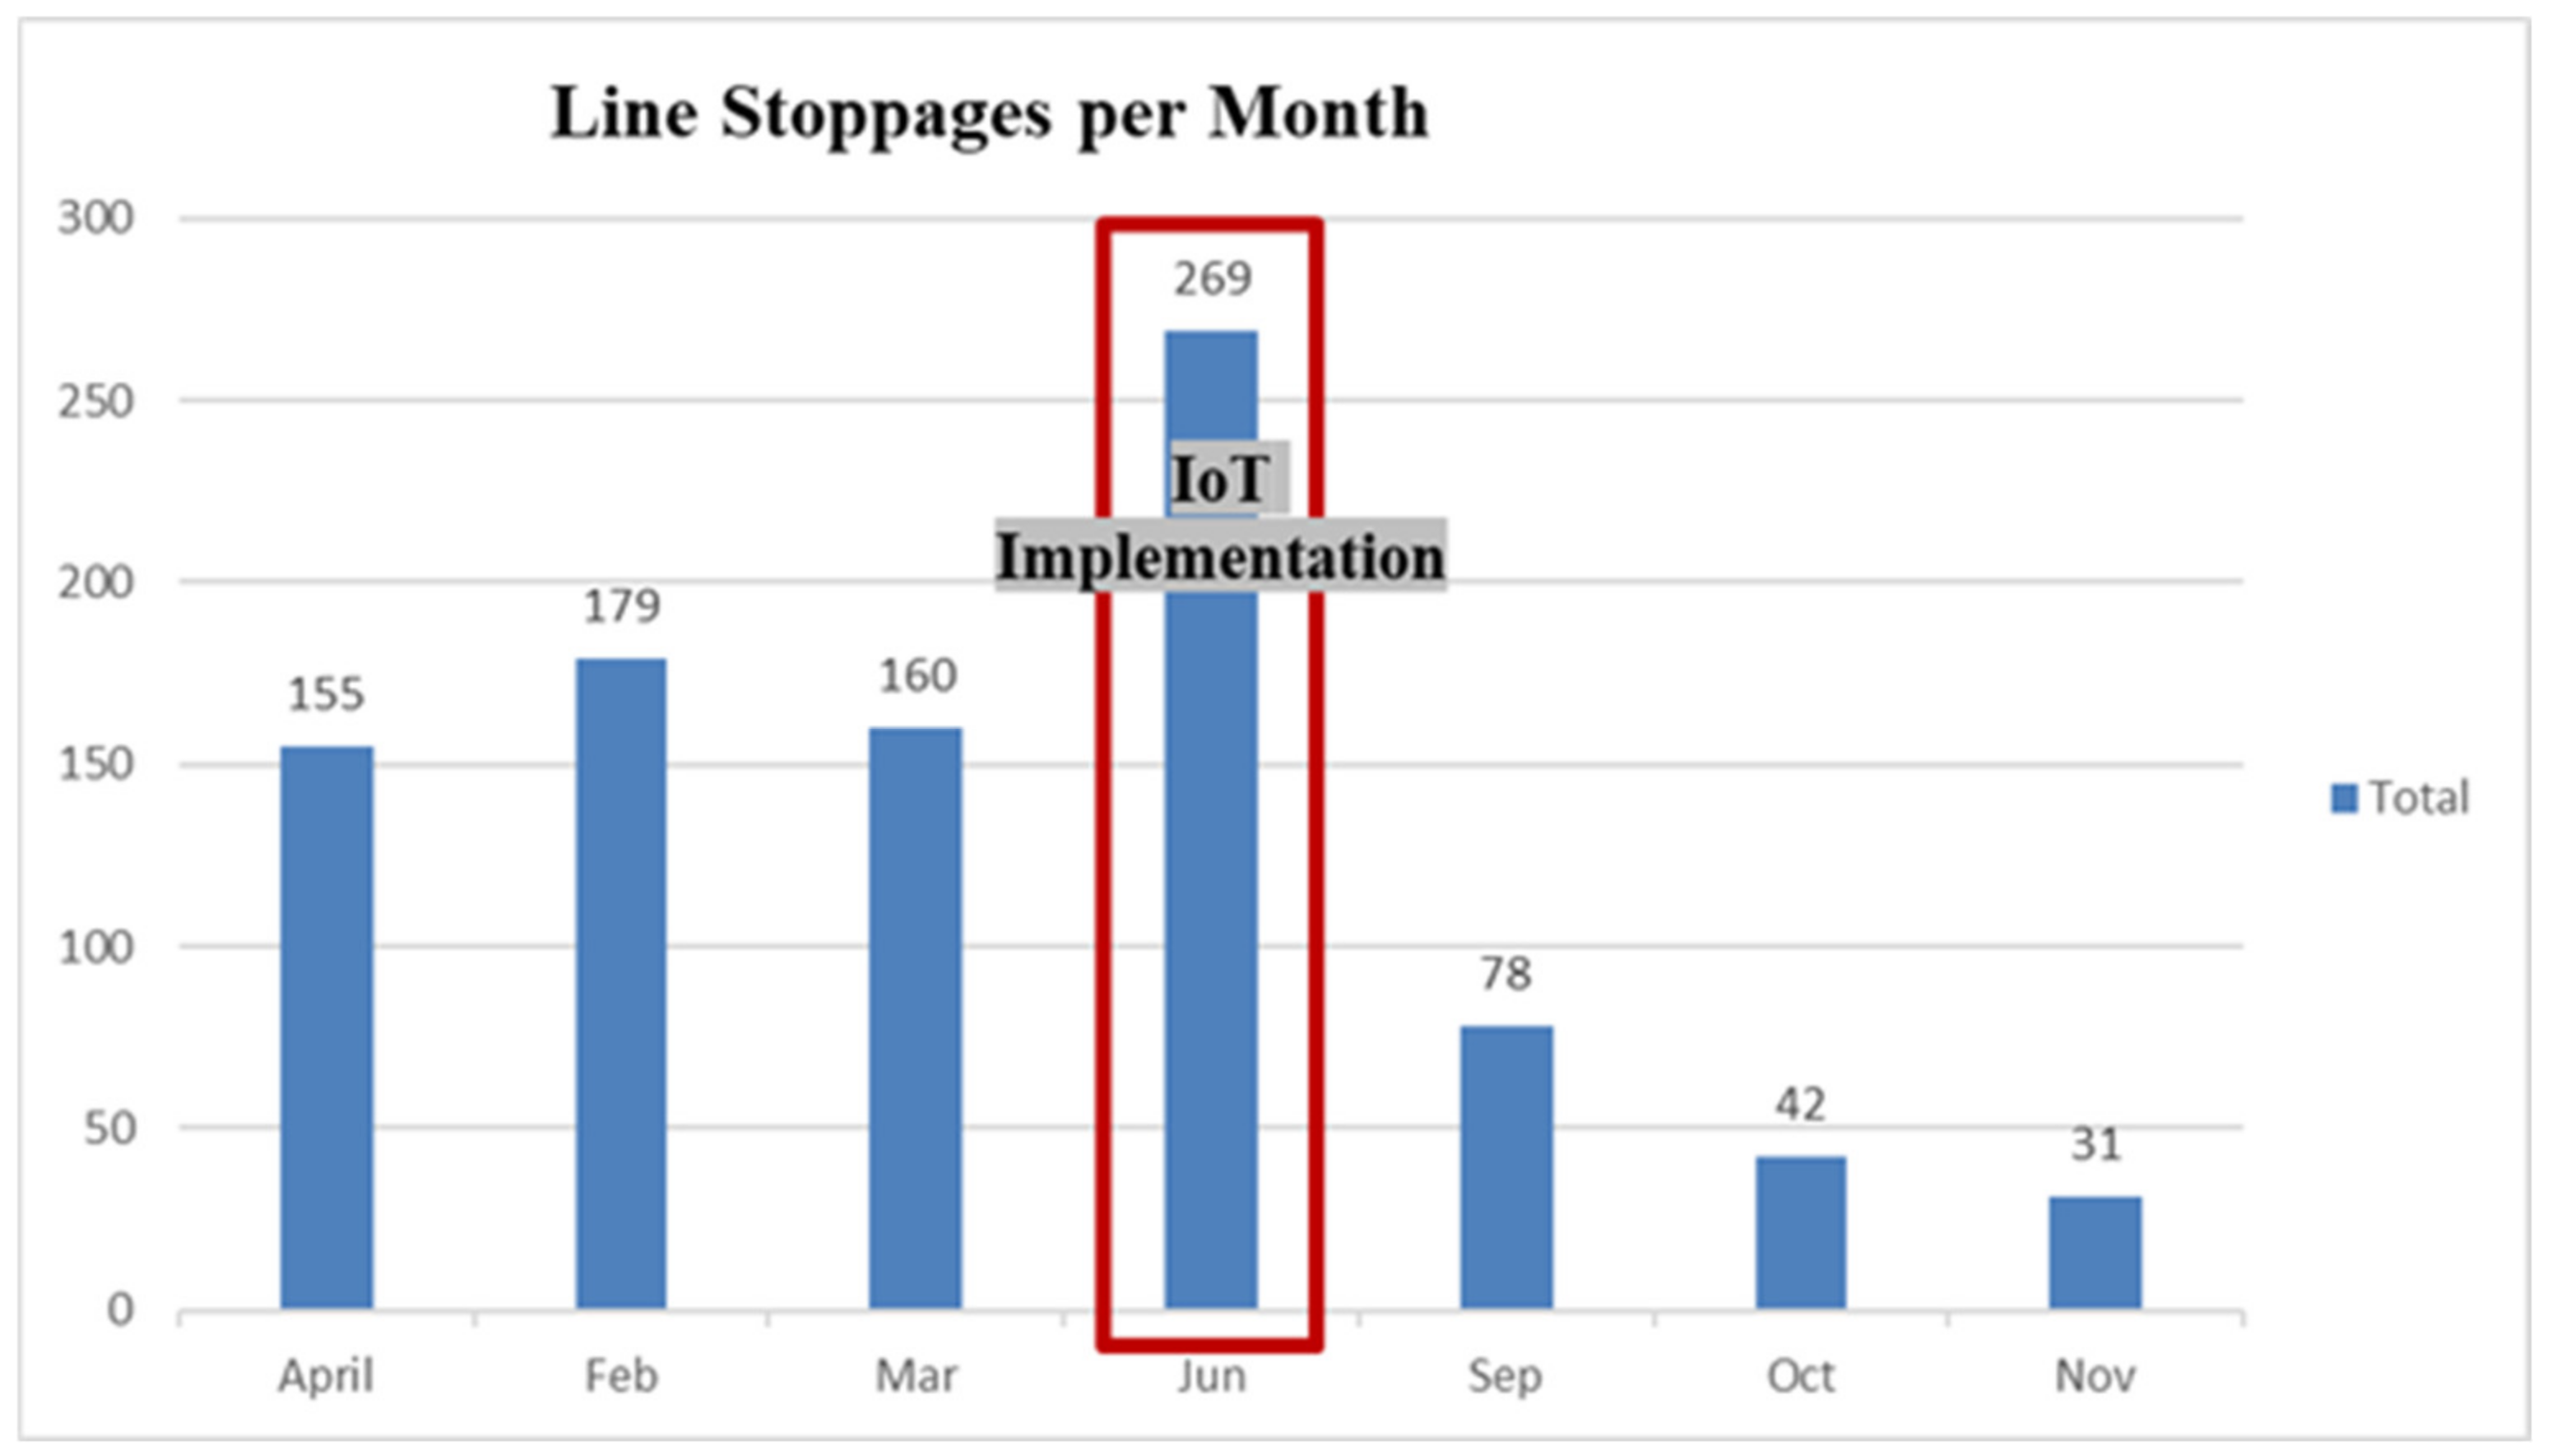
Figure 6 shows the line stoppages that occurred before and after the implementation of the warehouse IoT system. For the months of February to April, the an average of 165 stoppages a month occurred, and for the month of June, there was a drastic increase to 265 monthly stoppages. This was due to the fact that the system was being implemented in those months and there was a lot of system glitches, with employees still getting used to the new processes brought about by the system changes. The stoppages then took a turn for the better after the implementation when the employees had gotten used to their new processes and the system had settled. Stoppages dropped to an average of 50 a month. The trend presented in
Figure 6 shows a reduction in monthly stoppages. This drastic change in line stoppages highlights a positive result of the system implementation, showing that the new system-operated call-off process is more reliable for parts supply as compared to the manual process.
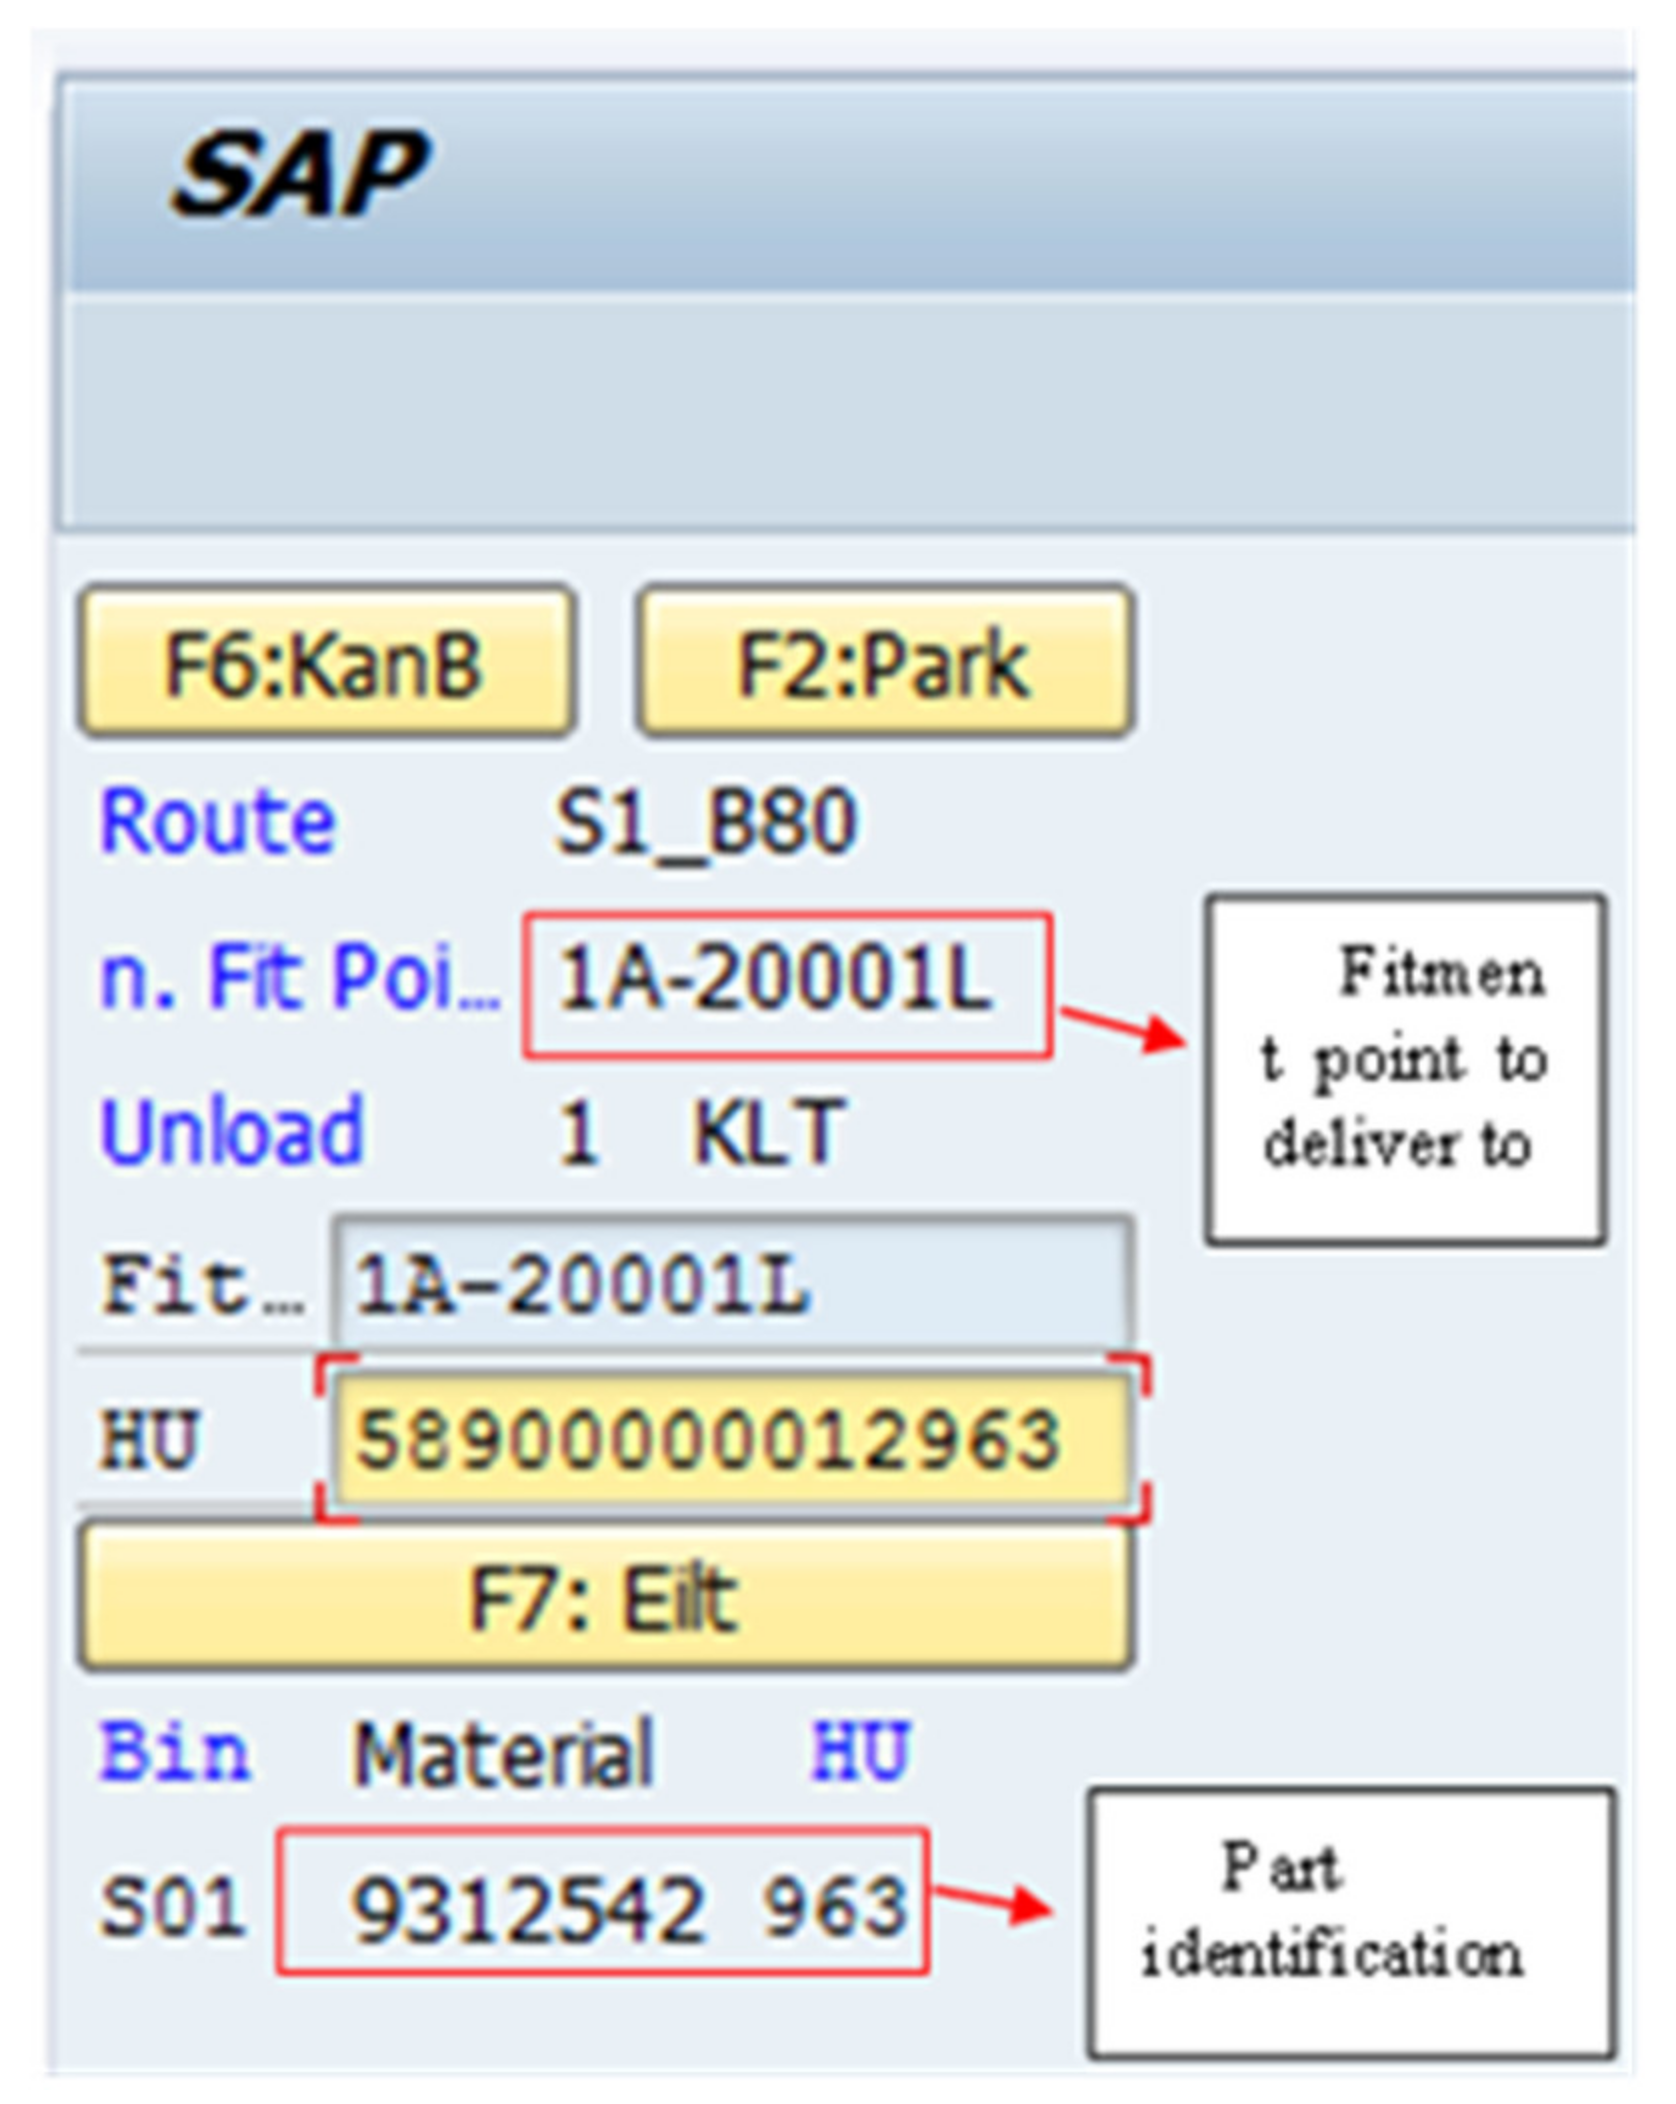
As was previously mentioned, one of the causes of line stoppages is wrong deliveries; it can further be said that with line stoppages reduced, wrong deliveries are reduced, as per the system data in
Figure 7, which shows the line-supply transparency added by the scanner. The employee supplying parts to the line is guided by the scanner, which shows the next part to be delivered and where it will be delivered (fitment point);
Figure 7 shows the scanner interface shown to the line supply driver. The deliveries then find their way to the right location, on time.
Cost savings: Company ABC is a target-driven company with daily production targets; the company is forced to create an allowance for overtime work to cover for any missed targets. The most important factor contributing to missed targets in company ABC is line stoppages. The findings of this research show an astonishing reduction in line stoppages, in turn increasing the possibility of meeting targets on a daily basis. Furthermore, being on target removes the need for overtime work, which, in turn, saves the company on overtime allowance.
4.1.1. Round-Trip Delivery Calculations
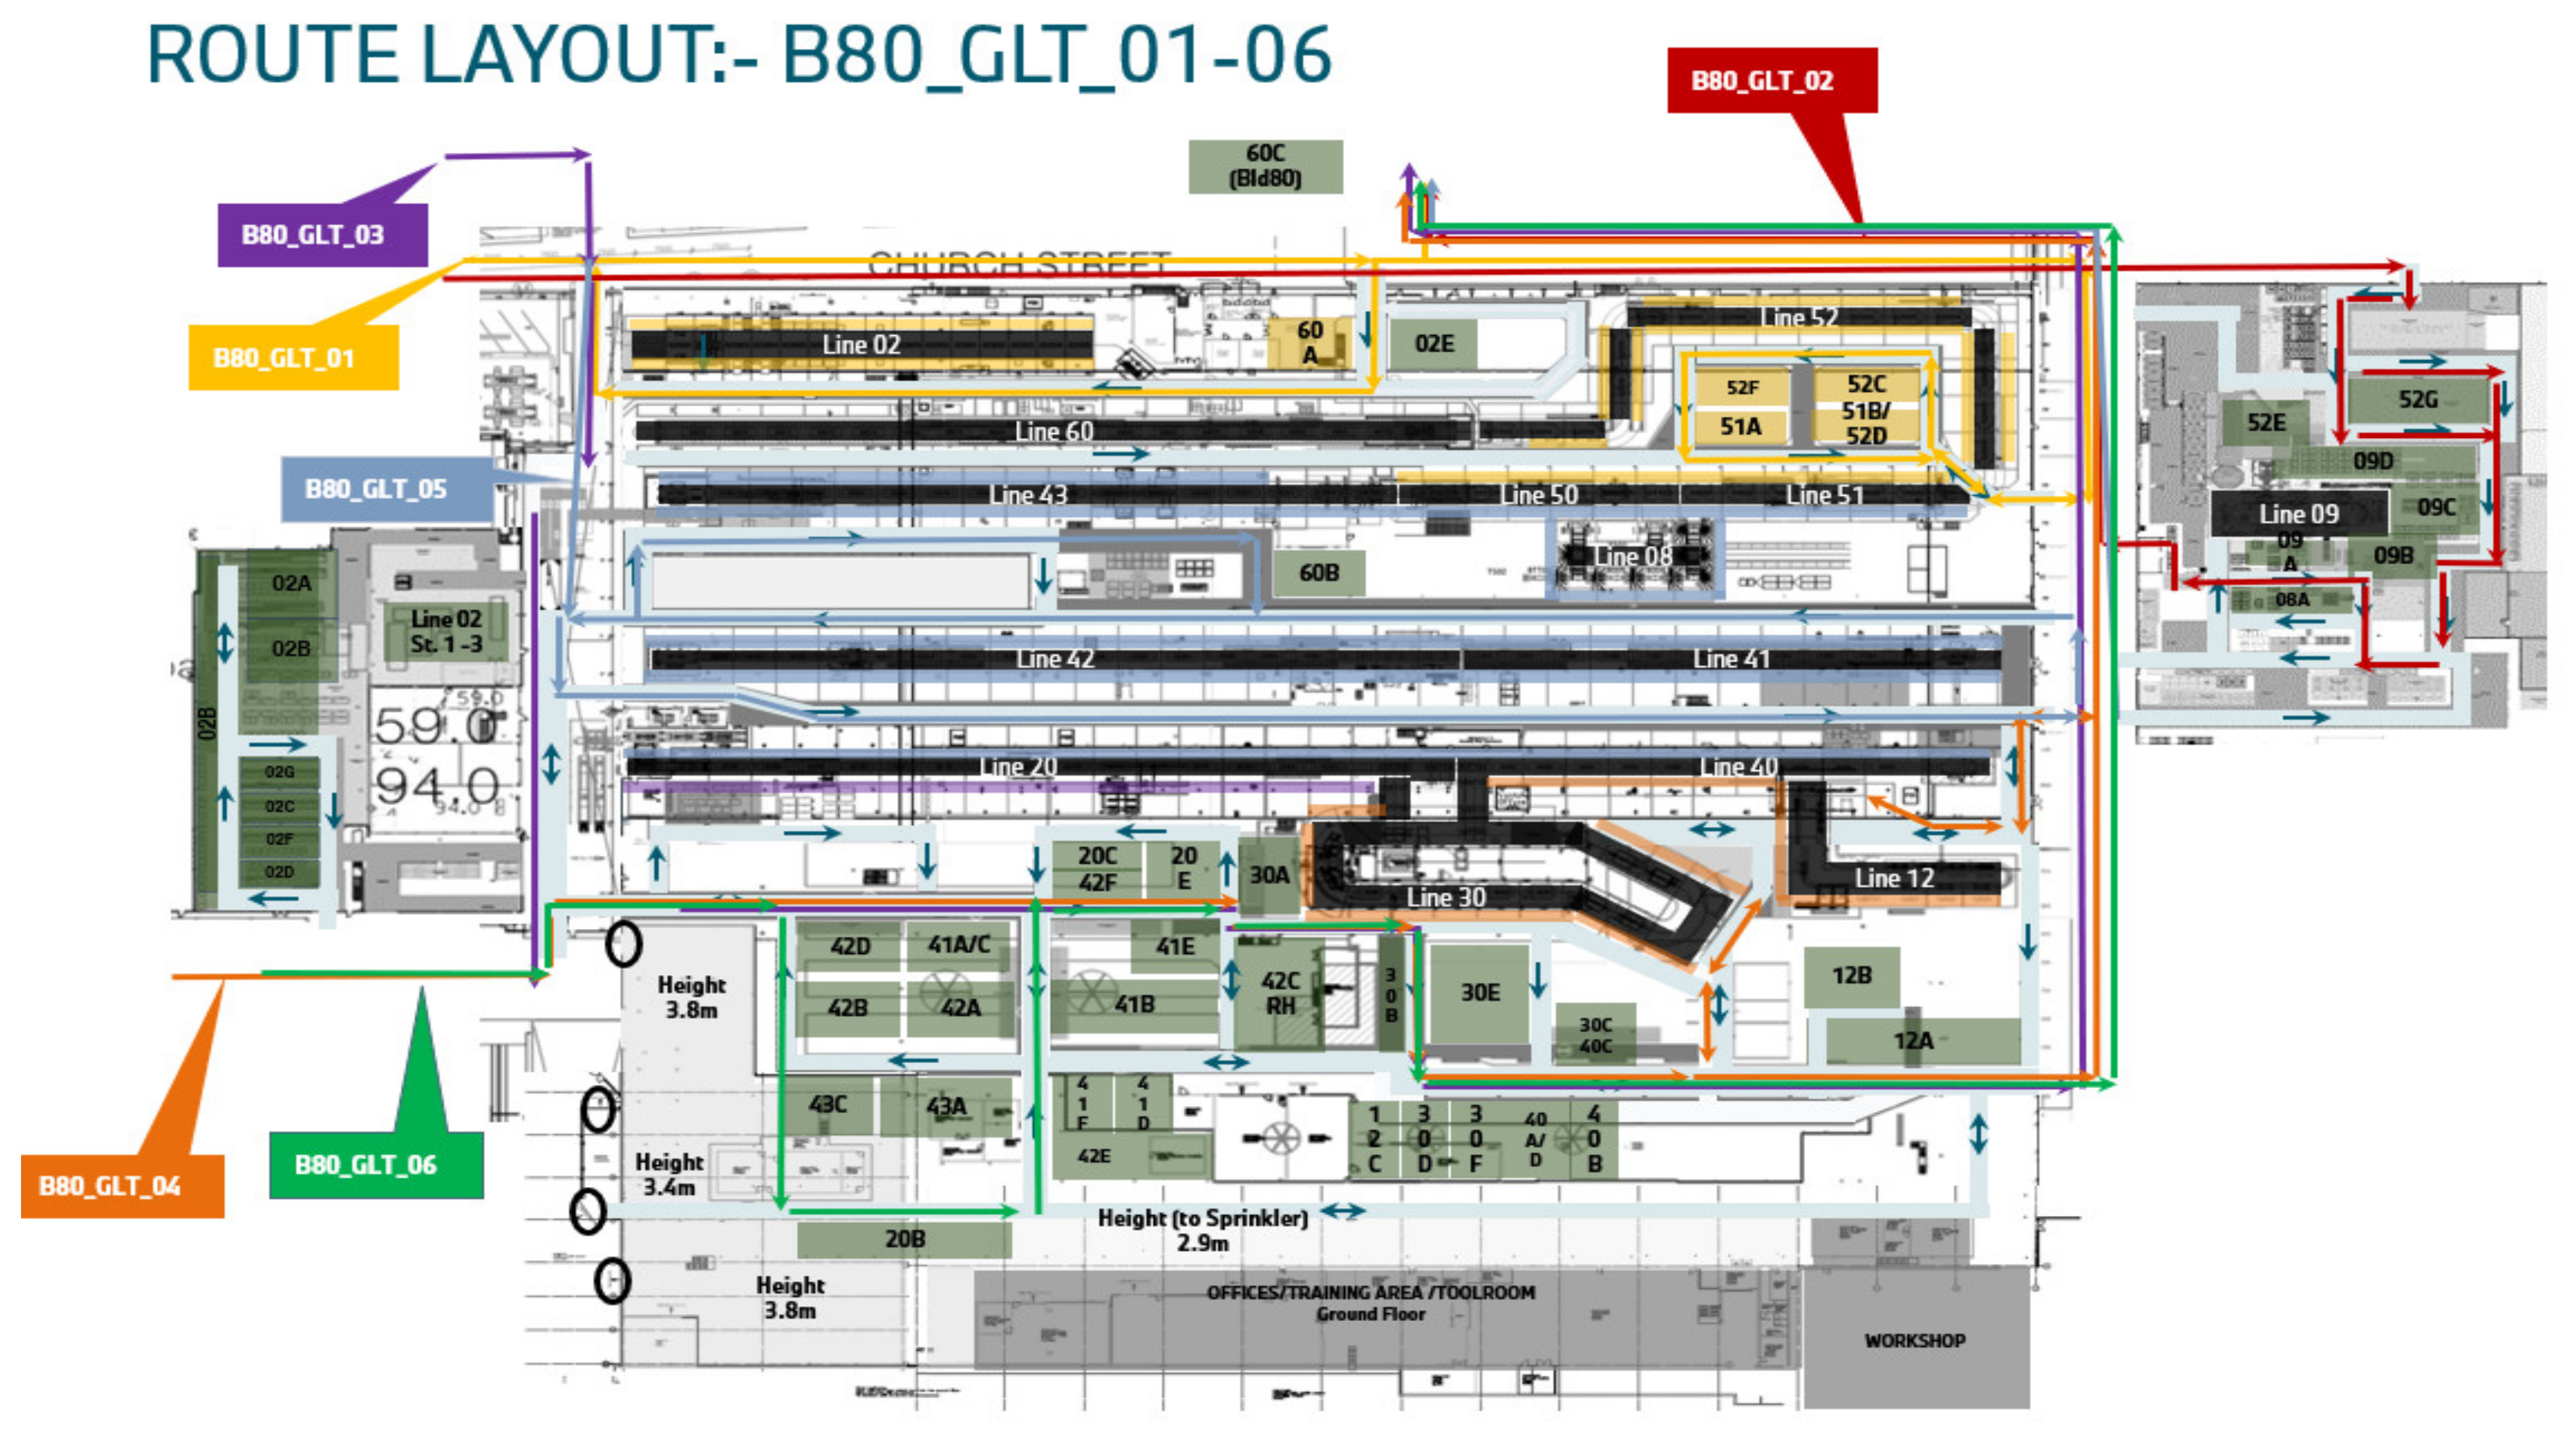
The round-trip times were calculated before and after implementation, and it was identified that the new process saves time for deliveries. It was found that the main factor contributing to the round-trip time is the sequencing of the route. The next most important contributor is the route grouping. The word route is self-explanatory, i.e., the path taken for each delivery; there could be one or many routes identified for the supply of parts, and each route consists of fitment points (stations). For each route, part numbers are grouped on the basis of where they are fitted (fitment points); this is done for ease of supply and to avoid traffic in one area, as ensuring that parts come from the same geographical location on a route makes the delivery trip shorter.
Figure 8 presents the map of the whole assembly plant, with different routes marked in different colors.
Table 3 shows the analysis of round-trip time, showing tremendous changes, with the highest round-trip time reduced to 30 min for route 6 from 42 min per trip, corresponding to decrease of 29%. The overall average decrease in the round-trip time is 32%, saving on capacity and allowing for additional time for emergency deliveries to further reduce line stoppages caused by sudden part shortages on the line.
4.1.2. Hot Call-Offs
Hot call-offs are emergency call-offs released without enough time for preparation. This usually happens because of late trigger points and minimum stock settings that are too low. The trends presented in
Figure 9 show a change in the number of hot call-offs. However, the change is not that significant for the implementation month (July 2023) because data were collected during the trial rounds and updated in an ongoing manner according to a trial-and-error method for just a few parts requiring a longer time for data accuracy. A decreasing trend is evident in
Figure 9, from the highs of over 400 hot call-offs per day, with an overall average of 350 hot call-offs per day in June 2023, to under 100 hots a day in August 2024. The reason for these call-off is not missed train or manual call-offs but a lack of train capacity. A lack of train capacity actually means that the box that was called could not leave with train X because it had no available space. In this case, the best solution is to increase the number of trains available for the warehouse.
4.2. Challenges Faced in Implementation
With so many positive results, we cannot overlook the challenges that came with the implementation. These challenges include the following:
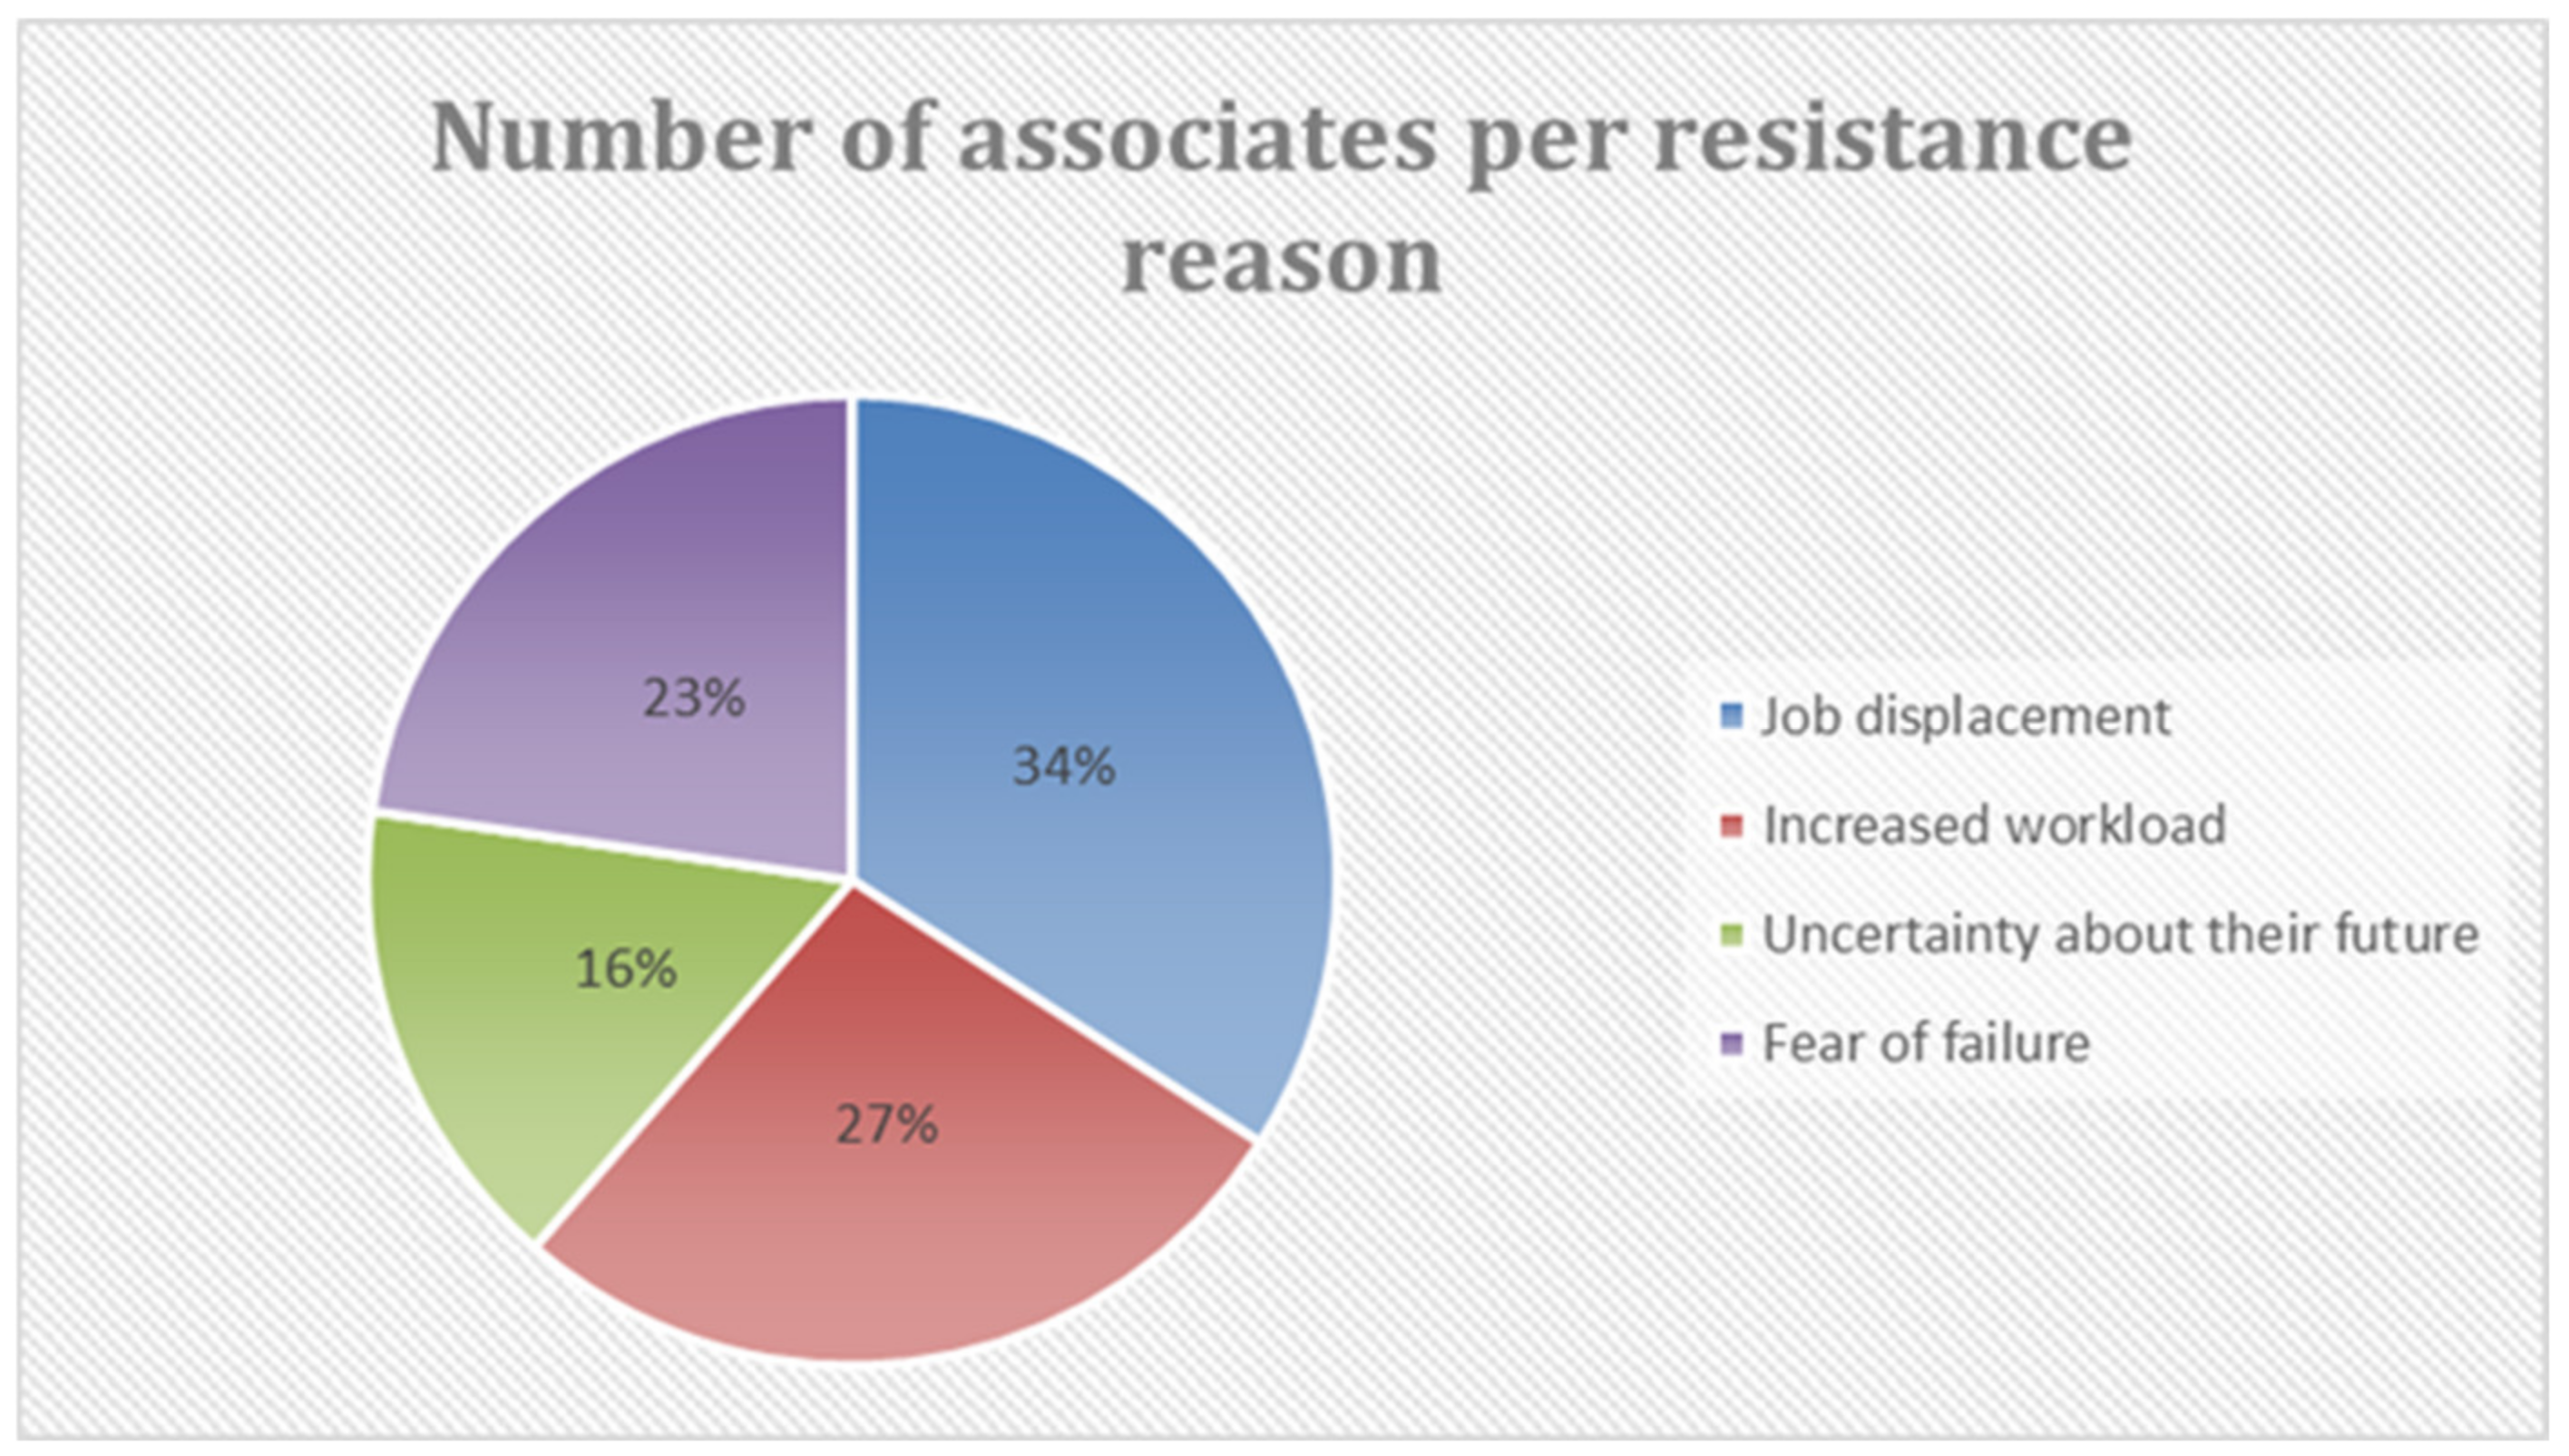
Resistance to change: Some of the warehouse associates were very resistant in the early stages of the implementation; as such evolutional transformations happen, a greater vision is still needed to understand that these changes are here to improve and make the lives of most people easier. Resistance is mostly due to fear of job displacement or increased workload. The chart displayed in
Figure 10 shows the reasons for resistance that associates gave when they were asked. As per
Figure 10, the biggest fear was job displacement, at 34%, followed by increased workload, at 27%. This resistance required effective management strategies and thorough training to overcome. Employee involvement played a big role in reducing these fears and getting the associates to come around.
Inflexibility of the process: A backup method needs to be introduced for the times when relied-upon processes are not operating at 100%. This is a rare occurrence, but when it happens, it can interrupt the process. When there is a system error, we should have a manual method to update the system to avoid warehouse inaccuracy.
Table 4 shows the errors that could occur.
Integration issues: Integrating the call-off system with the existing warehouse management system posed technical challenges. One of the challenges that brought about by integration issues was discussed above, i.e., line stoppages. We see that line stoppages increased by 100 during the implementation month (July 2023). Ensuring seamless data flow and compatibility between the two systems requires careful planning and coordination, requiring collaboration among different departments.
5. Conclusions
A failing warehouse parts supply process at a production company has been identified to have severe consequences for the company’s productivity, customer satisfaction, and overall profitability. By implementing integrated systems, improving communication, and enhancing inventory management, the automotive company investigated in this case study was able to overcome these challenges and achieve significant improvements in its warehouse parts supply process. This case study serves as a valuable example for other manufacturing companies facing similar issues, highlighting the importance of addressing these challenges and implementing effective solutions.
Positive feedback can be drawn from this study; the objectives were met, with a productivity increase of 70% calculated based on the reduction in line stoppages, which decreased from 165 stoppages a month to 50, corresponding to a continuous decrease.
The introduction of IoT technology in logistics management at the investigated company brought about the following effects:
A 70% reduction in line stoppages;
A 32% reduction in delivery time/round-trip time;
A reduction in the number of hot call-offs from an average of 350 a day to fewer than 100 a day;
Increased efficiency of the overall line supply process;
An increase in the number of on-time and accurate deliveries due to the use of linked scanners;
Given the achieved results, the conclusion can be drawn that the introduction of Internet of Things technology brought about a positive change; furthermore, the research question can be positively answered with a yes.
The implementation of system-controlled warehouse call-offs and scheduling processes reduced line stoppages and late and wrong part delivery. In summary, this research adds to the expanding corpus of research on the application of IoT technology in logistics and offers useful advice to policymakers and logistics managers who wish to integrate IoT technologies into their operations. Its findings show the groundbreaking potential of the Internet of Things to improve logistics operations and aid in the development of agile logistics in order to achieve a customer-centric and cost-effective logistics system. The findings of this research are positive and show a huge overall improvement in the logistics process.
