Abstract
Simultaneous Localization and Mapping (SLAM) is a critical component of autonomous navigation, enabling mobile robots to construct maps while estimating their location. In this study, we compare the performance of SLAM Toolbox and Cartographer, two widely used 2D SLAM methods, by evaluating their ability to generate accurate maps for autonomous racing applications. The evaluation was conducted using real-world data collected from a RoboRacer vehicle equipped with a 2D laser scanner and capable of providing odometry, operating on a small test track. Both SLAM methods were tested offline. The resulting occupancy grid maps were analyzed using quantitative metrics and visualization tools to assess their quality and consistency. The evaluation was performed against ground truth data derived from an undistorted photograph of the racetrack.
1. Introduction
In recent years, advancements in the field of self-driving and autonomous passenger vehicles and mobile robots have led to the wide acceptance of a future determined by this technology [1]. As a result, the demand for professionals with strong technical expertise in fields such as robot perception, SLAM, sensor fusion, and autonomous navigation has grown significantly. However, beyond theoretical knowledge, hands-on experience with real-world robotics platforms is crucial for developing the necessary problem-solving skills and system-level understanding. To address this need, project-based learning has gained prominence in engineering education, providing students with opportunities to engage in applied research and prototyping. Educational initiatives such as RoboRacer [2] and many other robotics competitions have emerged as effective means to bridge the gap between theory and practical implementation. These platforms allow students and researchers to experiment with state-of-the-art autonomous technologies in a safe, affordable, yet competitive environment. Importantly, these innovations also support the goals of sustainable mobility by promoting efficient, low-emission, and intelligent transportation systems that can reduce traffic congestion and energy consumption.
In this context, Simultaneous Localization and Mapping (SLAM) plays a critical role in enabling autonomous racing at high speeds. SLAM methods allow small-scale autonomous vehicles to perceive and model their environment while accurately estimating their position, which is essential for collision avoidance, trajectory optimization, and real-time decision-making. Given the variety of available SLAM solutions, selecting the most suitable algorithm for autonomous racing applications requires a careful comparison of accuracy and applicability.
This paper aims to compare two SLAM methods on a small-scale autonomous racing platform, specifically using a RoboRacer car, to evaluate their performance in terms of localization accuracy. The findings will contribute to understanding the strengths and limitations of different SLAM techniques in the context of high-speed mobile robotics, offering insights for both educational and research-oriented applications. Section 2 presents the materials and methods, including an overview of filter-based and graph-based SLAM approaches, the rationale for selecting SLAM Toolbox and Google Cartographer, the data acquisition process, and the evaluation methodology. Section 3 reports the results and discussion, offering both quantitative and visual comparisons of the generated occupancy grid maps. Finally, Section 4 concludes the paper by summarizing the results, highlighting key differences between the two methods, and outlining directions for future research.
2. Materials and Methods
Simultaneous Localization and Mapping (SLAM) is one of the most widely researched problems of mobile robotics and autonomous vehicles [3]. By definition, it enables a mobile robot to construct a map of an unknown environment while constantly estimating its position relative to the newly built map. While there are many variations constructed upon different approaches, SLAM methods can be generally categorized into two categories, these being filter-based and graph-based approaches.
2.1. Filter-Based and Graph-Based SLAM
Filter-based SLAM approaches the problem as a state estimation task, where the robot’s pose and the map are recursively updated using probabilistic filtering techniques. EKF-SLAM represents both robot poses and landmarks as a Gaussian distribution, using a state vector and covariance matrix to iteratively update estimates based on motion and sensor models. While efficient for small-scale 2D environments, its quadratic complexity limits scalability, and it assumes linearized system dynamics. In general, SLAM methods based on the Extended Kalman Filter can be more effective in small environments, and they require decent computational power. On the contrary, particle filter-based approaches tend to perform better in larger environments [4].
Graph-based SLAM is a technique for solving the simultaneous localization and mapping problem by representing robot poses and constraints as a graph and optimizing it to find the most consistent configuration. The method constructs a pose graph, where nodes represent robot poses and edges encode sensor-based constraints such as odometry or loop closures. Optimization techniques like nonlinear least squares refine the pose estimates by minimizing error [5].
2.2. Evaluated SLAM Methods
In alignment with the scope of this paper, the compared SLAM methods have been selected from the wide variety of available methods based on these criteria:
- Uses input data from a 2D laser scanner and optionally odometry.
- Provides occupancy grid map as output.
- It has an available implementation compatible with ROS 2 (Robot Operating System 2).
- Finally, the shortlisted, implemented, and compared SLAM methods were SLAM Toolbox and Google Cartographer.
SLAM Toolbox is an open-source method specifically developed for ROS 2, aimed at supporting robust and efficient 2D SLAM applications by building upon the foundational concepts of Open Karto [6]. Its design philosophy centers on adaptability and modularity, which enables researchers and practitioners to fine-tune the system to diverse mapping and localization requirements [7]. The toolbox integrates advanced pose-graph optimization techniques to improve real-time performance and accuracy, particularly in dynamic environments where conventional SLAM approaches may struggle with loop closures and non-static obstacles [8]. Since its integration into ROS 2’s Navigation2 collection, SLAM Toolbox has become a default solution for real-time mapping and positioning, providing a standardized framework that streamlines both development and deployment for autonomous systems. Notably, it supports three primary operational modes. These modes are synchronous mapping, designed for real-time data fusion where sensor readings are integrated in a time-critical, tightly coupled manner; asynchronous mapping, which allows for more flexible data processing and can handle sensor data with irregular time intervals; and pure localization, where an existing map is used solely for localization without further updates.
Google Cartographer is an open-source 2D SLAM library developed by Google. Google started developing cartographer in response to the need for accurate real-time mapping and localization used in robotics, the Street View project, and self-driving cars [9,10]. Google started developing the Cartographer as an internal tool to address some of their practical issues, as the robot must build a map of unknown environments while simultaneously tracking its location within that map while maintaining the use of as little computational power as possible. It was a main concern to keep the solution efficient, modular, and capable of handling data from various sensors like LiDAR, IMU, and cameras. Local SLAM creates small maps (submaps) from short sequences of sensor readings (scans). Each new scan is aligned to the current submap using a mathematical optimization technique (Ceres solver [11]), guided by the robot’s estimated movement (odometry). The scan is added to the submap if the robot has moved sufficiently. In the background, global SLAM works to create a single, consistent map. It periodically identifies when the robot has revisited a previously mapped area (loop closure) by comparing scans to nearby submaps. These loop closures create constraints that are then used to optimize the entire robot trajectory and map using the Ceres solver, resulting in a globally consistent map [12].
2.3. Comparison Method
Our goal was to create a comparison between the results of two SLAM methods. In order to carry out this comparison, both SLAM methods have been set up on the same computer running Ubuntu 22.04 and ROS 2 Humble Hawksbill. The SLAM methods were used to create maps offline, using pre-recorded exteroceptive and proprioceptive data. In order to provide relevant test data from the point of view of the purpose of our evaluation, real data has been acquired using a test platform including a mobile robot that complies with the rules of the RoboRacer series and a simplified racetrack. Furthermore, an evaluation method has been set up to quantitatively analyze the differences between the resulting occupancy grid maps. Both resulting occupancy grid maps created with the same resolution have been converted into aligned binary maps featuring the same size. Similarly, a binary map has been derived from the undistorted image of the racetrack used for data acquisition.
2.4. Data Acquisition Method
For this study, we collected ROS 2 rosbag datasets using a RoboRacer vehicle on a small test racetrack composed of 300 mm diameter tubes serving as track boundaries (Figure 1). In order to guarantee unchanged boundaries, the tubes have been kept fixed using double-sided tape and weights inside them. Furthermore, the same rosbag recording has been used to evaluate both SLAM methods in order to avoid input data differences. The objective was to capture real-world sensor data for evaluating SLAM and autonomous navigation algorithms under structured conditions. During data acquisition, the vehicle was operated in teleoperation (manual control) mode, where a human driver maneuvered the car around the track. These recordings contain synchronized data streams, including laser scanner and odometry data, enabling reproducible benchmarking of mapping methods.
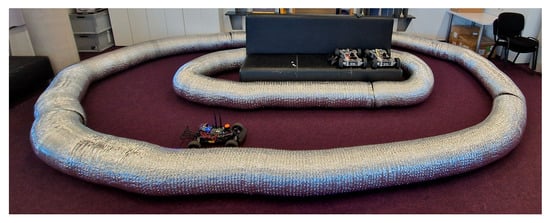
Figure 1.
Test racetrack used for data acquisition.
The RoboRacer car used as a data acquisition and test platform manifests a typical setup in accordance with the RoboRacer rulebook. Central to this platform’s computing capabilities is the NVIDIA Jetson Xavier NX (Santa Clara, CA, USA), an AI edge-computing module featuring a 384-core NVIDIA Volta GPU (with 48 Tensor Cores) and a 6-core NVIDIA Carmel ARM v8.2 64-bit CPU [13]. For environmental perception, the platform incorporates a Hokuyo UST-10LX 2D laser scanner (Osaka, Japan) due to its reliability and robust performance. Its detection range spans from 0.02 m to 10 m, with a 270° scanning angle at a 0.25° angular resolution, yielding four data points per degree. The UST-10LX operates at a scan frequency of 40 Hz, which is crucial for high-speed applications where rapid, accurate environment updates are required [14]. The setup is constructed upon a modified Traxxas Slash 1/10 four-wheel-drive electric car chassis (McKinney, TX, USA) with a VESC 6 electronic speed controller [15]. Our RoboRacer platform incorporates manual teleoperation capability for testing or data acquisition purposes. This can be achieved using a Bluetooth-enabled PlayStation (PS) controller, which pairs wirelessly with the onboard NVIDIA Jetson Xavier NX.
2.5. Ground Truth Data Creation
Ground truth data has been created using a non-distorted image taken from above the track using one lens of a ZED 2 camera mounted above the center of the racetrack area. After data acquisition has been completed, the inner contour of the track has been marked using masking tape; then, the tubes have been removed and a photograph has been taken. The starting point of the RoboRacer car was marked with a cross-shaped marker (Figure 2), which was also temporarily added to the binary ground truth map to support alignment with mapping results.
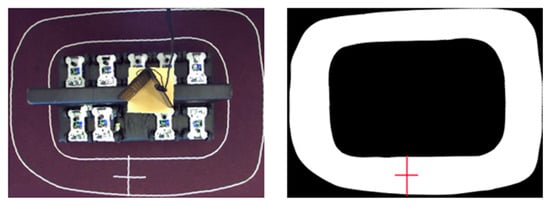
Figure 2.
Ground truth binary map creation (right) using a non-distorted image (left).
2.6. Evaluation Method
The proposed tool compares occupancy grid maps as images. It is designed to evaluate similarities between ground truth and maps quantitatively and to generate figures that help with visual comparison. As an initial step, the tool imports the image files containing the occupancy grid maps. It is a requirement that the images use a grayscale representation. Preprocessing steps are applied, which include the resizing of the images to match dimensions, and then a thresholding operation is carried out to convert the grayscale images into binary maps. After this step, occupied regions (in this case, the boundaries of the racetrack) are represented by one color, and free space is represented by the other.
The first quantitative metric is the Structural Similarity Index Measure (SSIM) [16]. In general, this metric compares two images in terms of their luminance, contrast, and structure, but since the occupancy grid maps are represented by binary pictures, where each pixel can take the value of either 0 or 1, the formula for SSIM can be simplified by removing terms referring to luminance and contrast variations (1). The required terms are the means μ1 and μ2, the standard deviations σ1 and σ2, and the covariance σ12 of the compared binary pictures. Constants C1 and C2 play a technical role in preventing division by zero.
The resulting SSIM has a major advantage and disadvantage when it comes to evaluation. It can take values between 0 and 1, 0 meaning that the two maps are completely different with no structural correlation, while 1 refers to the fact that the maps are identical. Thus, SSIM is easy to evaluate as far as a general quantitative comparison is required, but it can be challenging to identify the reason, more specifically, the location of potential differences.
The second comparison metric is the Dice Coefficient (DSC). The DSC, also known as the Sørensen–Dice index, is a statistical measure of similarity between two sets, or in our case, two occupancy grids. It quantifies the overlap between two binary images, making it useful for quantifying how well the two grid maps align. DSC can be defined as the proportion of the number of overlapping occupied pixels and the total number of occupied pixels in both maps (2).
In case of our implementation, for the comparison of grid maps represented by binary images, DSC can be reformulated, since pixel values can only take values 0 and 1 (3).
The DSC ranges from 0 to 1, with 1 indicating perfect overlap between the two pictures. It is particularly effective in evaluating spatial overlap.
Both quantifiable comparison methods have been implemented in the form of a Python script. In addition to the quantifiable comparison methods, a visual comparison tool has been added. This tool uses the binary images created based on the occupancy grid maps as input. Based on these images, it highlights the structural features of both maps using edge detection, and finally, it generates a difference map, which marks discrepancies between the two images by color codes.
3. Results and Discussion
This section presents a quantitative and visual comparison of the occupancy grid maps generated by two SLAM algorithms: SLAM Toolbox and Google Cartographer. To assess the similarity between the resulting maps, two metrics were used: SSIM and DSC. These metrics collectively evaluate pixel-level discrepancies, structural resemblance, and spatial overlap between the maps, offering a comprehensive analysis of mapping accuracy and consistency.
Table 1 summarizes the quantified comparison results, indicating variations in pixel-level similarity and spatial consistency between the outputs of the two SLAM algorithms and the binary ground truth map.

Table 1.
Quantified comparison results.
To further illustrate these differences, a set of visual representations was generated. Figure 3 shows the original occupancy grid maps produced by SLAM Toolbox and Google Cartographer. Figure 4 presents the corresponding binary maps, where occupied and free spaces have been thresholded to enable clearer spatial comparison. Figure 5 shows overlay difference maps between the ground truth and the outputs of the two mapping methods. In visual terms, the occupancy grid maps capture the general outline of the racetrack but exhibit differences in details such as wall definition, gaps, and noise.
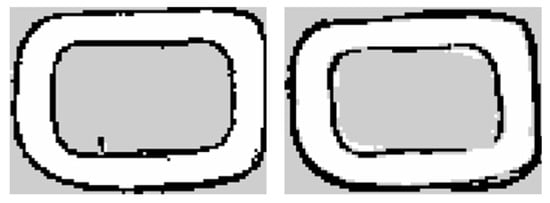
Figure 3.
Occupancy grid map output from SLAM Toolbox (left) and Google Cartographer (right).
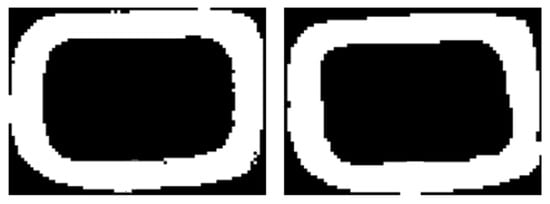
Figure 4.
Binary map generated based on the output from SLAM Toolbox (left) and Google Cartographer (right).
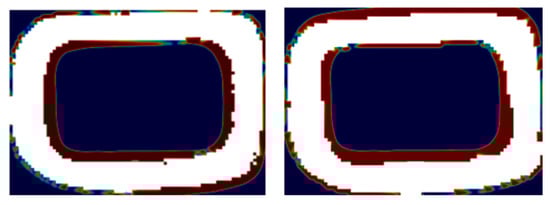
Figure 5.
Overlay difference map between SLAM Toolbox (left), Google Cartographer (right), and ground truth.
3.1. Quantitative Comparison
The SSIM achieved 0.7576 for SLAM-Toolbox and 0.7342 for Google Cartographer, indicating a moderate degree of structural similarity between the generated maps. Although values closer to 1 denote near-identical structural alignment, these results suggest that while the global structures (such as the track boundaries) are reasonably well preserved, local distortions and misalignments remain present.
The DSC was measured at 0.6082 for SLAM-Toolbox and 0.6099 for Google Cartographer, which reflects a moderate level of spatial overlap between occupied regions in the two maps. This indicates that the mapping frameworks achieved broadly consistent representations of occupied space, although discrepancies in obstacle placement and boundary detection are still evident.
Overall, these quantitative results suggest that both SLAM-Toolbox and Google Cartographer produce maps with comparable structural consistency and overlap, but deviations remain that could affect downstream tasks such as navigation or localization.
3.2. Visual Comparison
Both methods reconstruct the overall outline of the racetrack, but notable differences are observed in boundary consistency and structural accuracy. SLAM Toolbox produces smoother and more continuous track boundaries, whereas Cartographer introduces irregularities, distortions, and fragmented segments. In the binary representations, SLAM Toolbox yields a cleaner separation between occupied and free space, while Cartographer frequently exhibits disconnected regions. Overlay comparisons with ground truth further emphasize these differences: SLAM Toolbox aligns more closely with reference boundaries, while Cartographer displays greater misalignment, particularly along curves and edges. These observations corroborate the quantitative results, indicating that SLAM Toolbox achieves higher structural fidelity and fewer artifacts than Cartographer.
4. Conclusions
The evaluation demonstrates that, given the laser scan and odometry data provided by the RoboRacer platform, SLAM Toolbox consistently produced more accurate occupancy grid maps than Google Cartographer. Quantitative assessment against a binary ground truth map showed comparable similarity scores for both methods, with SSIM values of 0.7576 and 0.7342 and DSC values of 0.6082 and 0.6099, respectively. While these results indicate broadly similar structural alignment and spatial overlap, visual inspection revealed systematic differences: SLAM Toolbox generated smoother and more continuous track boundaries, whereas Cartographer frequently exhibited distortions and fragmented regions.
Taken together, the results confirm that SLAM Toolbox offers superior performance in this application, particularly in terms of structural fidelity and artifact reduction. Nevertheless, the observed inconsistencies highlight the importance of further improving odometry handling, especially in mitigating drift and enhancing localization accuracy. Future work will focus on refining odometry calibration and exploring sensor fusion strategies, such as the integration of wheel odometry with IMU data, to further improve mapping robustness and accuracy in small-scale autonomous racing environments.
Author Contributions
Conceptualization, methodology, ground truth data creation, and writing, R.K.; software, implementation, A.M.A.A.; software, B.J.B.F. All authors have read and agreed to the published version of the manuscript.
Funding
This research was supported by the EKÖP-24-3-I-SZE-81 University Research Fellowship Program of the Ministry for Culture and Innovation from the Source of the National Research, Development and Innovation Fund. This research was supported by the European Union within the framework of the National Laboratory for Autonomous Systems (RRF-2.3.1-21-2022-00002).
Institutional Review Board Statement
Not applicable.
Informed Consent Statement
Not applicable.
Data Availability Statement
The raw data supporting the conclusions of this article will be made available by the authors on request.
Conflicts of Interest
The authors declare no conflict of interest.
References
- Ahmed, M.; Iqbal, R.; Amin, S.; Alhabshneh, O.; Garba, A. Autonomous Vehicle and its Adoption: Challenges, Opportunities, and Future Implications. In Proceedings of the 2022 International Conference on Emerging Trends in Computing and Engineering Applications (ETCEA), Karak, Jordan, 23–24 November 2022. [Google Scholar]
- RoboRacer Foundation, RoboRacer 2025. Available online: https://roboracer.ai/ (accessed on 28 January 2025).
- Tee, Y.K.; Han, Y.C. Lidar-Based 2D SLAM for Mobile Robot in an Indoor Environment: A Review. In Proceedings of the 2021 International Conference on Green Energy, Computing and Sustainable Technology (GECOST), Miri, Malaysia, 7–9 July 2021. [Google Scholar]
- Montemerlo, M.; Thrun, S.; Koller, D.; Wegbreit, B. FastSLAM: A Factored Solution to the Simultaneous Localization and Mapping Problem. In Proceedings of the Eighteenth National Conference on Artificial Intelligence, Edmonton, AB, Canada, 28 July–1 August 2002. [Google Scholar]
- Grisetti, G.; Kümmerle, R.; Burgard, W. A Tutorial on Graph-Based SLAM. IEEE Trans. Intell. Transp. Syst. 2010, 2, 31–43. [Google Scholar] [CrossRef]
- Konolige, K.; Grisetti, G.; Kümmerle, R.; Burgard, W.; Limketkai, B.; Vincent, R. Efficient Sparse Pose Adjustment for 2D Mapping. In Proceedings of the 2010 IEEE/RSJ International Conference on Intelligent Robots and Systems, Taipei, Taiwan, 18–22 October 2010. [Google Scholar]
- Fallon, M.F.; Johannsson, H.; Leonard, J.J. Efficient Scene Simulation for Robust Monte Carlo Localization Using an RGB-D Camera. In Proceedings of the 2012 IEEE International Conference on Robotics and Automation (ICRA), Saint Paul, MN, USA, 14–18 May 2012. [Google Scholar]
- Macenski, S.; Jambrecic, I. SLAM Toolbox: SLAM for the Dynamic World. J. Open Source Softw. 2021, 6, 61. [Google Scholar] [CrossRef]
- Agarwal, S.; Mierle, K.; The Ceres Solver Team. Ceres Solver. Available online: https://github.com/ceres-solver/ceres-solver (accessed on 27 January 2025).
- Hess, W.; Kohler, D.; Rapp, H.; Andor, D. Real-Time Loop Closure in 2D LiDAR SLAM. In Proceedings of the 2016 IEEE International Conference on Robotics and Automation (ICRA), Stockholm, Sweden, 16–21 May 2016. [Google Scholar]
- NVIDIA, Jetson Xavier NX Data Sheet. Available online: https://www.nvidia.com/en-us/autonomous-machines/embedded-systems/jetson-xavier-nx/ (accessed on 26 January 2025).
- Hokuyo Automatic Co., Ltd. UST-10LX 2D Laser Scanner Specifications. Available online: https://www.hokuyo-aut.jp/ (accessed on 26 January 2025).
- The VESC Project, VESC 6 Hardware. Available online: https://vesc-project.com/node/311 (accessed on 26 January 2025).
- Wang, Z.; Bovik, A.C.; Sheikh, H.R.; Simoncelli, E.P. Image Quality Assessment: From Error Visibility to Structural Similarity. IEEE Trans. Image Process. 2004, 13, 600–612. [Google Scholar] [CrossRef] [PubMed]
- Cadena, C.; Carlone, L.; Carrillo, H.; Latif, Y.; Scaramuzza, D.; Neira, J.; Reid, I.; Leonard, J.J. Past, Present, and Future of Simultaneous Localization and Mapping: Toward the Robust-Perception Age. IEEE Trans. Robot. 2016, 32, 1309–1332. [Google Scholar] [CrossRef]
- Li, Q.; Zhu, H. Performance evaluation of 2D LiDAR SLAM algorithms in simulated orchard environments. Comput. Electron. Agric. 2024, 221, 108994. [Google Scholar] [CrossRef]


Disclaimer/Publisher’s Note: The statements, opinions and data contained in all publications are solely those of the individual author(s) and contributor(s) and not of MDPI and/or the editor(s). MDPI and/or the editor(s) disclaim responsibility for any injury to people or property resulting from any ideas, methods, instructions or products referred to in the content. |
© 2025 by the authors. Licensee MDPI, Basel, Switzerland. This article is an open access article distributed under the terms and conditions of the Creative Commons Attribution (CC BY) license (https://creativecommons.org/licenses/by/4.0/).