1. Introduction
In the past ten years, the shift towards electrification has revolutionized personal transportation by introducing electric scooters and electric bicycles. This trend of electrification provides an efficient and environmentally friendly option for urban travel. However, with the increasing popularity of electric bicycles (e-bikes) comes challenges, particularly in maintaining rider safety due to their increased speeds and weights compared to regular bicycles. A significant aspect of this challenge is to ensure reliable braking performance. Active safety systems, such as antilock brake systems (ABSs), have demonstrated potential in preventing wheel lockup and improving stability during emergency stops [
1].
Recent studies indicate a growing interest in ABS solutions and active safety systems being implemented for e-bikes. The development and validation of these systems remain resource-intensive and require repeated field tests and costly hardware iterations. Simulations and virtual validation methods address the challenges associated with prototype-driven physical development by using simulation models and model-based development instead of prototype-driven development [
2].
This work focuses on the development of a high-fidelity longitudinal vehicle dynamics model of an electric bicycle. The model presented in this paper captures the main components of an electronic bike, including the vehicle body, drivetrain, transmission, brakes, and tire–road contact.
The model is used to evaluate the braking performance of a specific e-bike under different road conditions. Road conditions represent dry, wet, snowy, and icy road conditions, and the effects of the tire–road interaction under different conditions are evaluated. With this work, a baseline is created for evaluating different control algorithms for e-bike ABSs; thus the significance of this model for virtual verification of ABS solutions is crucial.
2. Materials and Methods
The scope of this section is to highlight the methods and modeling techniques for creating a longitudinal vehicle model of an e-bike that can evaluate the braking performance of a bicycle. The method for creating the longitudinal model is model-based design (MBD). Using MBD we can model both a control loop and the physical model that serves as a plant model for control verification and validation. When it comes to control system modeling, casual modeling techniques are used, where signal-driven systems are developed. However, for plant models, acausal modeling techniques are used, where instead of a signal-driven modeling philosophy, component-driven modeling is used [
3,
4].
The modeling process is carried out in Simulink and Simscape, which support acausal, equation-based representation. Using Simulink for the modeling method, we achieve a modeling environment for virtual experimentation under a wide range of operating conditions without the need for physical prototypes.
2.1. Longitudinal Model of the Electric Bicycle
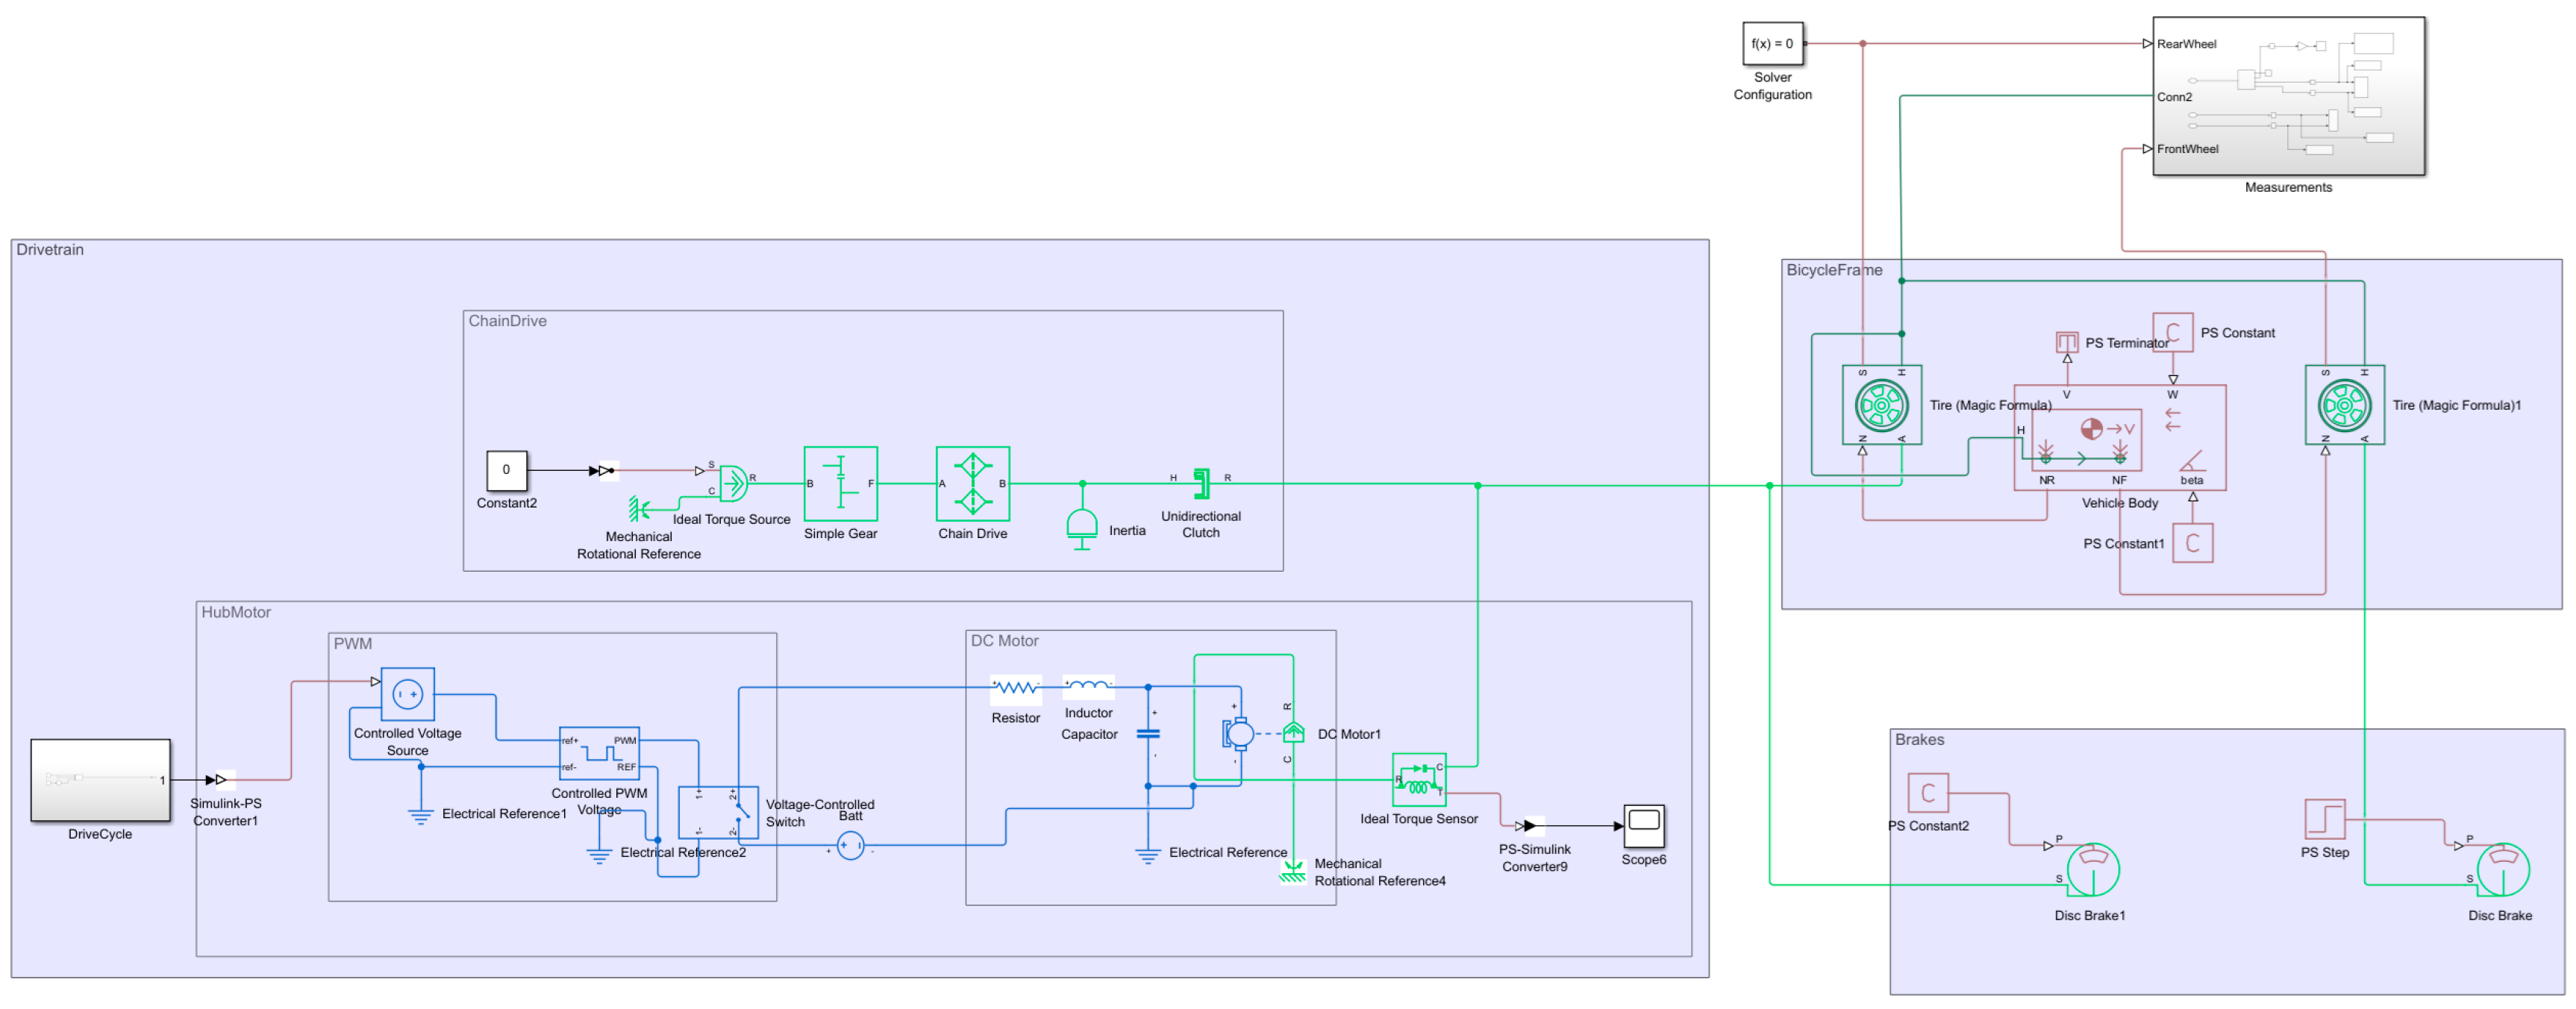
For developing the model of the e-bike, it was crucial to choose the right level of model fidelity that is appropriate for validating active safety functions. In order to capture the wheel slip for later ABS development, it is necessary to have realistic tire–road interaction. On the other hand, the lateral motion of the bicycle was neglected, and only longitudinal motion was modeled. We created a simulation model with the previously described requirements, which consists of the following main components:
Bicycle frame;
Wheels and brakes;
Drivetrain.
The components and their interfaces are represented in
Figure 1.
2.1.1. Bicycle Frame
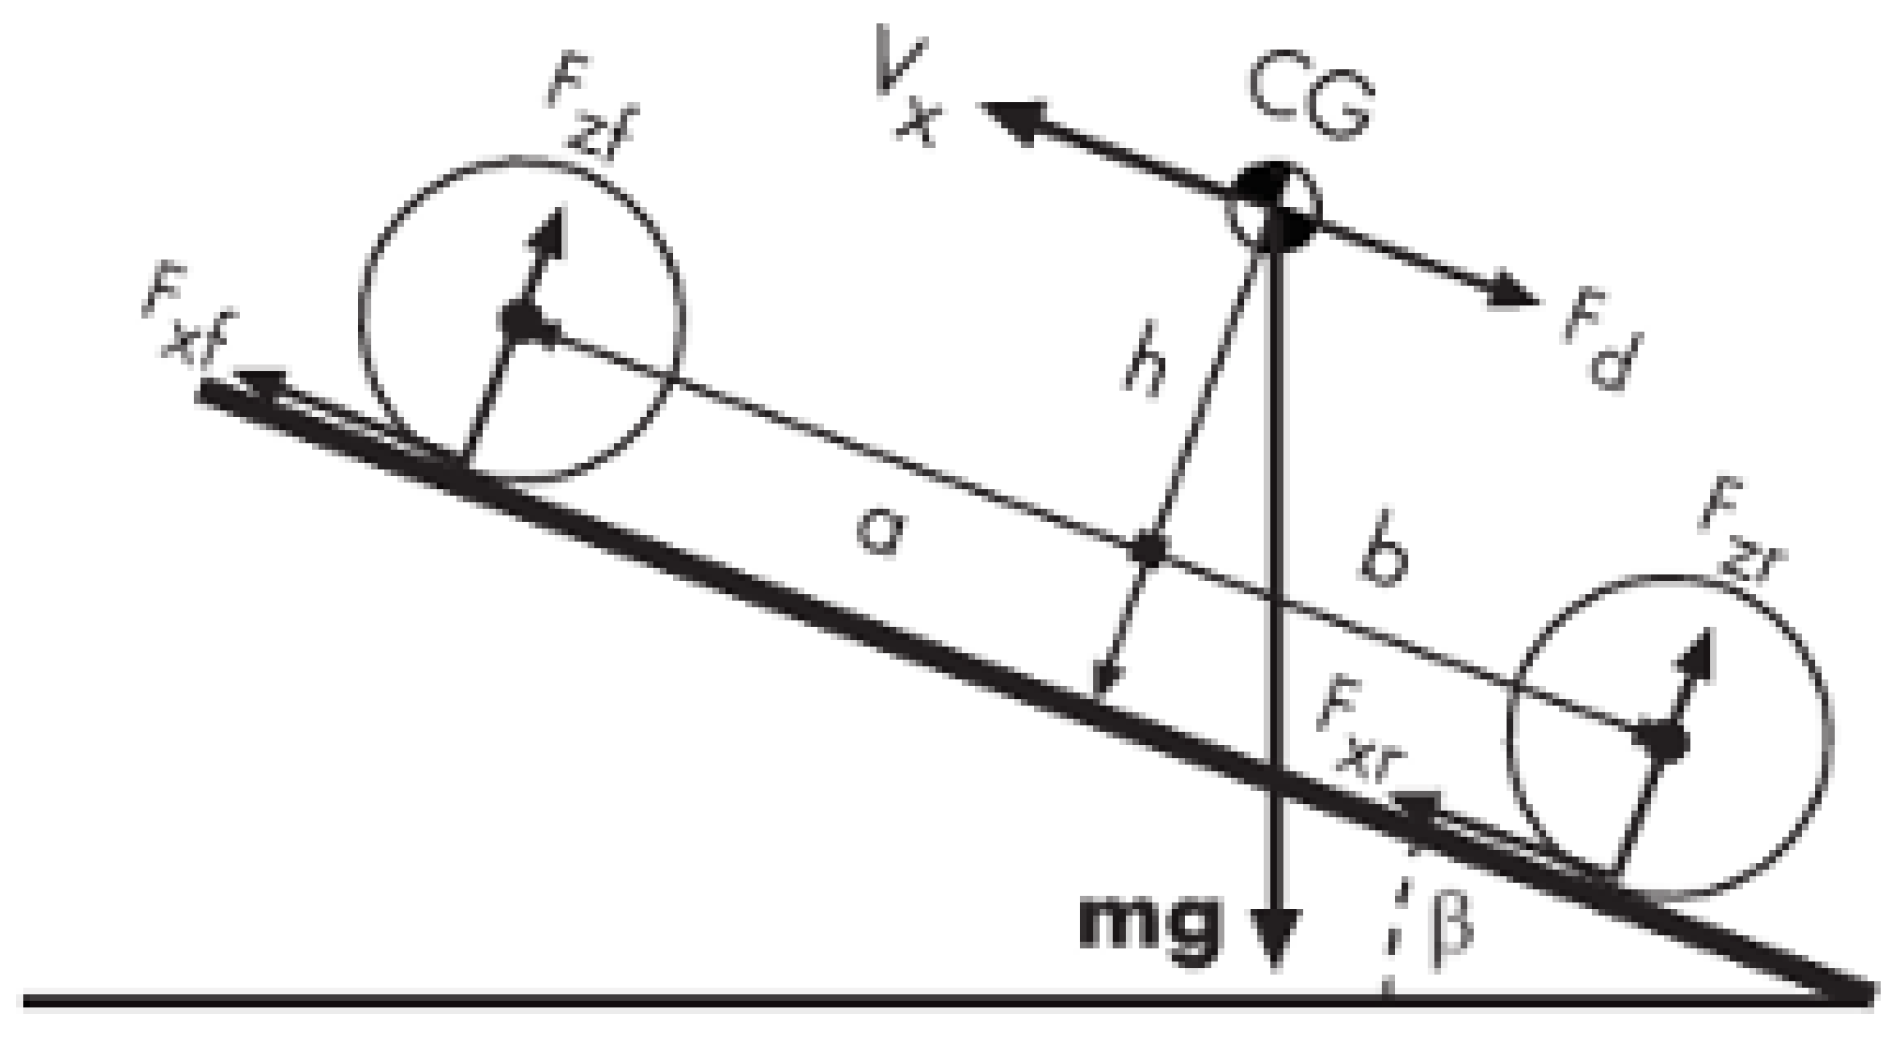
The bicycle frame is at the center of development and is modeled as a rigid body, characterized by its geometry and mass distribution. The bicycle frame also determines the number of wheels per axle and the distribution of the axles throughout the geometry of the bicycle. The bicycle frame also defines the center of gravity (COG).
Figure 2 shows the mechanical model of the bicycle frame used for the model. The frame represents a two-axle vehicle, where the axles are parallel to each other and form a plane.
The equations for the vehicle body are as follows:
where
and
are
The variables and parameters used in Equations (1)–(3) are described in
Table 1.
2.1.2. Wheels and Brakes
The wheels and brake models are important for this study, as we are developing models to evaluate the braking distance and time for the bicycle and will use the developed model to evaluate ABS algorithms in later studies. In the following, we describe both the wheels and brake models.
2.1.3. Wheels and Tires
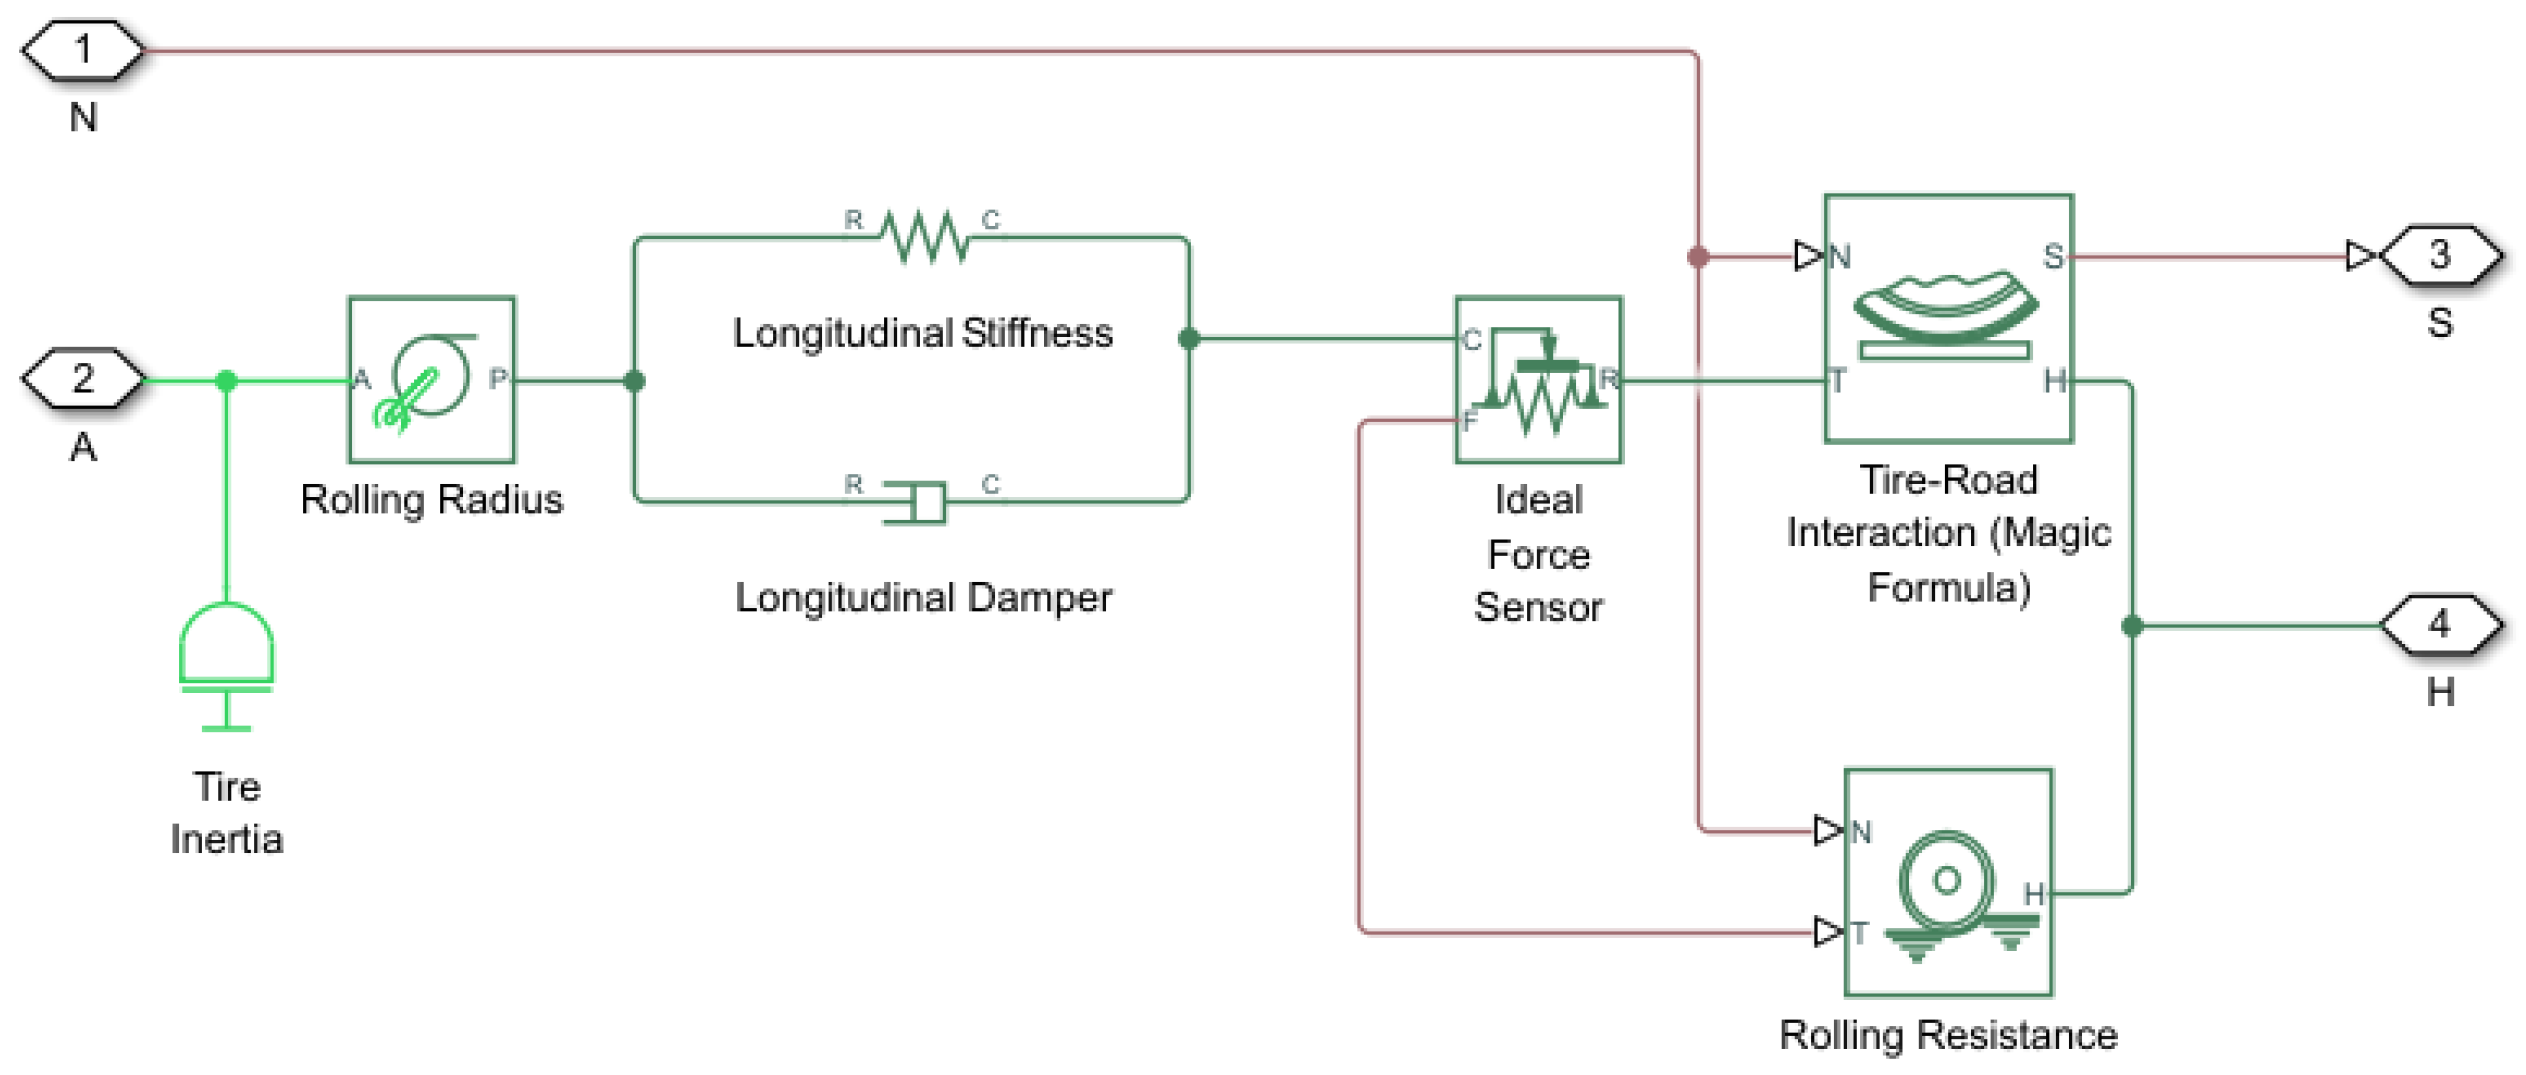
The wheels represent a longitudinal wheel model, with tire dynamics being defined by the Magic Formula. The longitudinal motion axis of the wheels is the same as the longitudinal motion axis of the vehicle frame. The model considers that the wheel is in contact with the road and is subject to wheel slip. When torque is applied to the axle of the wheel, it causes the wheel to rotate. This rotation is transmitted through the tire to generate a longitudinal force,
, at the contact patch with the road surface. In response, the road applies an equal and opposite reaction force to the tire, which propels the wheel, and thus the bicycle, forward, resulting in longitudinal motion [
6,
7].
The general form of the Magic Formula is as follows:
The coefficients
are empirical coefficients called fitting coefficients [
6]. A representation of the tire and wheel model is shown in
Figure 3.
The tire–road interaction can be influenced by modifying the parameters
B,
C,
D, and
E. Within simulations, 3 road conditions are modeled, and the effects of different road surfaces are investigated. The parameters and the road surfaces are shown in
Table 2 [
7].
2.1.4. Brakes
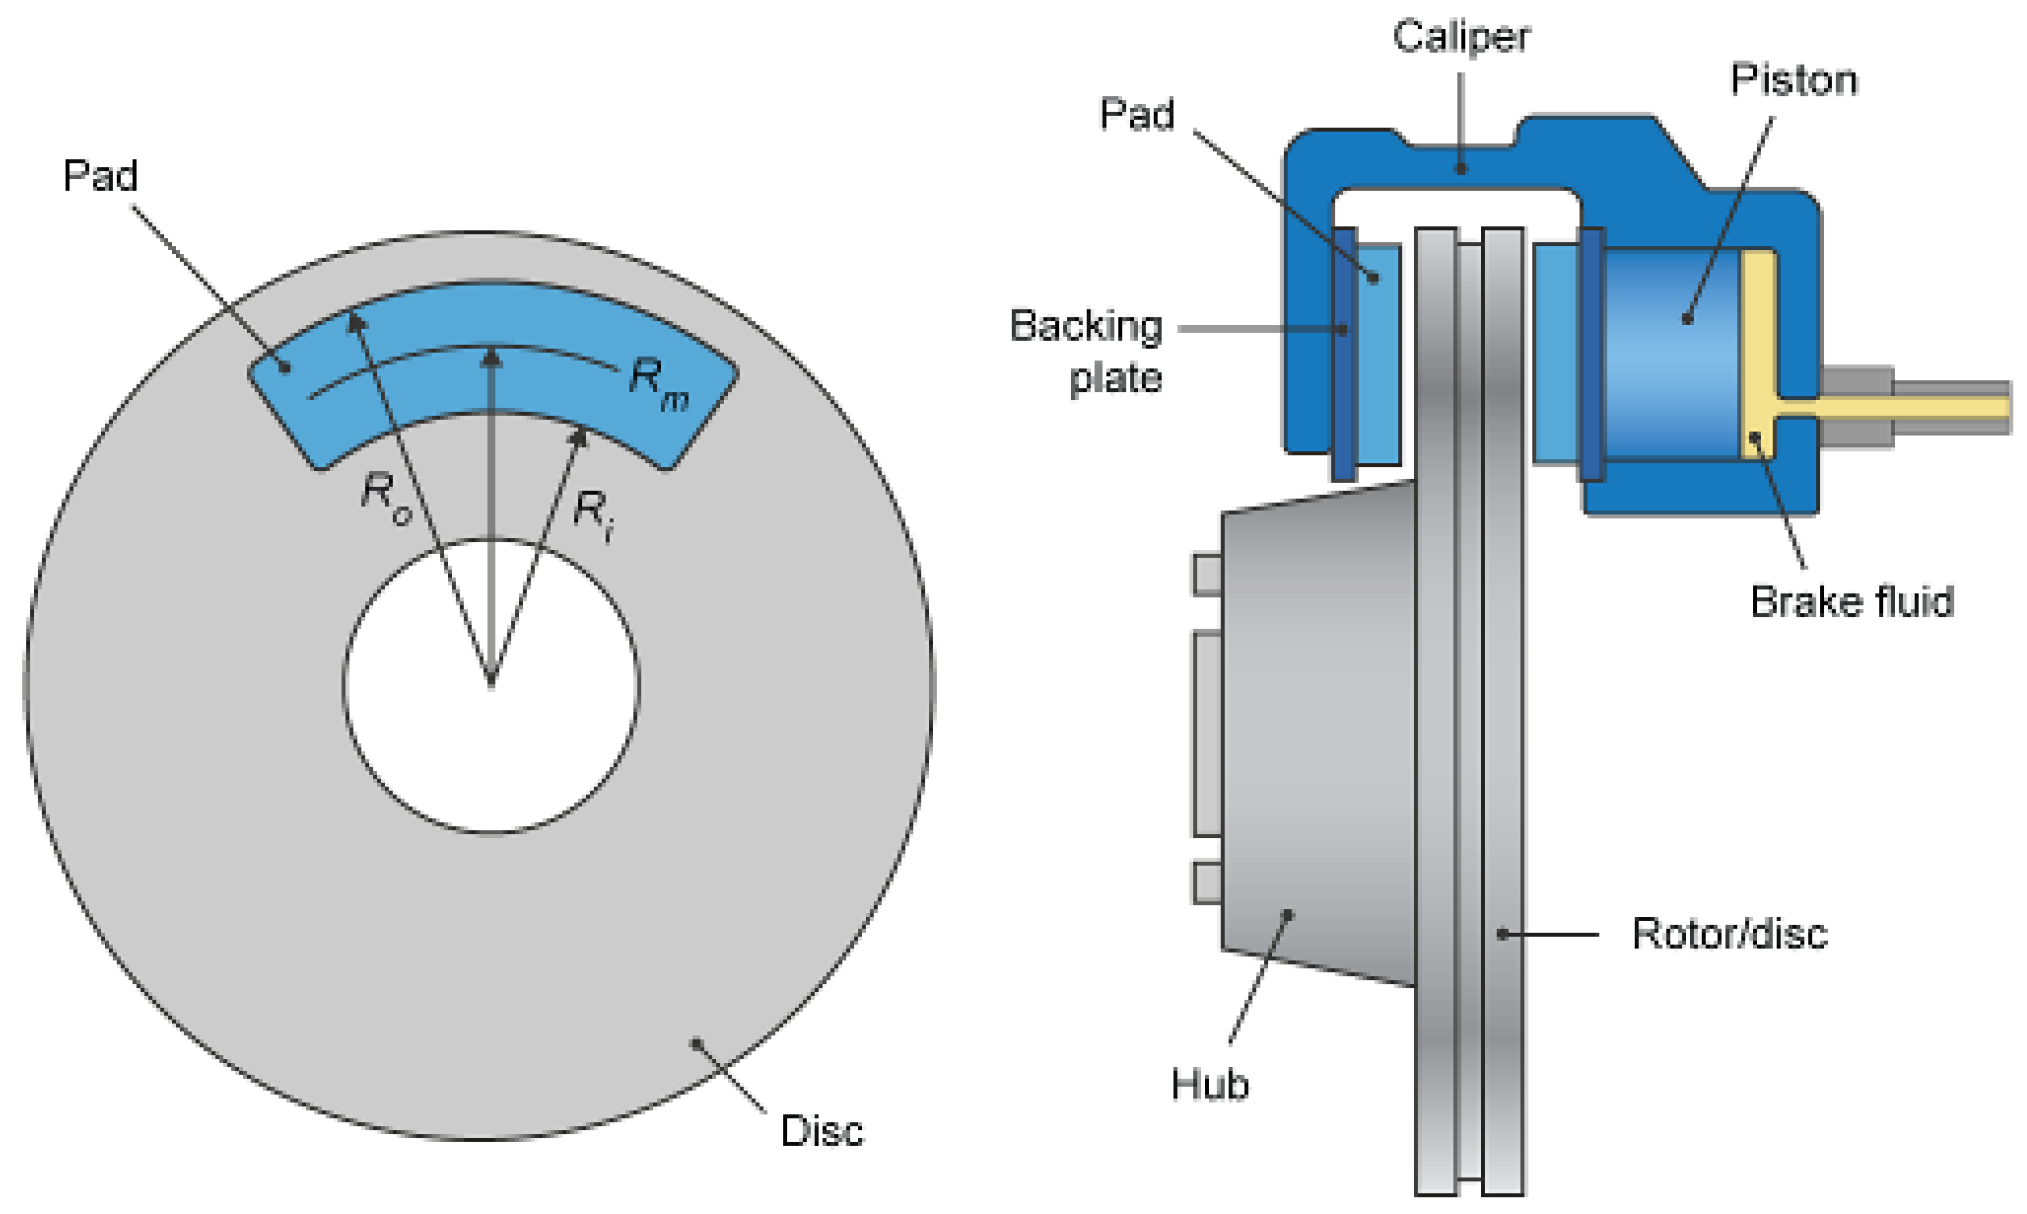
Disk brakes are modeled, where the braking force is exerted through the brake cylinders and transformed to the braking force through the brake pads. The braking force is applied at the mean radius of the brake pad.
Figure 4 shows the characteristics of the disk brakes.
2.1.5. Drivetrain
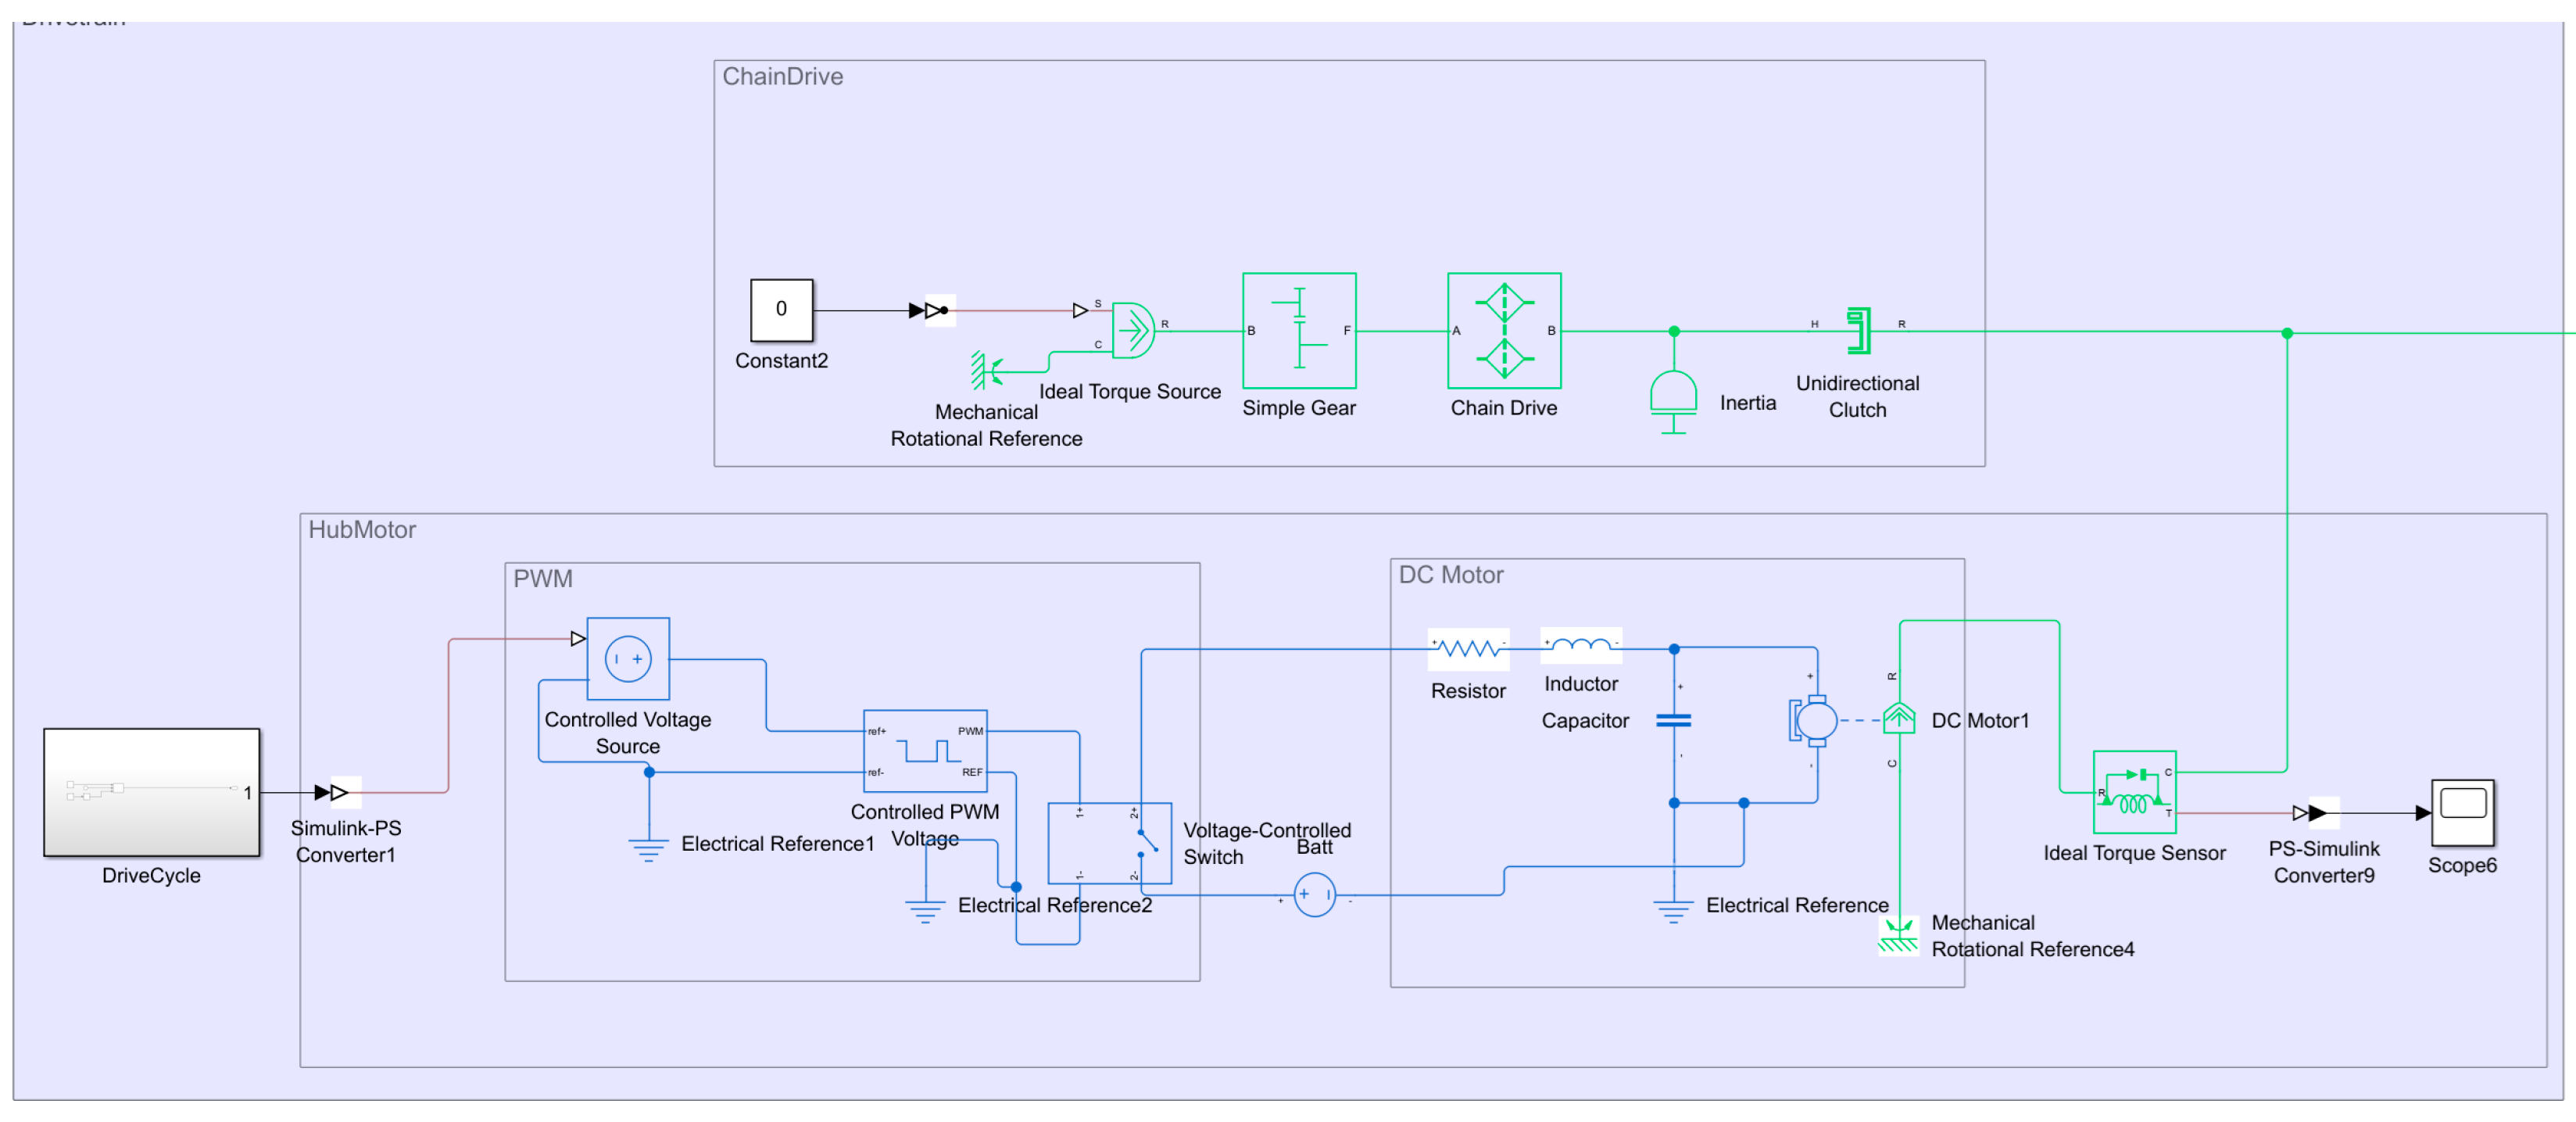
The drivetrain consists of a chain drive that transfers the human pedal force through the system and an electric hub motor that represents the electrical system. A representation of the models is shown in
Figure 5.
The chain drive is modeled as a simple torque input, and throughout the simulation, no human input is added, so the torque on the chaindrive is
. The hub motor is modeled as a DC motor mounted on the rear axle of the bicycle and is powered via a 48 V battery that is modeled as an ideal voltage source. The motor is controlled through pulse width modulation (PWM), where the duty cycle of the PWM is
while the bicycle is accelerating [
11].
2.1.6. Driving Scenario
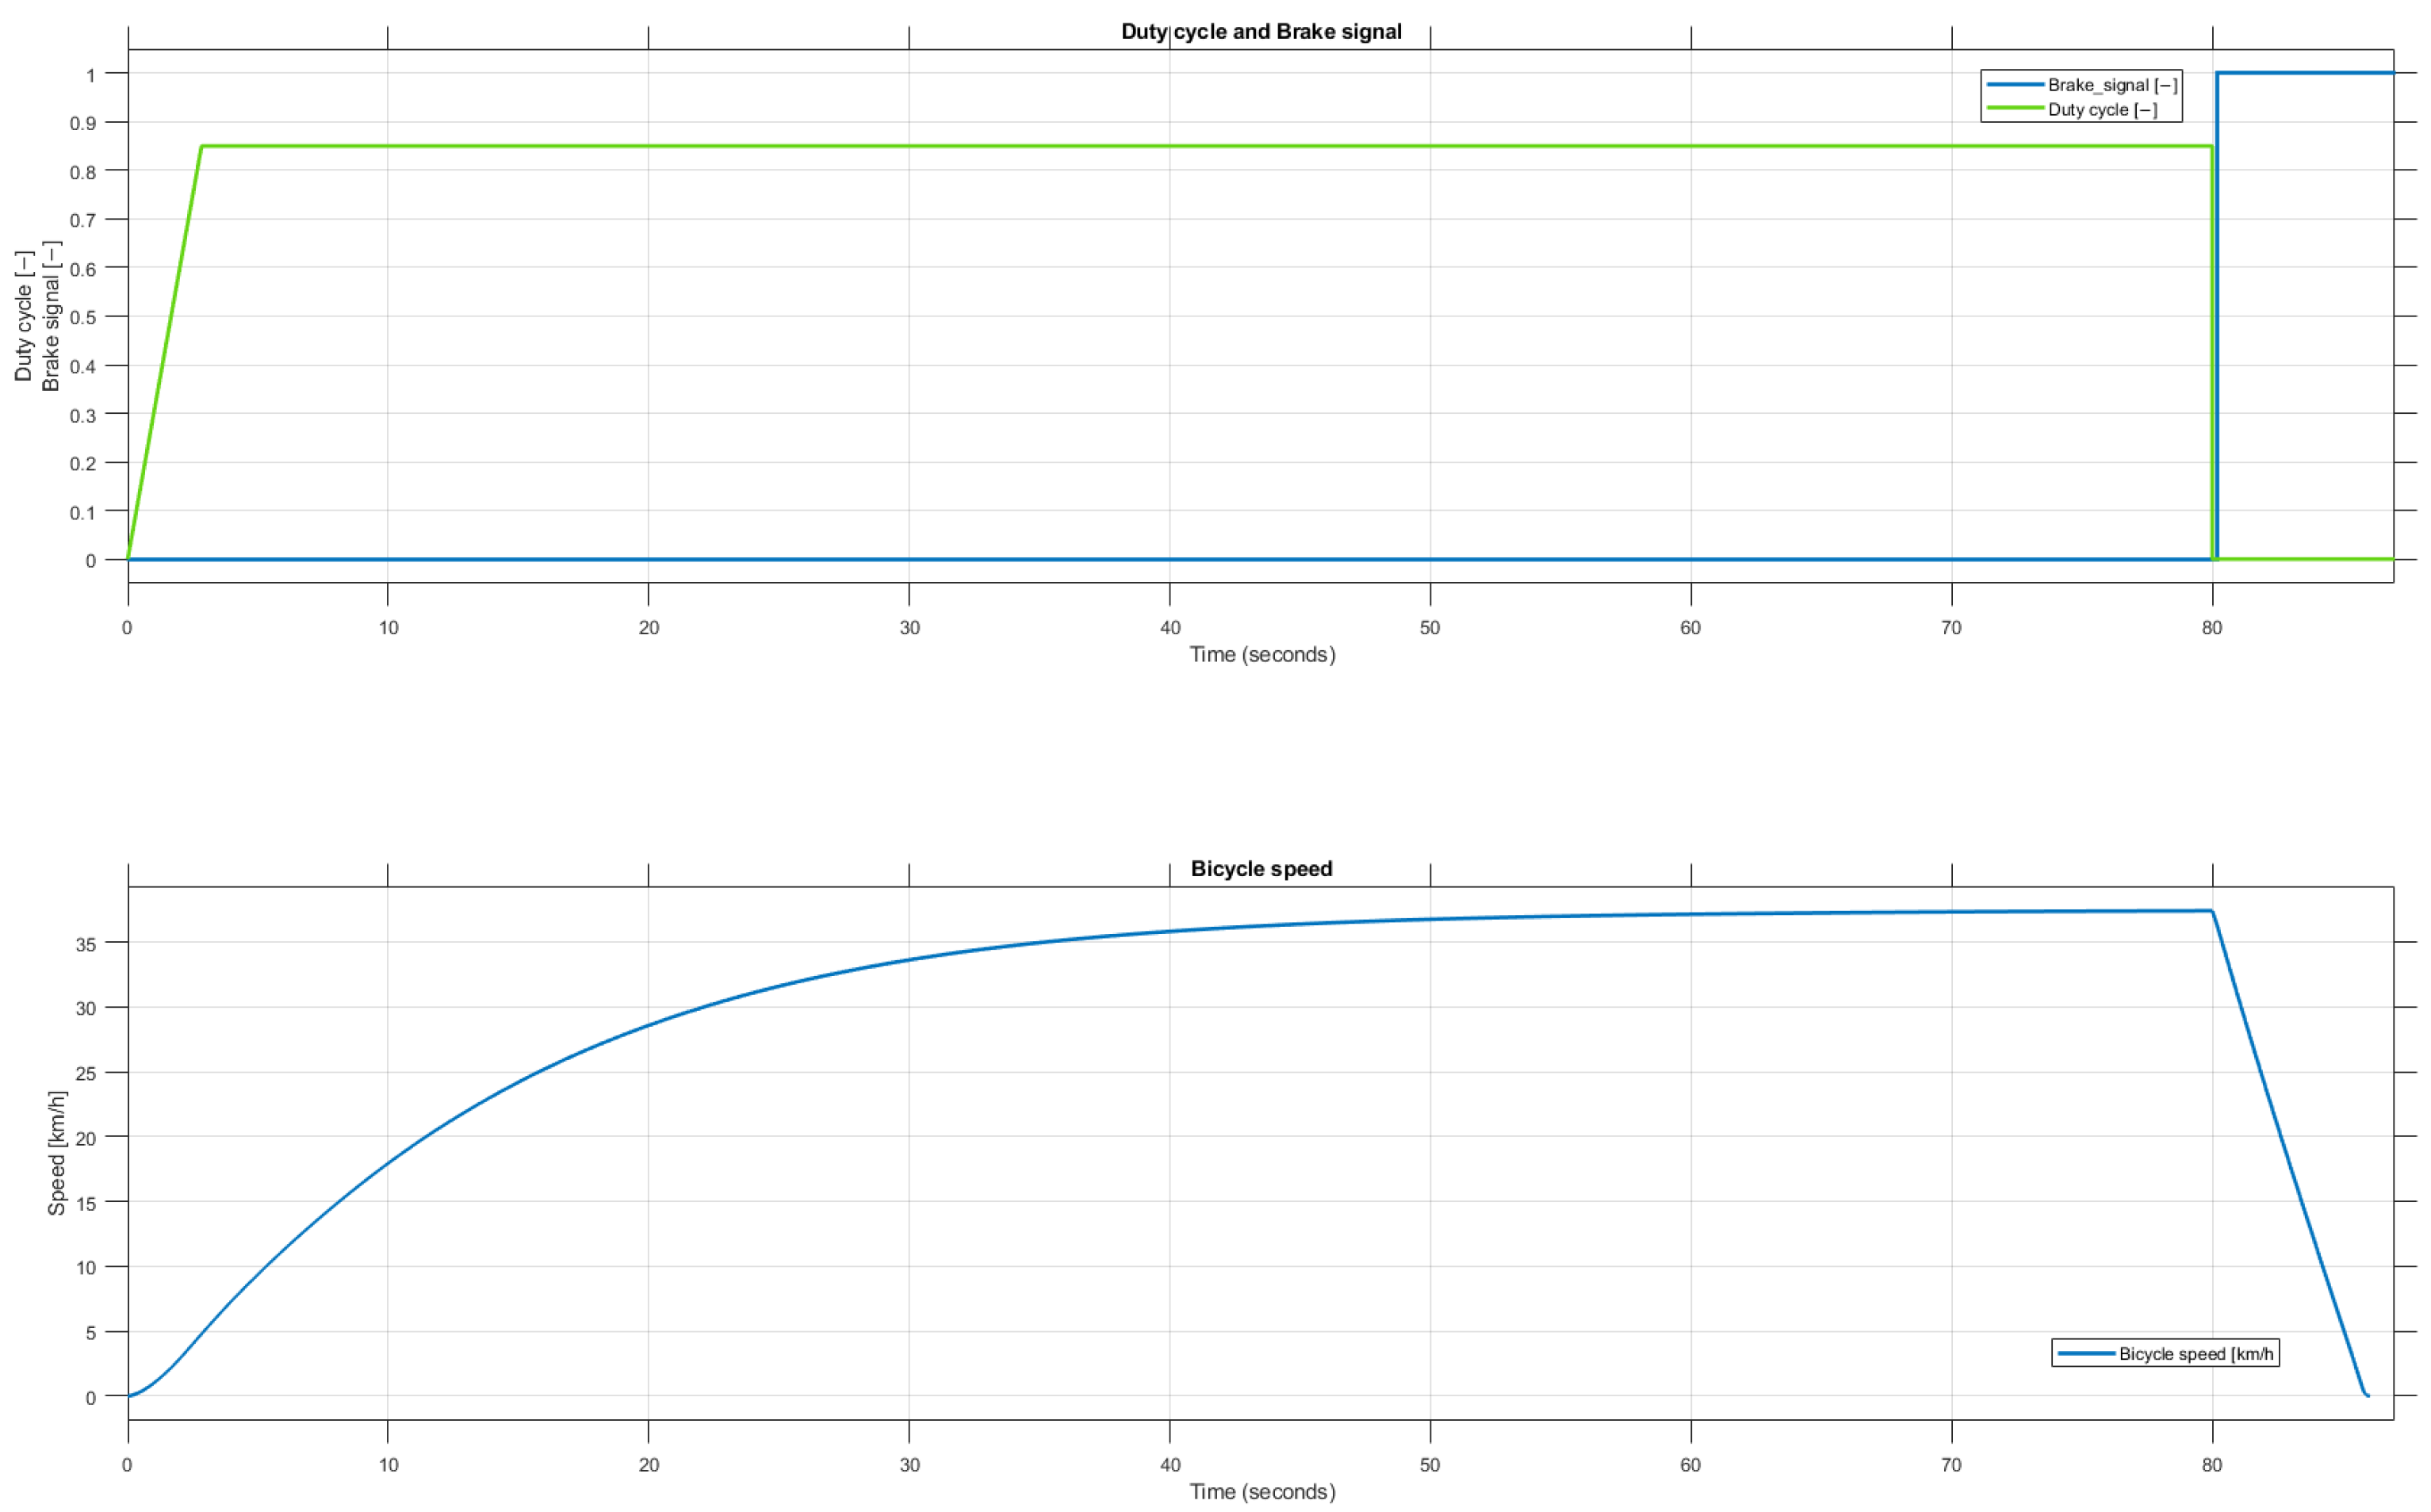
For simulating the braking distance and braking time of the bicycle, we set up a driving scenario. The details of the test setup were as follows:
Acceleration for 80s with duty cycle;
Bicycle reaches speed of
At time full braking is applied to stop the bicycle.
Figure 6 shows the driving scenario and the model response on a dry tarmac surface. The figure shows how the PWM and brake signals are changing at the top of the figure and how the bicycle speed is changing accordingly [
12].
3. Results
Simulations were performed for four different road conditions. We will repeat the same drive cycle for the road conditions listed in
Table 2:
Dry tarmac;
Wet tarmac;
Snow;
Ice.
For simulations, the main parameters of the e-bike are listed in
Table 3.
After postprocessing the simulations, the results indicate the following performance metrics of the bicycle for the braking scenario:
Braking time [s]—time for decceleration from to ;
Braking distance [m]—distance traveled while braking;
Wheel slip [−]—wheel slip parameter calculated via the Pacejka tire model.
The driving profiles of dry tarmac and snow are also demonstrated to compare differences in vehicle speed and wheel slip coefficient in the simulation time domain.
3.1. Driving Scenario Results—Dry Tarmac vs. Snow
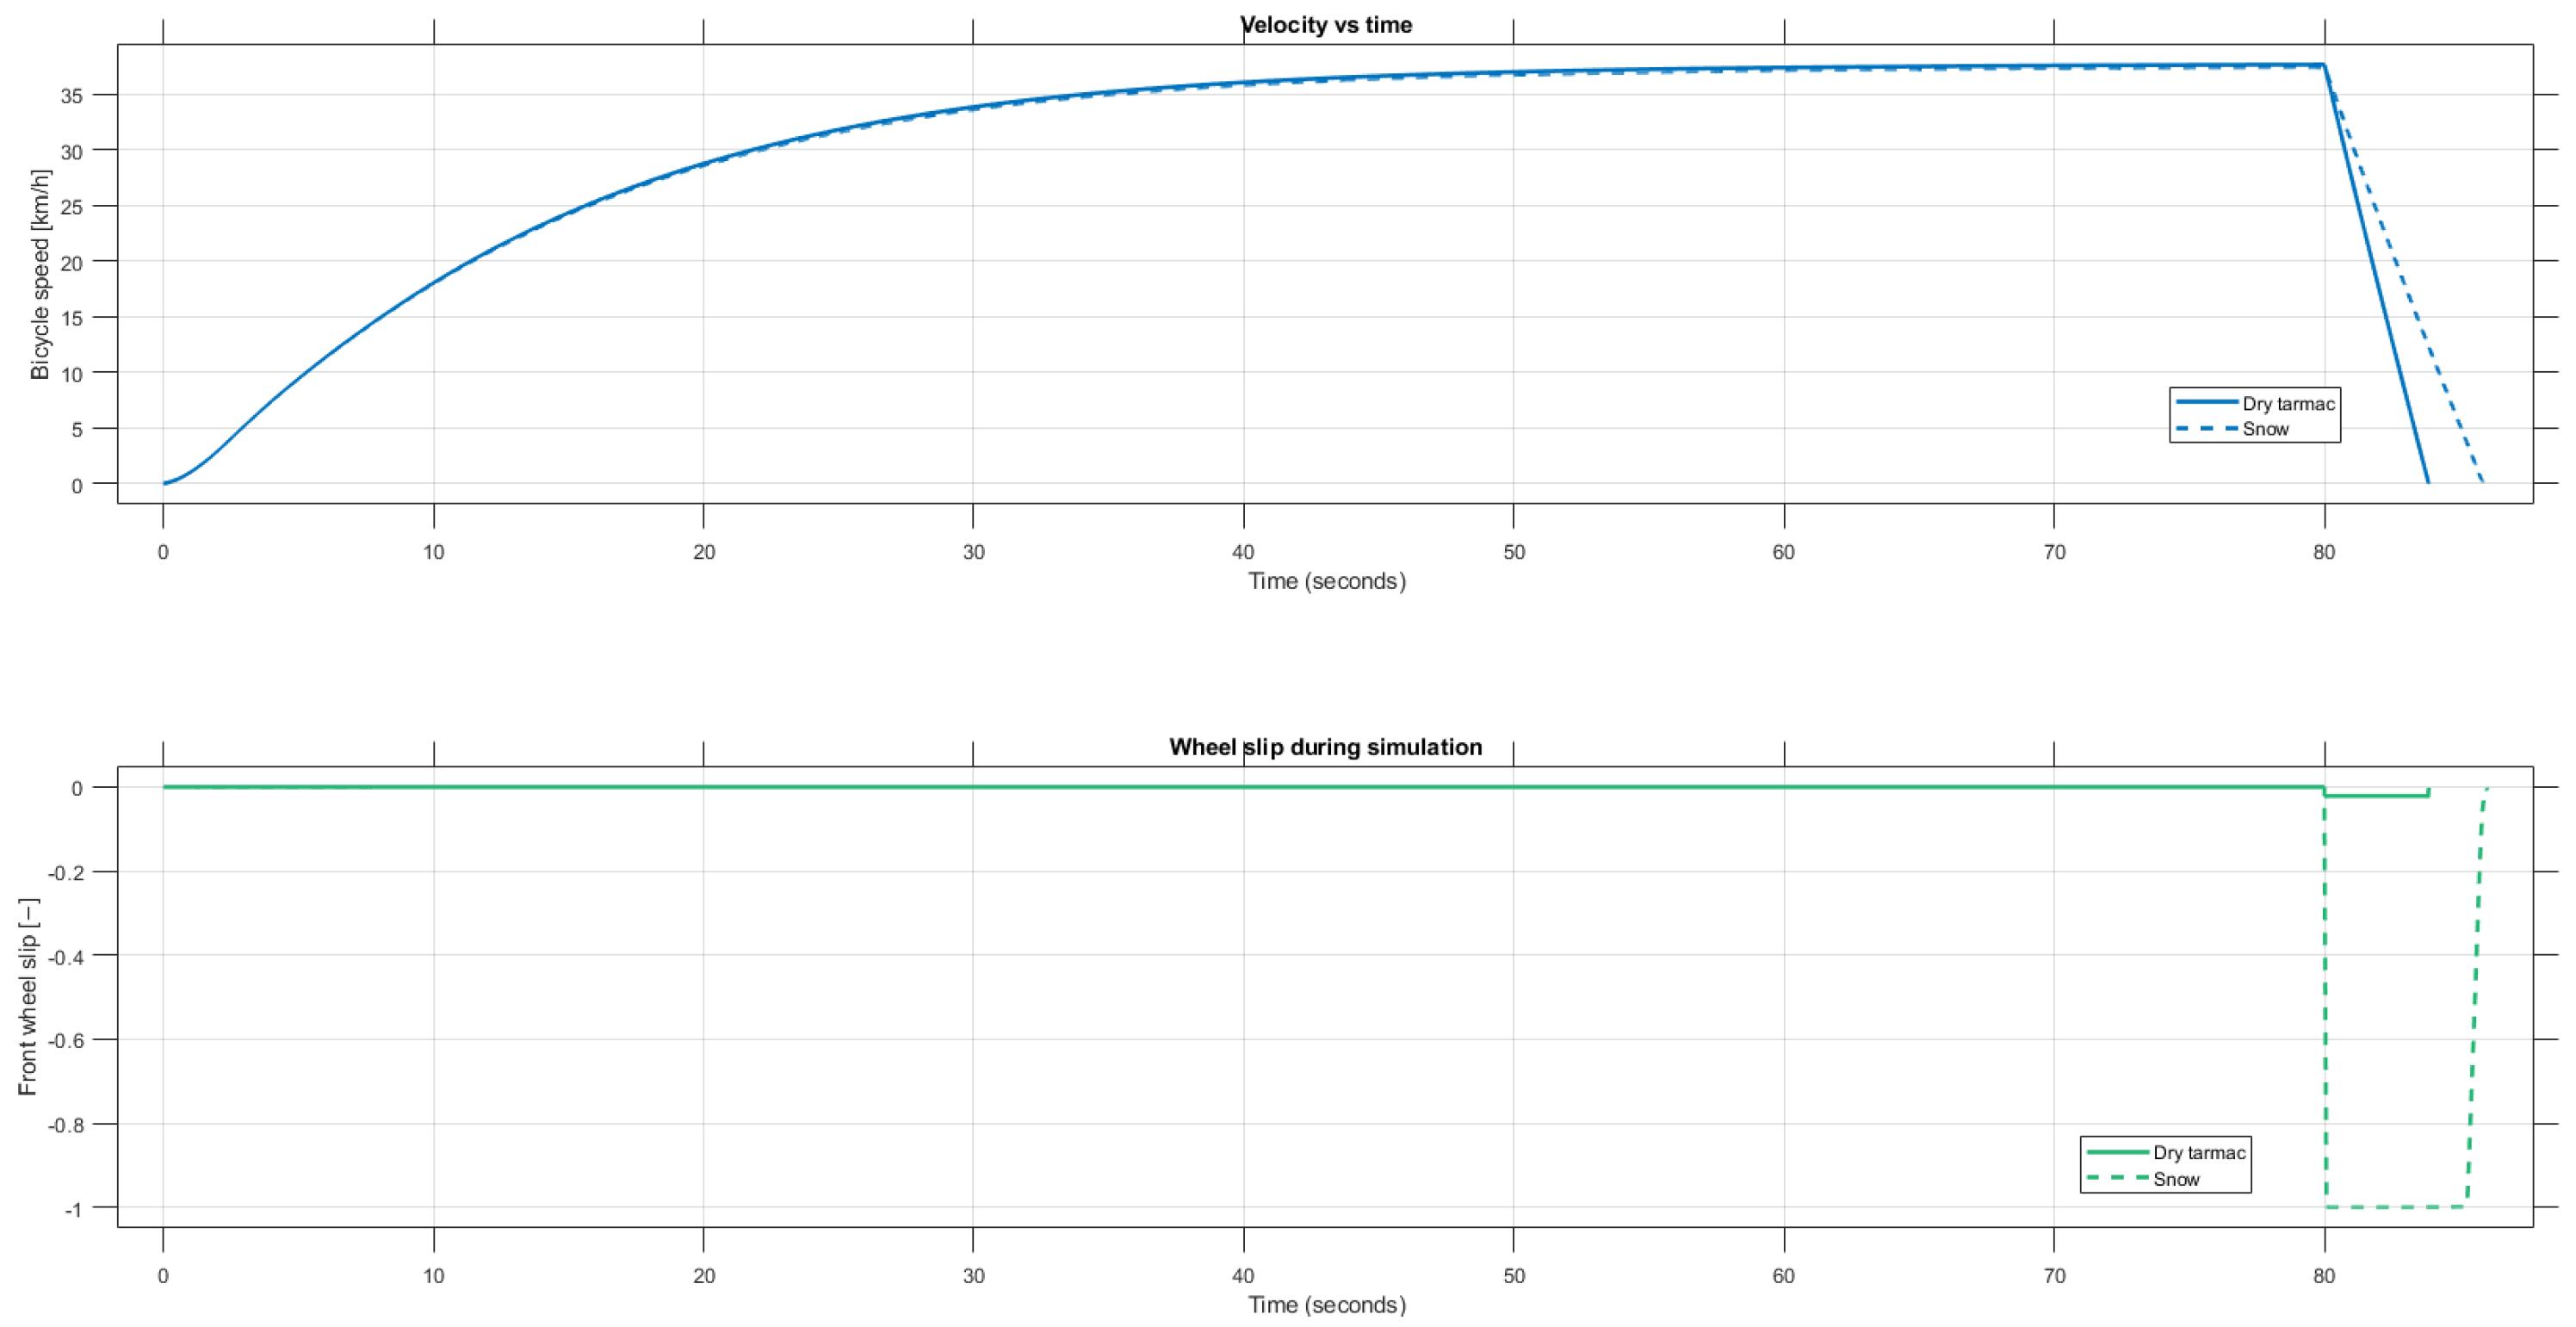
Figure 7 shows that in the acceleration phase, for both road conditions the e-bike is capable of accelerating with a comparable gradient; however, when the braking maneuver starts at 80 s, the simulations show a significant difference. For dry tarmac, the bicycle can stop with small wheel slip values, without locking the wheels. However, for the snowy road, the wheel slip is −1, meaning that the front wheel is locked, and it is not rolling, but slipping over the road surface. From the vehicle speed we also see major differences, the speed decrease is less significant for the snowy road conditions [
13].
3.2. Comparison of Evaluated Braking Characteristics
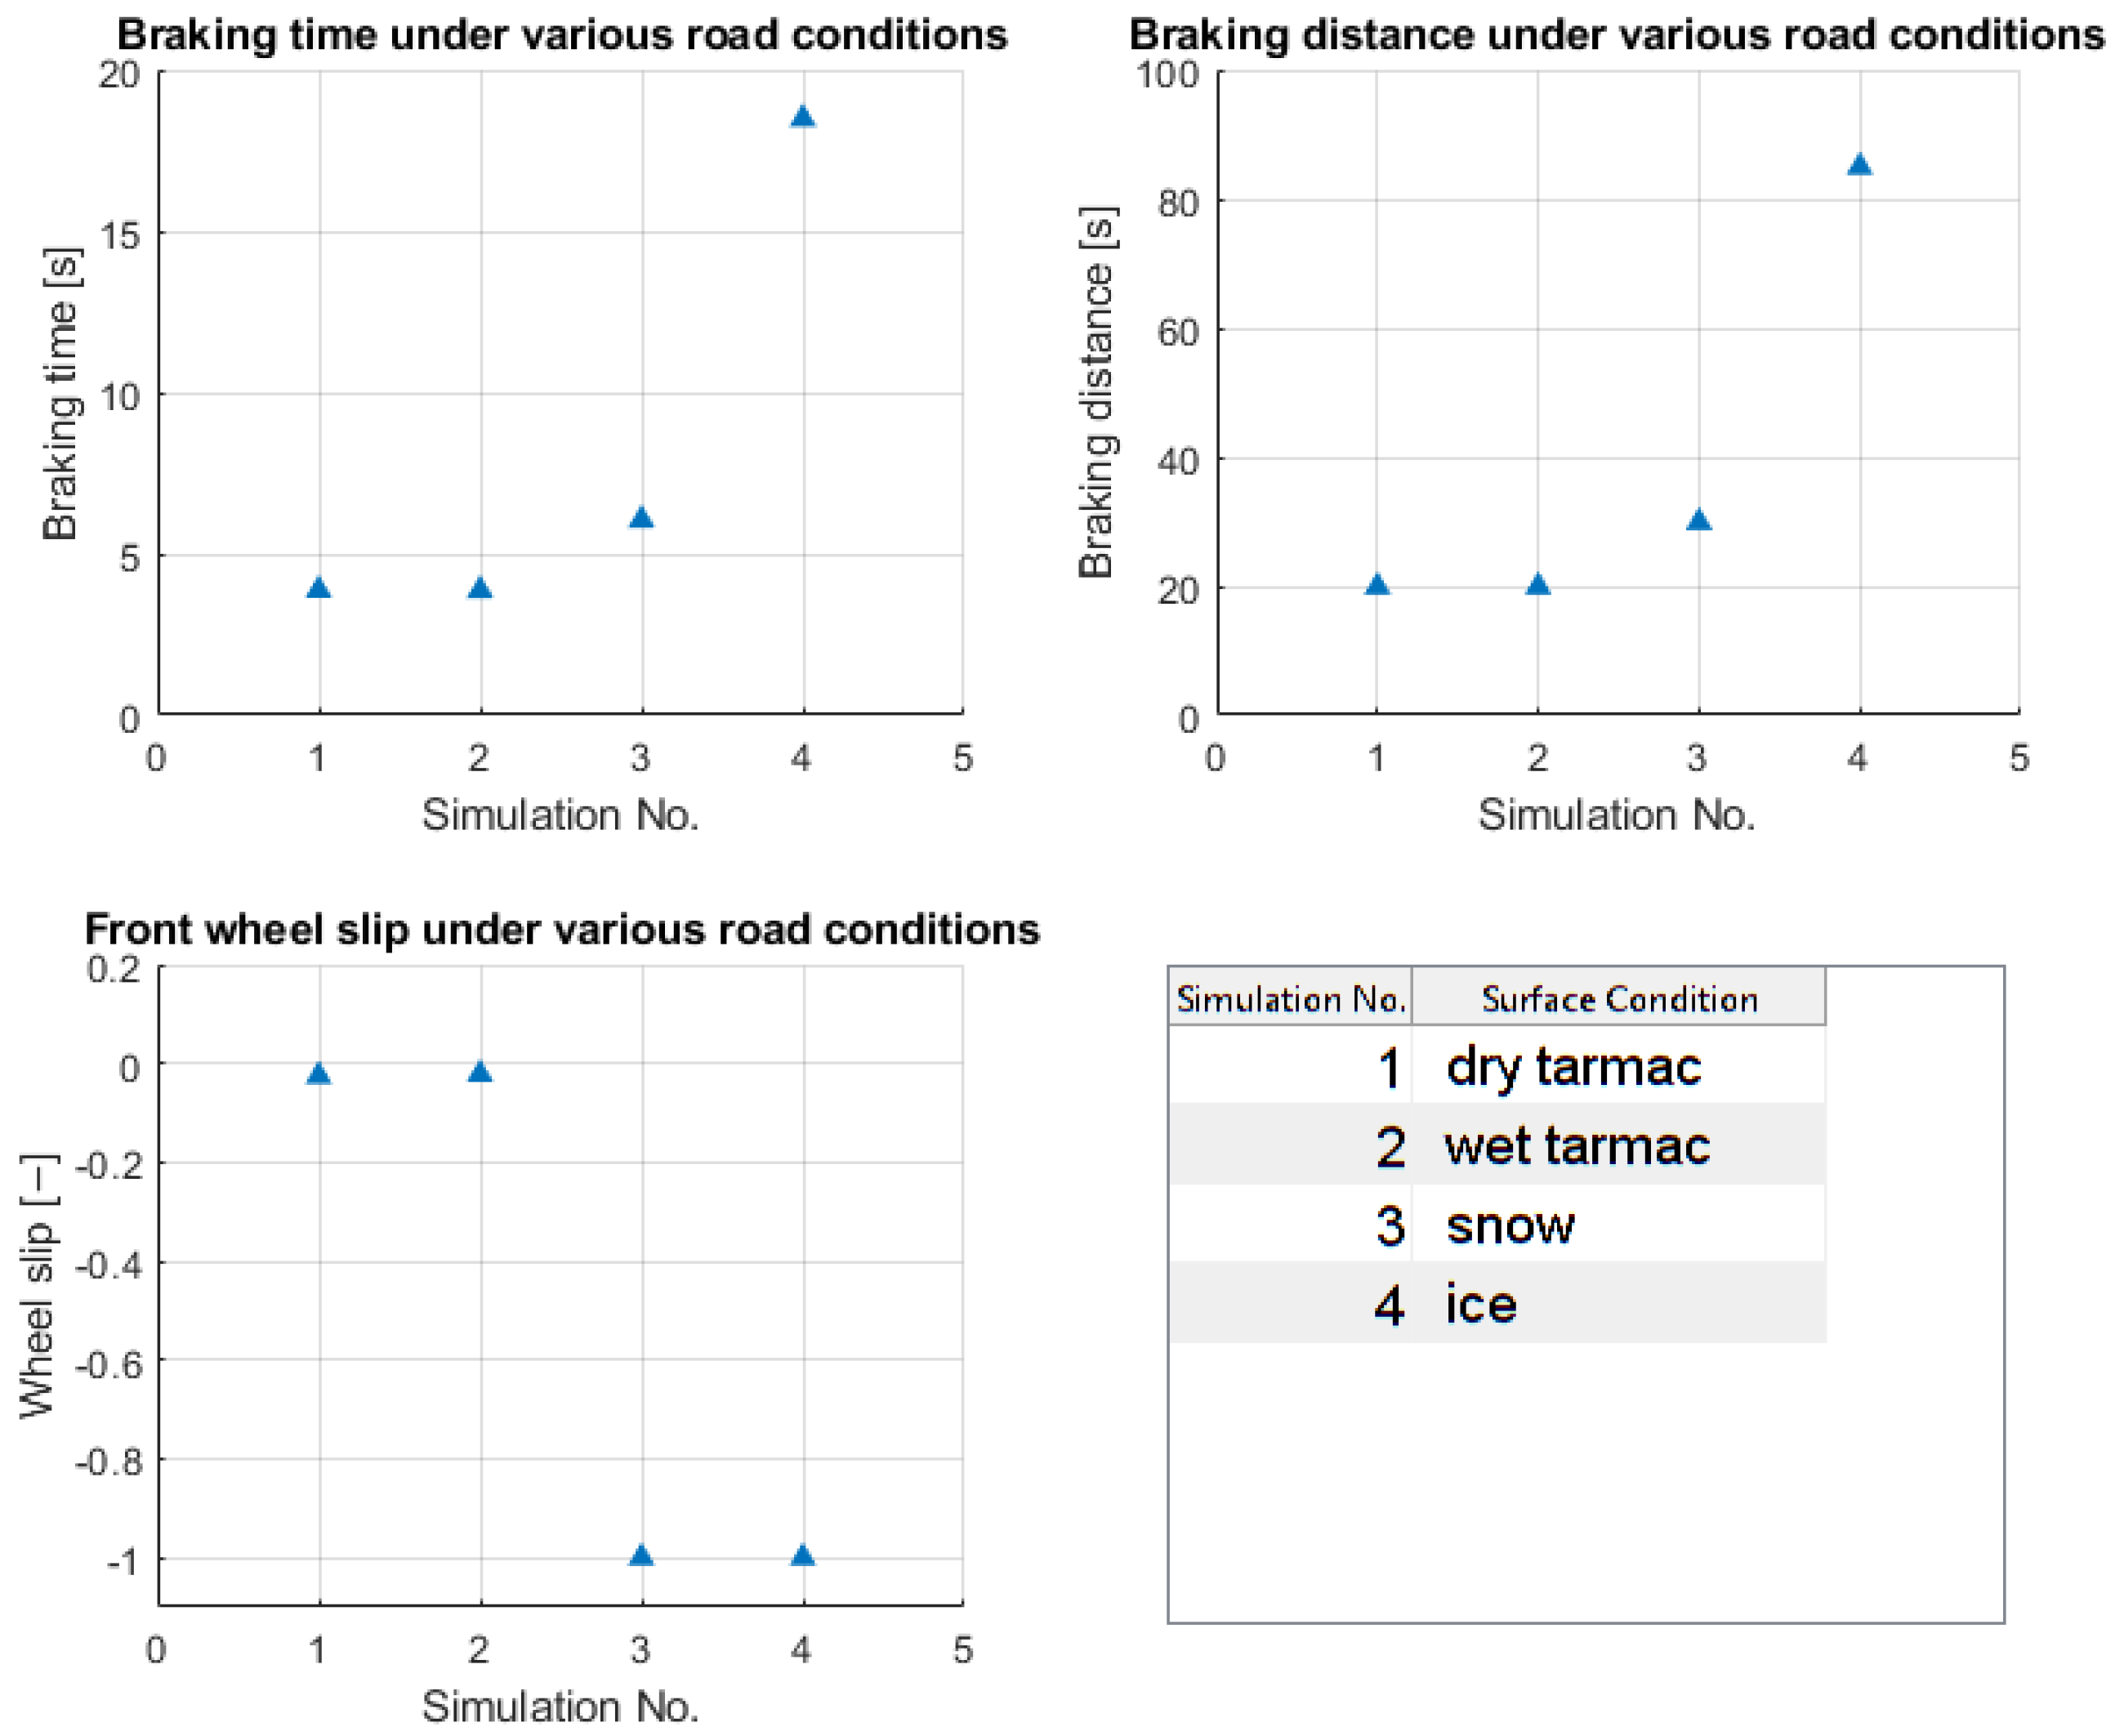
The simulation results for all road conditions are compared in
Figure 8.
The three plots of
Figure 8 show the relevant parameters, and we can see that for dry and wet tarmac, the wheel slip is 0 throughout the simulation, and also there are no differences in the braking time and braking distances. However, for snowy and icy road conditions, in both cases it comes to a wheel lockup, and the braking time and braking distance increase. For the snowy road condition, the braking distance increases by 50%, and for the icy road condition, the increase is over 400%, which is significant [
14].
The simulation results presented in
Figure 8 demonstrate that the developed longitudinal vehicle dynamics model produces realistic and physically consistent behaviors across different road conditions.
3.3. Validation of the Simulation Model
To assess the accuracy of the developed longitudinal dynamics simulation model, its outputs were compared with experimental stopping distance data reported by Lyubenov et al. in Experimental Determination of Bicycles and Electric Bicycle Stopping Distance [
15].
The comparison was conducted for initial velocities ranging from 5 km/h to 35 km/h. In each case, the simulated stopping distance was calculated using identical input conditions to those described in the reference study.
Table 4 presents the measured and simulated stopping distances, along with the percentage errors between them.
The results show that the simulation model predicts stopping distances with a maximum error of 13%. At lower speeds, the slightly higher relative error (9.18% at 5 km/h) is likely due to the increased influence of the rider reaction time and brake application variability in the experimental data, which are difficult to model precisely.
The validation indicates that the developed simulation model reproduces the experimental stopping distance trends with satisfactory accuracy for virtual testing and design evaluation purposes, particularly in the operational speed range of typical e-bike usage.
Overall, the outcomes confirm that the proposed e-bike model is sensitive to changes in tire–road friction and dynamic braking behavior, which are essential requirements for simulating safety-critical scenarios. As such, this model provides a credible foundation for the virtual development and testing of ABS algorithms. It enables the controlled study of wheel slip and braking response, supporting future research aimed at improving braking stability and safety in electric bicycles [
14].
Author Contributions
Conceptualization, B.N. and D.F.; methodology, B.N. and D.F.; software, B.N.; validation, D.F.; formal analysis, B.N.; investigation, B.N.; resources, B.N.; data curation, B.N.; writing—original draft preparation, B.N.; writing—review and editing, D.F.; visualization, B.N.; supervision, D.F.; project administration, B.N. All authors have read and agreed to the published version of the manuscript.
Funding
During the preparation of this manuscript, the authors used ChatGPT from OpenAI, Model GPT-4-turbo, Version—2024 May, for the purposes of grammar checking, reference formatting, and manuscript formatting. The authors have reviewed and edited the output and take full responsibility for the content of this publication. The research was supported by the European Union within the framework of the National Laboratory for Autonomous Systems (RRF-2.3.1-21-2022-00002).
Institutional Review Board Statement
Not applicable.
Informed Consent Statement
Not applicable.
Data Availability Statement
Dataset is available on request from the authors.
Conflicts of Interest
The authors declare no conflicts of interest.
References
- Schepers, J.P.; Fishman, E.; den Hertog, P.; Wolt, K.K.; Schwab, A.L. The Safety of Electrically Assisted Bicycles Compared to Classic Bicycles. Accid. Anal. Prev. 2014, 73, 174–180. [Google Scholar] [CrossRef] [PubMed]
- Savino, G.; Pierini, M.; Fitzharris, M. Motorcycle Active Safety Systems: Assessment of the Function and Applicability Using a Population-Based Crash Data Set. Traffic Inj. Prev. 2019, 20, 404–410. [Google Scholar] [CrossRef] [PubMed]
- Cellier, F.E.; Kofman, E. Continuous System Simulation; Springer: New York, NY, USA, 2006. [Google Scholar] [CrossRef]
- Kofránek, J.; Mateják, M.; Privitzer, P.; Tribula, M. Causal or Acausal Modeling: Labour for Humans or Labour for Machines. In Proceedings of the Technical Computing Prague 2008, Prague, Czech Republic, 11 November 2008; pp. 1–16. [Google Scholar]
- MathWorks. Vehicle Body—Vehicle Body with Two Axles in Longitudinal Motion—MATLAB. Available online: https://www.mathworks.com/help/sdl/ref/vehiclebody.html (accessed on 1 June 2025).
- Pacejka, H.B. Tire and Vehicle Dynamics; Butterworth-Heinemann: Oxford, UK, 2005. [Google Scholar] [CrossRef]
- Lakshmanan, P.; Abhishek, A.; Verma, B.K.; Ram, S.K. Performance Assessment of Two-Wheeler Electric Vehicle Batteries Using Multi-Mode Drive Cycles. World Electr. Veh. J. 2024, 15, 145. [Google Scholar] [CrossRef]
- MathWorks. Tire (Magic Formula)—Tire Defined by Magic Formula Coefficients—MATLAB. Available online: https://www.mathworks.com/help/sdl/ref/tiremagicformula.html (accessed on 1 June 2025).
- MathWorks. Tire-Road Interaction (Magic Formula)—Tire-Road Dynamics Given by Magic Formula Coefficients—MATLAB. Available online: https://www.mathworks.com/help/sdl/ref/tireroadinteractionmagicformula.html (accessed on 1 June 2025).
- MathWorks. Disc Brake—Frictional Brake with Pressure-Applying Cylinder and Pads—MATLAB. Available online: https://www.mathworks.com/help/sdl/ref/discbrake.html (accessed on 1 June 2025).
- Mopidevi, S.; Dasari, K.S.; Bakshu, S.A.; Reddy, B.S. Dynamic Performance Analysis & Sizing of Vehicle Body & Powertrain for 48V Electric 2-Wheeler System. In Proceedings of the 2022 International Conference on Emerging Trends in Engineering and Medical Sciences (ICETEMS), Nagpur, India, 18–19 November 2022; pp. 9–14. [Google Scholar] [CrossRef]
- Sha, A.M.; Thankachan, A.; Hari, P.S.; Poudel, M.; George, G.A.; Thomas, T. Design of Electrical Bicycle Using MATLAB-Simulink. In Proceedings of the 2023 International Conference on Circuit Power and Computing Technologies (ICCPCT), Kollam, India, 10–11 August 2023; pp. 1038–1043. [Google Scholar] [CrossRef]
- Tanelli, M.; Prandini, M.; Codecà, F.; Moia, A.; Savaresi, S.M. Analysing the Interaction between Braking Control and Speed Estimation: The Case of Two-Wheeled Vehicles. In Proceedings of the 2008 IEEE Conference on Decision and Control (CDC), Cancun, Mexico, 9–11 December 2008; pp. 5372–5377. [Google Scholar] [CrossRef]
- Osman, A.; Tawfik, M.; Ali, A.M.; Asfoor, M.S. Evaluation of Electric Vehicle Performance Based on High-Fidelity Modeling and Experimental Testing. In Proceedings of the 2024 6th Novel Intelligent and Leading Emerging Sciences Conference (NILES), Giza, Egypt, 19–21 October 2024; pp. 50–55. Available online: https://ieeexplore.ieee.org/abstract/document/10753161/ (accessed on 1 June 2025).
- Lyubenov, D.; Kadirova, S.; Kadikyanov, G.; Kolev, Z.; Topchu, D. Experimental Determination of Bicycles and Electric Bicycle Stopping Distance. Eng. Proc. 2024, 70, 26. [Google Scholar] [CrossRef]
| Disclaimer/Publisher’s Note: The statements, opinions and data contained in all publications are solely those of the individual author(s) and contributor(s) and not of MDPI and/or the editor(s). MDPI and/or the editor(s) disclaim responsibility for any injury to people or property resulting from any ideas, methods, instructions or products referred to in the content. |
© 2025 by the authors. Licensee MDPI, Basel, Switzerland. This article is an open access article distributed under the terms and conditions of the Creative Commons Attribution (CC BY) license (https://creativecommons.org/licenses/by/4.0/).
