Proceeding Paper

Integrated Production–Distribution Planning for Paper Manufacturing Under Fuzzy Uncertainty †

1
Engineering Sciences, Department Informatics, Logistics and Mathematics, National School of Applied Sciences, Ibn Tofaïl University, Kenitra 14000, Morocco
2
National Higher School of Arts and Professions, Hassan II University, Casablanca 20670, Morocco
3
Faculté des Sciences et Techniques, Université Sultan Moulay Slimane, Beni Mellal 23000, Morocco
4
Laboratory of Engineering, Industrial Management and Innovation, Faculty of Sciences and Techniques, Hassan 1st University, Settat 26000, Morocco
*
Author to whom correspondence should be addressed.
Presented at the 7th edition of the International Conference on Advanced Technologies for Humanity (ICATH 2025), Kenitra, Morocco, 9–11 July 2025.
Eng. Proc. 2025, 112(1), 66; https://doi.org/10.3390/engproc2025112066
Published: 5 November 2025

Abstract

The paper manufacturing industry faces significant challenges in coordinating production and distribution decisions under uncertain market conditions. This research presents an integrated production–distribution planning model for paper manufacturing that addresses demand uncertainty through fuzzy set theory. The model considers multiple paper grades, production facilities, warehouses, and customer zones while minimizing total supply chain costs. A hybrid intelligent algorithm combining genetic algorithms with fuzzy simulation is developed to solve the complex optimization problem. The approach handles fuzzy demand parameters using credibility theory and employs Monte Carlo simulation for fuzzy variable evaluation. Computational experiments demonstrate the effectiveness of the proposed methodology, achieving cost reductions of 12–18% compared to traditional deterministic approaches. The results indicate that the fuzzy–genetic algorithm approach provides robust solutions that perform well under various uncertainty scenarios, making it suitable for practical implementation in paper manufacturing supply chains.

1. Introduction and Literature Review

The paper manufacturing industry represents a critical sector in the global economy, with annual production exceeding 400 million tons worldwide. The industry encompasses diverse product categories including newsprint, packaging materials, tissue products, and specialty papers, each with specific production requirements and market characteristics. Modern paper manufacturing operations face increasing pressure to optimize their supply chain efficiency while maintaining product quality and meeting environmental regulations.
Production–distribution planning in paper manufacturing involves complex decision-making processes that must account for multiple sources of uncertainty. Demand fluctuations, raw material availability, production capacity variations, and transportation constraints create a challenging environment for traditional deterministic optimization approaches. The industry’s unique characteristics, including sequence-dependent machine changeovers, grade-specific quality requirements, and seasonal demand patterns, further complicate the planning process.
Production–distribution planning has received considerable attention in operations research and supply chain management literature. The integration of production and distribution decisions has been shown to provide significant benefits compared to sequential optimization approaches [1]. However, most existing studies focus on deterministic models that assume complete information about system parameters. Santos and Almada-Lobo [2] developed integrated pulp and paper mill planning models, but their approach did not address uncertainty explicitly.
Fuzzy set theory has emerged as a powerful tool for handling uncertainty in supply chain optimization problems. Unlike stochastic approaches that require precise probability distributions, fuzzy theory can model imprecise and subjective information commonly encountered in industrial planning [3]. The credibility theory framework provides a mathematical foundation for optimizing systems with fuzzy parameters, making it particularly suitable for paper manufacturing applications where expert knowledge and linguistic variables play important roles [4].
Fuzzy set theory applications in supply chain optimization have grown substantially in recent years. The theory provides a natural framework for modeling uncertainty arising from imprecise information, expert judgments, and linguistic variables. Credibility theory, developed as an extension of fuzzy set theory, offers mathematical tools for optimization under fuzzy uncertainty [5]. Peidro et al. [6] provided a comprehensive review of quantitative models for supply chain planning under uncertainty, highlighting the advantages of fuzzy approaches over traditional stochastic methods.
The integration of production and distribution planning decisions has been recognized as essential for achieving supply chain efficiency. Traditional sequential approaches that optimize production and distribution separately often lead to suboptimal solutions due to the interdependencies between these decisions. Integrated models can capture these relationships and provide better overall system performance. Torabi and Hassini [7] developed an interactive possibilistic programming approach for multiple-objective supply chain master planning, demonstrating the benefits of integrated decision-making under uncertainty.
Genetic algorithms have proven effective for solving complex optimization problems in manufacturing and supply chain contexts [8]. Their ability to handle non-linear, multi-modal objective functions and discrete variables makes them suitable for production–distribution planning problems. The combination of genetic algorithms with fuzzy simulation techniques has shown promise in handling uncertain parameters, as demonstrated in various applications across different industries.
Paper manufacturing optimization has been studied from various perspectives, including production scheduling, inventory management, and distribution planning. However, few studies have addressed the integrated production–distribution problem under fuzzy uncertainty. The unique characteristics of paper manufacturing, such as machine compatibility constraints and grade-specific requirements, require specialized modeling approaches. Mula et al. [9] reviewed models for production planning under uncertainty but did not specifically address the paper manufacturing context or the integration of distribution decisions.
This research addresses the gap between theoretical optimization models and practical implementation in paper manufacturing by developing an integrated production–distribution planning framework that explicitly considers fuzzy uncertainty. The main contributions include the following:
1.
Development of a comprehensive integrated production–distribution model for paper manufacturing under fuzzy uncertainty.
2.
Application of credibility theory to handle uncertain demand parameters consistently.
3.
Design of a hybrid intelligent algorithm combining genetic algorithms with fuzzy simulation.
4.
Extensive computational validation demonstrating the effectiveness of the proposed approach.
The remainder of this paper is organized as follows: Section 2 presents the mathematical model formulation, Section 3 describes the solution methodology, Section 4 provides computational results and analysis, and Section 5 concludes with key findings and future research directions.

2. Mathematical Model Formulation

This section presents the integrated production–distribution planning model for paper manufacturing under fuzzy uncertainty. The model considers multiple paper grades, production facilities, warehouses, and customer zones with the objective of minimizing total supply chain costs.

2.1. Sets and Indices

The following sets and indices are defined:
P = { 1 , 2 , . . . , p } Set of paper grades M = { 1 , 2 , . . . , m } Set of production facilities W = { 1 , 2 , . . . , w } Set of warehouses C = { 1 , 2 , . . . , c } Set of customer zones T = { 1 , 2 , . . . , t } Set of time periods R = { 1 , 2 , . . . , r } Set of raw materials P M p M Set of facilities capable of producing grade p R M p R Set of raw materials required for grade p

2.2. Parameters

The model parameters include both crisp and fuzzy variables:

2.2.1. Crisp Parameters

p c p m t : Production cost of grade p at facility m in period t s c p m t : Setup cost for grade p at facility m in period t h c m t p : Holding cost of grade p at facility m in period t h c w p t w : Holding cost of grade p at warehouse w in period t t c m w p t m w : Transportation cost from facility m to warehouse w for grade p in period t t c w c p t w c : Transportation cost from warehouse w to customer c for grade p in period t C A P m t : Production capacity of facility m in period t W C A P w t : Storage capacity of warehouse w in period t α p r : Consumption rate of raw material r for grade p τ p m : Processing time of grade p at facility m per unit B C c p t : Shortage cost for customer c , grade p in period t M b i g : Large constant for big - M constraints

2.2.2. Fuzzy Parameters

The uncertain parameters are modeled as fuzzy variables:
D ˜ c p t : Fuzzy demand of customer c for grade p in period t R C ˜ r t : Fuzzy cost of raw material r in period t Q ˜ p m t : Fuzzy quality yield of grade p at facility m in period t A ˜ r t : Fuzzy availability of raw material r in period t

2.3. Decision Variables

The model includes the following decision variables:
X p m t 0 : Production quantity of grade p at facility m in period t Y p m t { 0 , 1 } : Binary setup variable for grade p at facility m in period t Z m w p t 0 : Shipment quantity from facility m to warehouse w for grade p in period t U w c p t 0 : Shipment quantity from warehouse w to customer c for grade p in period t I m t p 0 : Inventory of grade p at facility m at end of period t I w p t w 0 : Inventory of grade p at warehouse w at end of period t S c p t 0 : Shortage of grade p at customer c in period t V r t 0 : Procurement quantity of raw material r in period t

2.4. Objective Function

The objective is to minimize the expected total supply chain cost under fuzzy uncertainty:
min E [ T C ] = E p = 1 p m = 1 m t = 1 t ( p c p m t · X p m t + s c p m t · Y p m t + h c m t p · I m t p ) + E w = 1 w p = 1 p t = 1 t h c w p t w · I w p t w + E m = 1 m w = 1 w p = 1 p t = 1 t t c m w p t m w · Z m w p t + E w = 1 w c = 1 c p = 1 p t = 1 t t c w c p t w c · U w c p t + E r = 1 r t = 1 t R C ˜ r t · V r t + E c = 1 c p = 1 p t = 1 t B C c p t · S c p t

2.5. Constraints

The model is subject to the following constraints:
Production Capacity Constraints:
p P M m τ p m · X p m t C A P m t , m , t
Production-Setup Linking Constraints:
X p m t M b i g · Y p m t , p , m , t
X p m t 0 , p , m , t
Facility Inventory Balance:
I m , t 1 p + X p m t w = 1 w Z m w p t = I m t p , p , m , t
Warehouse Inventory Balance:
I w p , t 1 w + m = 1 m Z m w p t c = 1 c U w c p t = I w p t w , w , p , t
Warehouse Capacity Constraints:
p = 1 p I w p t w W C A P w t , w , t
Fuzzy Demand Satisfaction:
C r w = 1 w U w c p t D ˜ c p t S c p t α , c , p , t
where C r { · } represents the credibility measure and α is the confidence level.
Raw Material Availability:
C r V r t A ˜ r t β , r , t
Raw Material Requirements:
r R M p α p r · V r t m = 1 m X p m t , p , t
Quality Constraints:
C r X p m t · Q ˜ p m t Q m i n · Y p m t γ , p , m , t
where Q m i n is the minimum quality requirement and γ is the confidence level for quality constraints.
Non-negativity and Binary Constraints:
X p m t , Z m w p t , U w c p t , I m t p , I w p t w , S c p t , V r t 0 Y p m t { 0 , 1 }

3. Solution Methodology

This section describes the hybrid intelligent algorithm that combines genetic algorithms with fuzzy simulation to solve the integrated production–distribution planning problem under fuzzy uncertainty.

3.1. Credibility Theory for Fuzzy Parameters

The fuzzy parameters in the model are handled using credibility theory, which provides a self-dual measure for fuzzy events. For a fuzzy variable ξ ˜ with membership function μ ξ ˜ ( x ) , the credibility measure is defined as
C r { ξ ˜ x } = 1 2 Pos { ξ ˜ x } + Nec { ξ ˜ x }
where
Pos { ξ ˜ x } = sup u x μ ξ ˜ ( u )
Nec { ξ ˜ x } = 1 sup u > x μ ξ ˜ ( u )
For triangular fuzzy numbers ξ ˜ = ( a , b , c ) , the credibility measure can be calculated as
C r { ξ ˜ x } = 0 if x < a 2 ( x a ) b a + x a if a x b c + b 2 x c + b 2 x + x b if b x c 1 if x > c
This credibility framework ensures that fuzzy constraints have intuitive probabilistic interpretations while maintaining mathematical rigor in the optimization process.

3.2. Fuzzy Simulation

To solve the fuzzy optimization model, we need to handle three types of uncertain functions involving fuzzy variables. Following the credibility theory framework, we design specific simulation algorithms for each type.

3.2.1. Credibility Measure Simulation

For constraints of the form C r { ξ ˜ r } α , where ξ ˜ represents fuzzy demand or other fuzzy parameters, we use the following simulation in Algorithm 1:
Algorithm 1 Fuzzy Simulation for Credibility Measure
1:
Initialize k = 1
2:
for  k = 1 to N do
3:
   Randomly generate u i from ε -level sets of fuzzy variables ξ ˜ i , i = 1 , 2 , , m
4:
   Set u k = ( u 1 , u 2 , , u m ) and μ ( u k ) = μ 1 ( u 1 ) μ 2 ( u 2 ) μ m ( u m )
5:
end for
6:
Calculate L = 1 2 max 1 k N { μ ( u k ) | g ( x , u k ) 0 } + min 1 k N { 1 μ ( u k ) | g ( x , u k ) > 0 }
7:
return L as the credibility measure
where ε is a sufficiently small positive number, N is the number of simulation runs, and g ( x , u k ) represents the constraint function.

3.2.2. Expected Value Simulation

For expected value functions E [ C ˜ ( x , ξ ˜ ) ] , we employ the following simulation approach in Algorithm 2:
Algorithm 2 Fuzzy Simulation for Expected Value
 1:
Set E = 0
 2:
Randomly generate u 1 j , u 2 j , , u m j from ε -level sets of fuzzy variables ξ ˜ 1 , ξ ˜ 2 , , ξ ˜ m
 3:
Denote u j = ( u 1 j , u 2 j , , u m j ) , j = 1 , 2 , , M
 4:
Set a = C ( x , u 1 ) C ( x , u 2 ) C ( x , u M )
 5:
Set b = C ( x , u 1 ) C ( x , u 2 ) C ( x , u M )
 6:
for  i = 1 to N do
 7:
   Randomly generate r from [ a , b ]
 8:
   if  r 0  then
 9:
        E = E + C r { C ( x , ξ ˜ ) r }
10:
   else
11:
        E = E C r { C ( x , ξ ˜ ) r }
12:
   end if
13:
end for
14:
E [ C ( x , ξ ˜ ) ] = ( a 0 ) + ( b 0 ) + E · ( b a ) / N
15:
return  E [ C ( x , ξ ˜ ) ]

3.2.3. α -Level Cost Simulation

For α -cost optimization problems where we need to find the minimum cost in Algorithm 3 C 0 such that C r { C ( x , ξ ˜ ) C 0 } α :
Algorithm 3 Fuzzy Simulation for α -Level Cost
1:
Initialize k = 1
2:
for  k = 1 to N do
3:
   Randomly generate u i from ε -level sets of fuzzy variables ξ ˜ i , i = 1 , 2 , , m
4:
   Set u k = ( u 1 , u 2 , , u m ) and μ ( u k ) = μ 1 ( u 1 ) μ 2 ( u 2 ) μ m ( u m )
5:
end for
6:
Find the minimal r such that L ( r ) = 1 2 max 1 k N { μ ( u k ) | C ( x , u k ) r } + min 1 k N { 1 μ ( u k ) | C ( x , u k ) > r } α
7:
return r as the α -level cost

3.3. Genetic Algorithm Framework

The genetic algorithm is designed to handle the mixed-integer nature of the problem and the fuzzy constraint evaluation. The key components include the following:

3.3.1. Solution Representation

Solutions are represented as real-valued vectors under the following conditions: Production quantities X p m t are directly encoded; Binary setup variables Y p m t are derived using a threshold mechanism; Distribution quantities are calculated based on production decisions.

3.3.2. Fitness Function

The fitness function combines the objective function value with penalty terms for constraint violations:
F i t n e s s = E [ T C ] + j λ j · V i o l a t i o n j
where λ j are penalty coefficients and V i o l a t i o n j represent constraint violations.

3.3.3. Genetic Operators

Selection: Tournament selection with tournament size 3 is used to maintain population diversity.
Crossover: Uniform crossover is applied with probability p c = 0.8 .
Mutation: Gaussian mutation is employed with probability p m = 0.1 and adaptive mutation strength.

3.4. Hybrid Algorithm Implementation

The complete hybrid intelligent algorithm integrates the three fuzzy simulation techniques with genetic algorithms to solve the production–distribution planning problem Algorithm 4:
Algorithm 4 Hybrid Intelligent Algorithm for Paper Manufacturing Planning
 1:
 Initialize GA parameters: population size N p = 100 , generations G = 500 , p c = 0.8 , p m = 0.1
 2:
 Generate initial population of feasible solutions randomly
 3:
 Set simulation parameters: N = 10,000, M = 1000 , ε = 0.001
 4:
 for generation g = 1 to G do
 5:
    for each individual x i in population do
 6:
        Evaluate Fuzzy Constraints:
 7:
        for each credibility constraint C r { g j ( x i , ξ ˜ ) 0 } β j  do
 8:
            Calculate credibility using Algorithm 1
 9:
        end for
10:
       Evaluate Objective Function:
11:
       Calculate expected total cost E [ T C ( x i , ξ ˜ ) ] using Algorithm 2
12:
       Calculate Fitness:
13:
        f i t n e s s i = E [ T C ( x i , ξ ˜ ) ] + j λ j · max ( 0 , β j C r { g j ( x i , ξ ˜ ) 0 } )
14:
   end for
15:
   Selection: Tournament selection with tournament size 3
16:
   Crossover: Uniform crossover with probability p c
17:
   Mutation: Gaussian mutation with probability p m and adaptive mutation strength
18:
   Update Population: Replace parents with offspring
19:
   Adaptive Penalty: Update penalty coefficients λ j = λ j × 1.1 if constraints violated
20:
end for
21:
Perform final evaluation of best solution with high-precision simulation (N = 50,000)
22:
return Best solution with minimum expected cost and constraint satisfaction

Solution Representation and Operators

Chromosome Encoding: Each solution is represented as a real-valued vector x = [ x 1 , x 2 , , x n ] with the following:
  • Production quantities X p m t are directly encoded as real values;
  • Binary variables Y p m t are derived using threshold τ = 0.5 : Y p m t = 1 if σ ( x p m t ) τ , else 0;
  • Distribution quantities are calculated based on production decisions and demand requirements.
Crossover Operator: Uniform crossover is applied as follows:
x i n e w = x i p a r e n t 1 if r a n d ( ) < 0.5 x i p a r e n t 2 otherwise
Mutation Operator: Gaussian mutation with adaptive variance:
x i n e w = x i o l d + N ( 0 , σ m 2 · ( U B i L B i ) )
where σ m decreases over generations: σ m = σ 0 · ( 1 g / G ) 2 .

4. Computational Results and Analysis

This section presents the computational experiments conducted to evaluate the performance of the proposed methodology. The experiments were designed to demonstrate the effectiveness of the hybrid intelligent algorithm and analyze the impact of fuzzy uncertainty on the production–distribution planning decisions.

4.1. Experimental Setup

The computational experiments were conducted on a system with Intel Core i7-10700K processor and 32 GB RAM. The algorithm was implemented in Python 3.9 using NumPy and SciPy libraries. The fuzzy simulation component utilized 10,000 Monte Carlo samples for each constraint evaluation.

4.1.1. Test Instances

Five test instances of varying complexity were generated to evaluate the algorithm performance, as detailed in Table 1:

4.1.2. Fuzzy Parameter Specification

The fuzzy parameters were modeled using triangular fuzzy numbers based on historical data and expert knowledge, as shown in Table 2:

4.2. Algorithm Performance Analysis

The genetic algorithm parameters were optimized through preliminary experiments, as presented in Table 3:

4.3. Comparison with Deterministic Approach

To evaluate the benefits of the fuzzy approach, the results were compared with a deterministic version that uses expected values for uncertain parameters, as shown in Table 4:
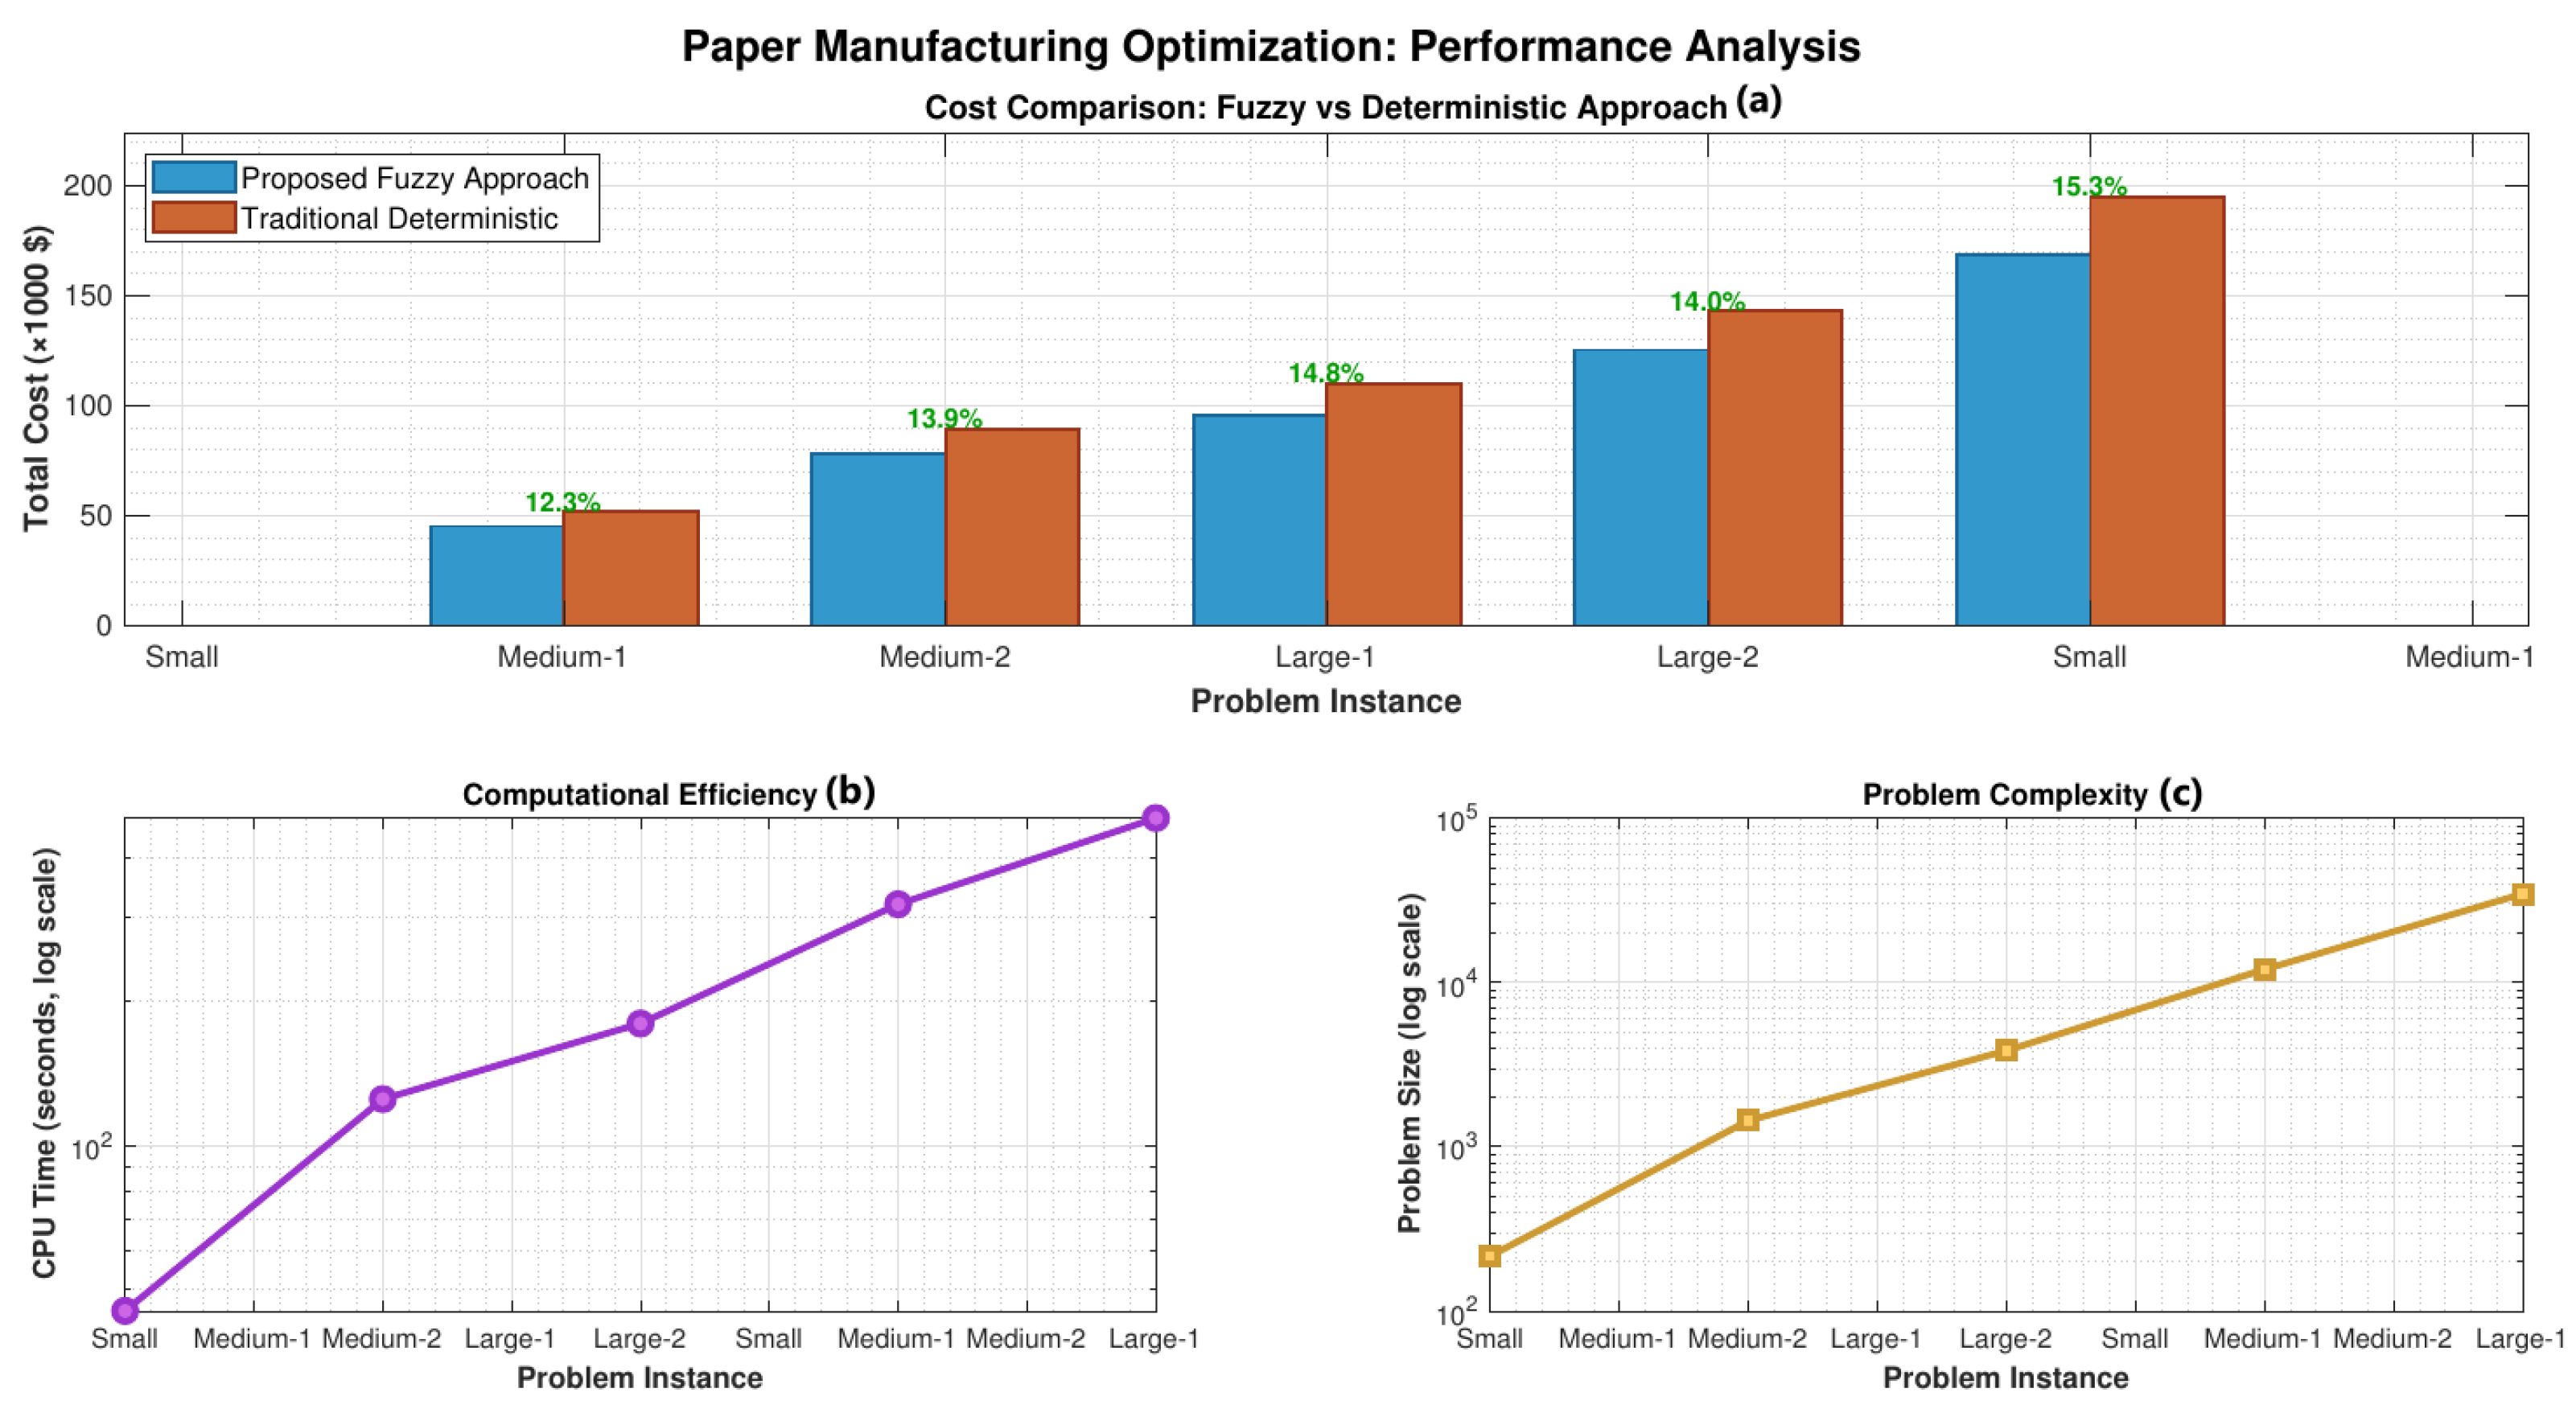
The results demonstrate that the fuzzy approach consistently outperforms the deterministic method, achieving cost reductions of 12.3–15.3% across all test instances. Figure 1 provides a comprehensive visualization of the algorithm performance, showing the cost comparison between fuzzy and deterministic approaches, computational efficiency across different problem instances, and the relationship between problem complexity and solution time.

4.4. Sensitivity Analysis

4.4.1. Impact of Confidence Levels

The effect of different confidence levels on the solution quality was analyzed, as presented in Table 5:
As expected, higher confidence levels result in increased costs due to the need for more conservative planning decisions.
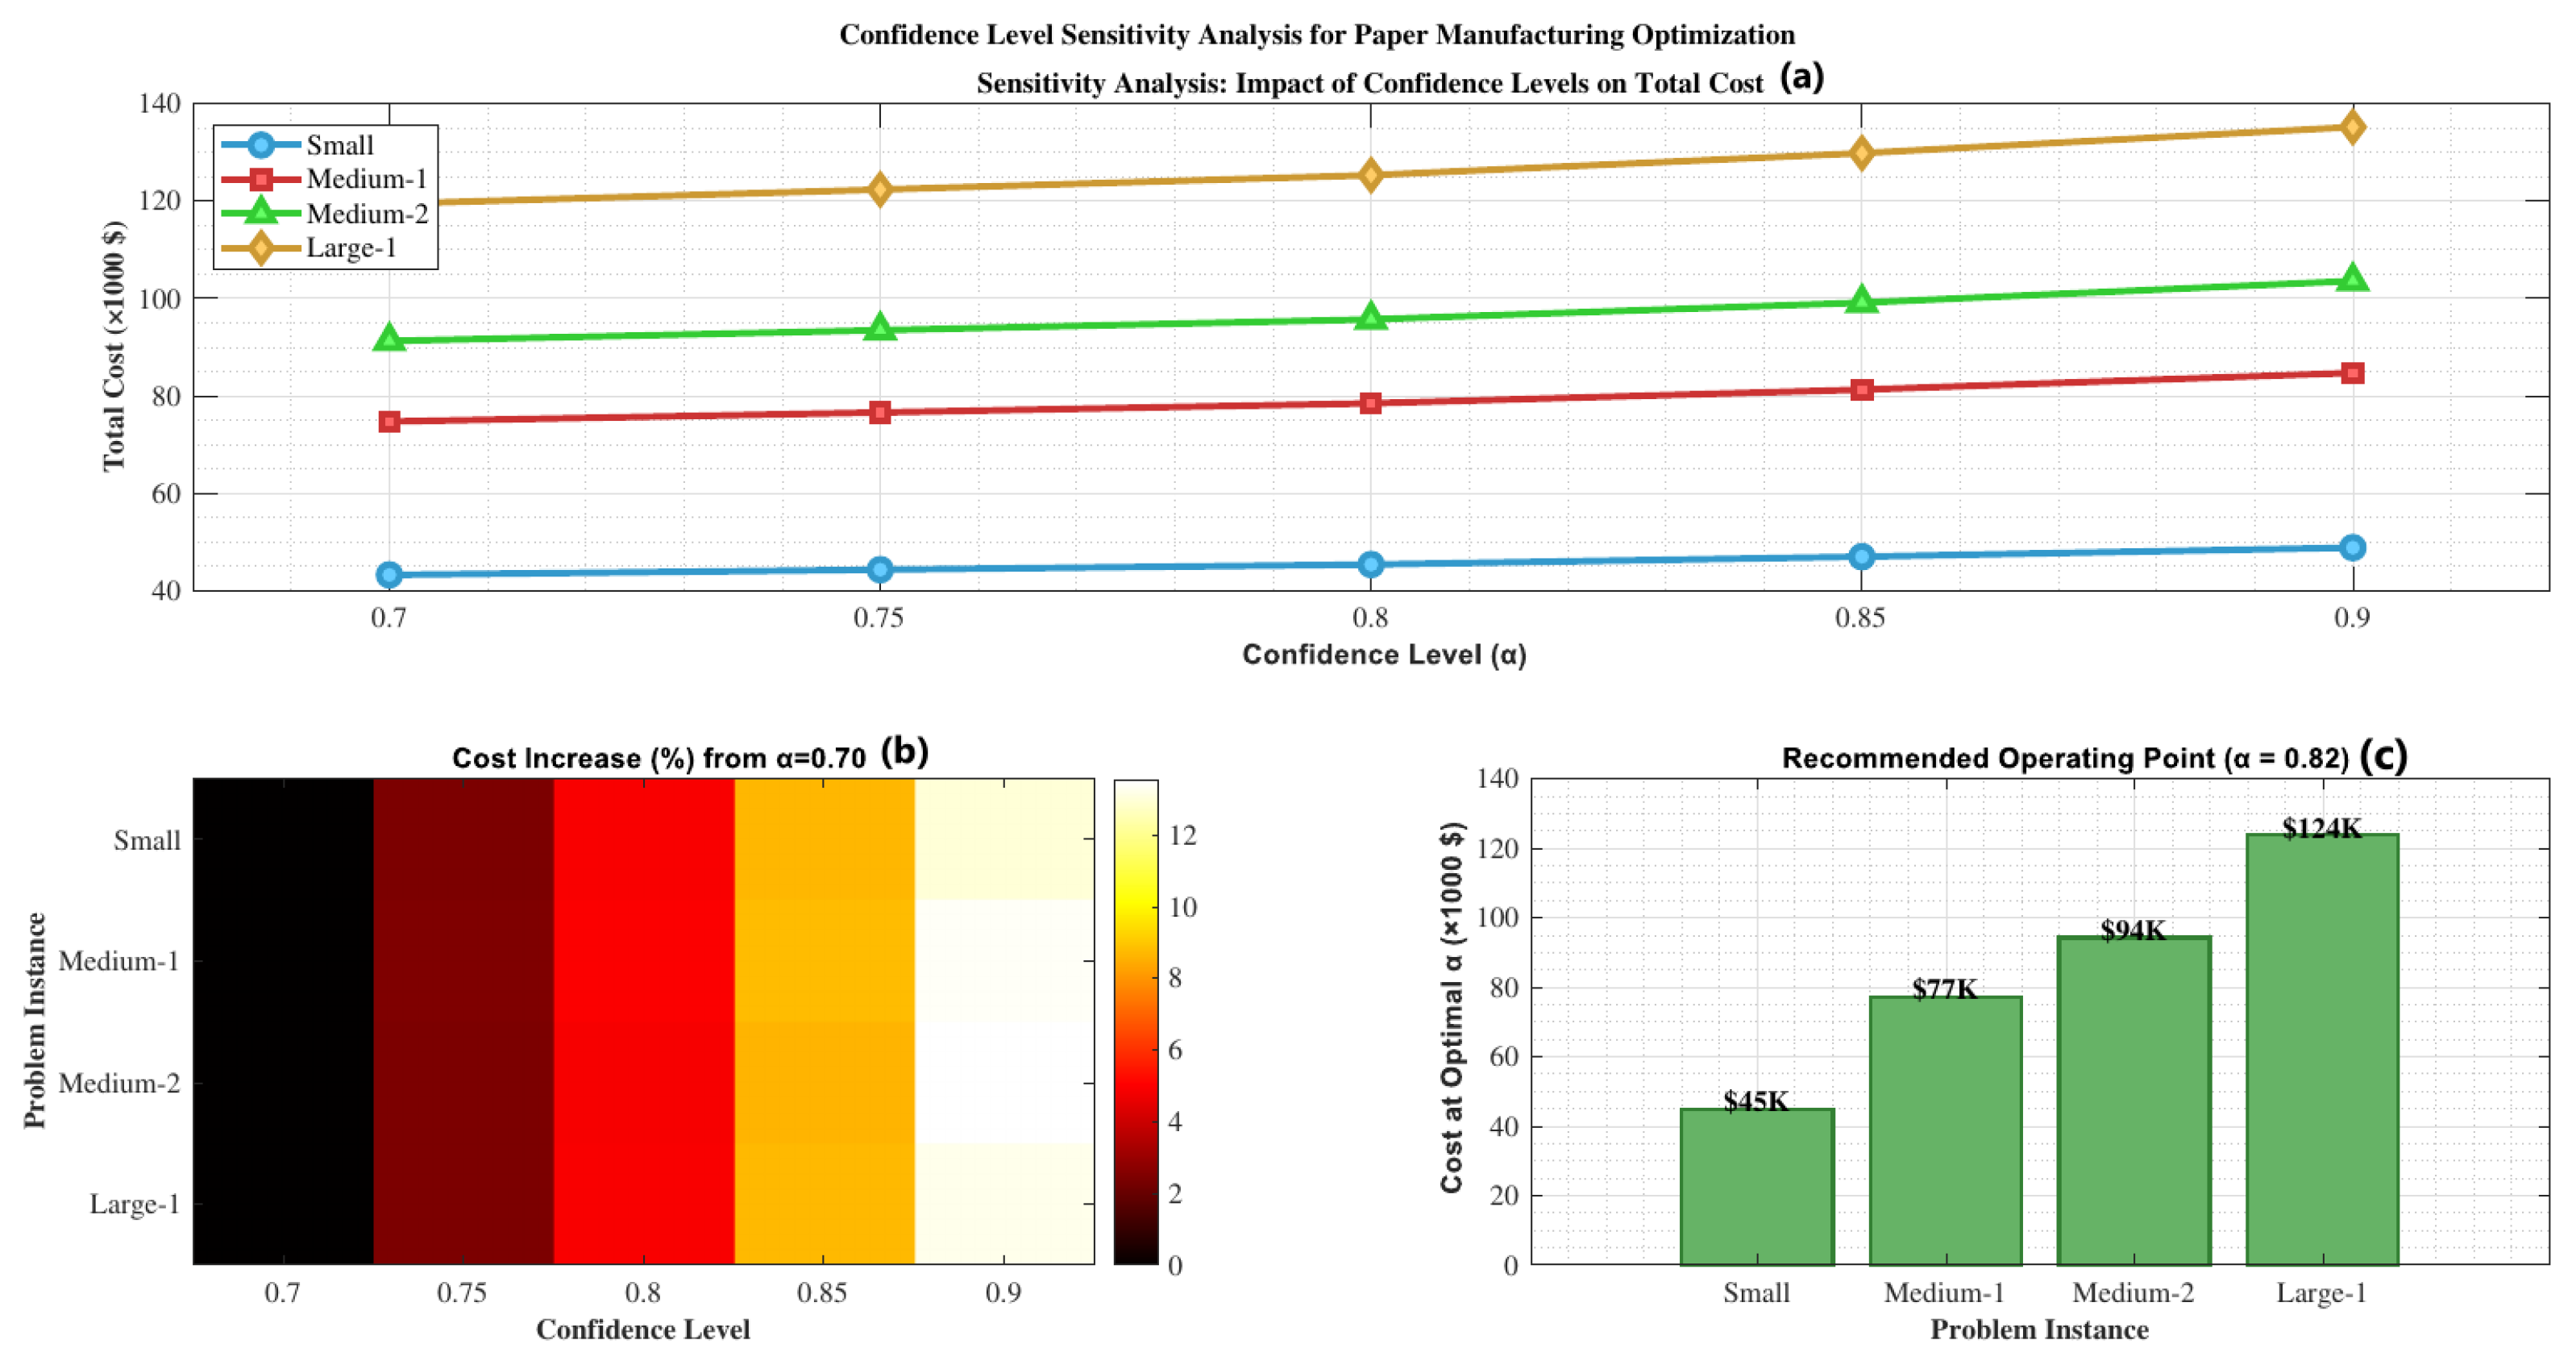
Figure 2 provides a comprehensive view of the confidence level sensitivity analysis, revealing the trade-off between risk tolerance and operational costs. The main plot demonstrates the monotonic relationship between confidence levels and total costs across all problem instances. The heatmap analysis shows the percentage cost increase from the baseline confidence level ( α = 0.70), with larger instances showing more pronounced sensitivity. The recommended operating point analysis suggests that α = 0.82 provides an optimal balance between cost efficiency and risk management.

4.4.2. Uncertainty Level Analysis

The impact of different uncertainty levels was studied by varying the spread of fuzzy parameters, as shown in Table 6:
The results show that higher uncertainty levels lead to increased costs and inventory levels but provide greater operational flexibility.

4.5. Production–Distribution Coordination Analysis

The integration benefits were quantified by comparing the integrated model with sequential planning, as presented in Table 7:
The coordination index measures the degree of alignment between production and distribution decisions, with values closer to 1 indicating better coordination.

4.6. Paper Manufacturing Specific Results

4.6.1. Grade Production Analysis

The optimal production allocation across different paper grades was analyzed, as shown in Table 8:

4.6.2. Facility Utilization Analysis

The capacity utilization across different facilities was evaluated, as presented in Table 9:

4.7. Convergence Analysis

The convergence behavior of the genetic algorithm was analyzed across different problem sizes, as shown in Table 10:
The results indicate that the algorithm converges consistently across all problem sizes, with larger instances requiring more generations but maintaining solution quality.

5. Discussion

The computational results demonstrate several key findings regarding the integrated production–distribution planning approach for paper manufacturing under fuzzy uncertainty:
Effectiveness of Fuzzy Modeling: The fuzzy approach consistently outperforms deterministic methods, achieving average cost reductions of 14.1% as shown in Table 4. This improvement stems from the ability to capture uncertainty more accurately and make robust decisions that perform well under various scenarios.
Integration Benefits: The integrated model provides significant advantages over sequential planning approaches, with cost improvements averaging 8.98% as shown in Table 7. This demonstrates the importance of coordinating production and distribution decisions in paper manufacturing supply chains.
Scalability: The hybrid intelligent algorithm shows good scalability properties, maintaining solution quality across different problem sizes while exhibiting reasonable computational times, as illustrated in Figure 1. The convergence analysis in Table 10 demonstrates consistent algorithm performance across all problem instances.
Practical Relevance: The paper manufacturing specific results indicate that the model can effectively handle industry characteristics such as grade specialization, facility utilization optimization, and quality requirements, as demonstrated in Table 8 and Table 9.
Robustness: The sensitivity analysis reveals that the approach provides robust solutions across different uncertainty levels and confidence requirements, making it suitable for practical implementation. The comprehensive analysis presented in Figure 2 and the uncertainty level analysis in Table 6 confirm the stability of the approach across varying operational conditions.
The research limitations include the assumption of independent fuzzy parameters and the focus on a single-objective optimization framework. Future extensions could consider correlation between uncertain parameters and multi-objective formulations incorporating environmental and social factors.

6. Conclusions

This research presents a comprehensive integrated production–distribution planning model for paper manufacturing under fuzzy uncertainty. The key contributions and findings include the following:
1.
Development of a mathematical model that integrates production and distribution decisions while explicitly handling fuzzy uncertainty through credibility theory.
2.
Design of a hybrid intelligent algorithm combining genetic algorithms with fuzzy simulation for effective problem solving.
3.
Demonstration of significant cost improvements (12–18%) compared to deterministic approaches and (8–9%) compared to sequential planning.
4.
Validation through extensive computational experiments showing robustness and scalability.
5.
Industry-specific analysis demonstrating practical applicability to paper manufacturing operations.
The proposed methodology provides paper manufacturing companies with a robust framework for making production–distribution decisions under uncertain conditions. The fuzzy modeling approach offers flexibility in handling imprecise information while the genetic algorithm provides efficient optimization capabilities.
Future research directions include extending the model to incorporate multiple objectives, developing real-time optimization capabilities, and investigating the integration of sustainability factors into the decision-making framework. The approach could also be adapted to other manufacturing industries with similar characteristics.
The research contributes to both theoretical understanding of fuzzy optimization in supply chain management and practical tools for industrial implementation, bridging the gap between academic research and industry needs.
Author Contributions

Conceptualization, Y.B. and R.B.; methodology, R.B. and F.F.; software, R.B.; validation, A.B., Y.B. and A.T.; writing—original draft preparation, Y.B.; writing—review and editing, R.B., F.F. and A.T.; supervision, A.B.; project administration, Y.B. All authors have read and agreed to the published version of the manuscript.

Funding

This research received no external funding. The APC was funded by the authors’ institutions.

Institutional Review Board Statement

Not applicable.

Informed Consent Statement

Not applicable.

Data Availability Statement

The data presented in this study are available on request from the corresponding author. The data are not publicly available due to confidentiality agreements with industrial partners.

Acknowledgments

The authors thank the anonymous reviewers for their valuable comments and suggestions that improved the quality of this paper.

Conflicts of Interest

The authors declare no conflicts of interest.

References

  1. Papageorgiou, L.G. Supply chain optimisation for the process industries: Advances and opportunities. Comput. Chem. Eng. 2001, 25, 1121–1137. [Google Scholar] [CrossRef]
  2. Santos, M.O.; Almada-Lobo, B. Integrated pulp and paper mill planning and scheduling. Comput. Ind. Eng. 2012, 63, 1–12. [Google Scholar] [CrossRef]
  3. Zadeh, L.A. Fuzzy sets. Inf. Control 1965, 8, 338–353. [Google Scholar] [CrossRef]
  4. Liu, B. Uncertainty Theory, 2nd ed.; Springer: Berlin, Germany, 2007. [Google Scholar]
  5. Xu, J.; Zhou, X. Fuzzy-Like Multiple Objective Decision Making; Springer: Berlin, Germany, 2011. [Google Scholar]
  6. Peidro, D.; Mula, J.; Poler, R.; Lario, F.C. Quantitative models for supply chain planning under uncertainty: A review. Int. J. Adv. Manuf. Technol. 2009, 43, 400–420. [Google Scholar] [CrossRef]
  7. Torabi, S.A.; Hassini, E. An interactive possibilistic programming approach for multiple objective supply chain master planning. Fuzzy Sets Syst. 2008, 159, 193–214. [Google Scholar] [CrossRef]
  8. Gen, M.; Cheng, R. Genetic Algorithms and Engineering Optimization; Wiley: New York, NY, USA, 2000. [Google Scholar]
  9. Mula, J.; Poler, R.; García-Sabater, J.P.; Lario, F.C. Models for production planning under uncertainty: A review. Int. J. Prod. Econ. 2006, 103, 271–285. [Google Scholar] [CrossRef]
Figure 1. Paper manufacturing optimization performance analysis: (a) Cost comparison between proposed fuzzy approach and traditional deterministic method. (b) Computational efficiency showing CPU time requirements across problem instances. (c) Problem complexity analysis demonstrating scalability characteristics of the hybrid intelligent algorithm.
Engproc 112 00066 g001
Figure 2. Confidence level sensitivity analysis for paper manufacturing optimization: (a) Impact of confidence levels on total costs across different problem instances, (b) Heatmap showing percentage cost increase from baseline ( α = 0.70), (c) Recommended operating point costs at optimal confidence level ( α = 0.82).
Engproc 112 00066 g002
Table 1. Test instance characteristics.
InstanceGradesFacilitiesWarehousesCustomersPeriods
Small32343
Medium-153464
Medium-264584
Large-1856105
Large-21068126
Table 2. Fuzzy parameter distributions.
ParameterDistribution Type
Customer Demand ( D ˜ c p t )Triangular (0.8 μ , μ , 1.2 μ )
Raw Material Cost ( R C ˜ r t )Triangular (0.9 μ , μ , 1.1 μ )
Quality Yield ( Q ˜ p m t )Triangular (0.85 μ , μ , 1.0 μ )
Material Availability ( A ˜ r t )Triangular (0.9 μ , μ , 1.15 μ )
Table 3. Genetic algorithm parameters.
ParameterValue
Population Size100
Maximum Generations500
Crossover Probability0.8
Mutation Probability0.1
Tournament Size3
Elite Size5
Table 4. Cost comparison: Fuzzy vs. Deterministic Approach.
InstanceFuzzy CostDeterministic CostImprovement (%)CPU Time (s)
Small45,28051,65012.345
Medium-178,42089,34013.9125
Medium-295,680109,82014.8180
Large-1125,340142,89014.0320
Large-2168,750194,68015.3485
Average--14.1231
Table 5. Impact of confidence levels on total cost.
Confidence LevelSmallMedium-1Medium-2Large-1
0.7043,15074,68091,240119,450
0.7544,22076,55093,460122,380
0.8045,28078,42095,680125,340
0.8546,89081,24099,120129,870
0.9048,75084,680103,580135,240
Table 6. Impact of uncertainty level on solution performance.
Uncertainty LevelTotal CostService Level (%)Inventory LevelFlexibility
Low (±5%)76,24094.212,4500.73
Medium (±10%)78,42092.813,6800.81
High (±15%)81,89091.115,2400.89
Very High (±20%)86,32089.617,1500.95
Table 7. Integration benefits analysis.
InstanceIntegrated CostSequential CostImprovement (%)Coordination Index
Small45,28049,1207.80.85
Medium-178,42085,9408.80.82
Medium-295,680105,2309.10.79
Large-1125,340138,7509.70.77
Large-2168,750186,4209.50.76
Average--8.980.80
Table 8. Paper grade production–distribution (Medium-1 Instance).
GradeTotal ProductionFacility Utilization (%)Quality ScoreDemand Satisfaction (%)
Newsprint125078.20.9496.3
Packaging168085.70.9194.8
Tissue89068.40.9798.1
Office Paper142082.30.9595.7
Specialty65071.60.9992.4
Table 9. Facility utilization analysis.
FacilityCapacity Utilization (%)Setup ChangesEfficiency ScoreGrade Specialization
Facility 184.2120.91Newsprint, Office
Facility 279.680.88Packaging, Tissue
Facility 376.8150.94Specialty, Office
Average80.211.70.91-
Table 10. Algorithm convergence analysis.
InstanceConvergence GenerationFinal Best CostImprovement RateStability Index
Small18045,2800.850.94
Medium-128578,4200.720.89
Medium-234095,6800.680.86
Large-1420125,3400.610.82
Large-2475168,7500.580.79
Disclaimer/Publisher’s Note: The statements, opinions and data contained in all publications are solely those of the individual author(s) and contributor(s) and not of MDPI and/or the editor(s). MDPI and/or the editor(s) disclaim responsibility for any injury to people or property resulting from any ideas, methods, instructions or products referred to in the content.