Proceeding Paper

Research on Fault Diagnosis of Gear Transmission Systems Based on Dynamic Transmission Error †

School of Mechanical and Electrical Engineering, Wenzhou University, Wenzhou 325035, China
*
Author to whom correspondence should be addressed.
Presented at the 5th International Conference on Advances in Mechanical Engineering (ICAME-25), Islamabad, Pakistan, 26 August 2025.
Eng. Proc. 2025, 111(1), 3; https://doi.org/10.3390/engproc2025111003
Published: 14 October 2025

Abstract

In complex working environments where early fault diagnosis of mechanical equipment is required, interference signals such as ambient vibrations and motor noise can significantly affect the acquisition and analysis of vibration signals and meshing force signals, making it difficult to capture early fault features. This paper provides a method for fault diagnosis and identification of typical gear tooth faults by analyzing the influence of meshing stiffness on dynamic transmission error in the gear transmission process. Three-dimensional models of both normal and faulty gear pairs were built using SolidWorks 2021 software and imported into Adams for dynamic simulation to obtain the system’s dynamic transmission error and meshing force data. By training and identifying these two different types of data, the experimental results demonstrate that the identification accuracy using dynamic transmission error is higher than that based on meshing force.

1. Introduction

Gear mechanisms constitute one of the most prevalent and important components in mechanical transmission devices. However, gears are prone to failure (such as cracks, wear, pitting, etc.) during long-term operation due to complex loads, wear and fatigue. Especially for mechanical transmission devices with complex working environments and strong environmental interference, as well as systems with high diagnostic accuracy requirements such as manned aircraft and precision instruments, which need to diagnose early faults, interference signals such as environmental vibration and motor noise will significantly affect the collection and analysis of vibration signals and meshing force signals, making it difficult to capture early fault characteristics.
At present, most fault diagnosis studies use signal data such as vibration signals and meshing force. Ji et al. [1] performed a comprehensive investigation of various fault conditions of laboratory gearboxes based on vibration signals; Tang et al. [2] pioneered an innovative framework using EEMD sample entropy-ELM combination to extract and identify fault features of vertical meshing force signals of high-speed gears. However, the acquisition frequency of vibration signals is high, the data volume is large, and it is easily disturbed by environmental noise; the meshing force is difficult to measure in the actual environment and the cost is high. Extensive research has been conducted by researchers in the domains of signal processing and diagnostic algorithm development, and it is relatively concentrated on post-processing, such as how to improve the failure identification rate across multiple working conditions or the fault diagnosis rate under different noise interference conditions. Research in this field has become relatively mature. Therefore, this article turns its perspective to the signal source that has a greater impact on the efficiency of fault diagnosis and is easier to observe and change. It proposes dynamic transmission error as signal data, which has higher sensitivity to gear faults and higher adaptability to different working conditions. For the purpose of verifying the feasibility of dynamic transmission error in gear fault diagnosis, the normal, cracked, and pitting fault gear models were modeled by Solid works, and the faulty transmission gear data was obtained by Adams simulation. A lightweight one-dimensional convolutional neural network model was built to perform fault diagnosis and identification on typical gear tooth faults, and the fault diagnosis accuracy of the obtained dynamic transmission error data was compared with that of the meshing force data.

2. Problem Description

At present, the input data used for gear fault diagnosis mostly adopts vibration signals and gear meshing forces. However, the acquisition frequency of vibration signals is high, the data volume is large, and they are easily disturbed by environmental noise; the meshing force is difficult to measure in actual environments and the cost is high. Therefore, this paper proposes to use dynamic transmission error as signal data, which has higher sensitivity to gear failure and higher adaptability to different working conditions. Gear meshing stiffness refers to the ability of gears to resist deformation during meshing. When a gear tooth fails, the meshing stiffness changes, which in turn affects its transmission performance. Therefore, this paper proposes to use the influence of meshing stiffness on dynamic transmission error in gear transmission, and to use dynamic transmission error as input data to perform fault diagnosis and identification of typical gear tooth faults. The overall flow chart is shown in Figure 1.

3. Fault Diagnosis of Gear Transmission Systems Based on Dynamic Transmission Error

3.1. Build Gear Model

3.1.1. Normal Gear

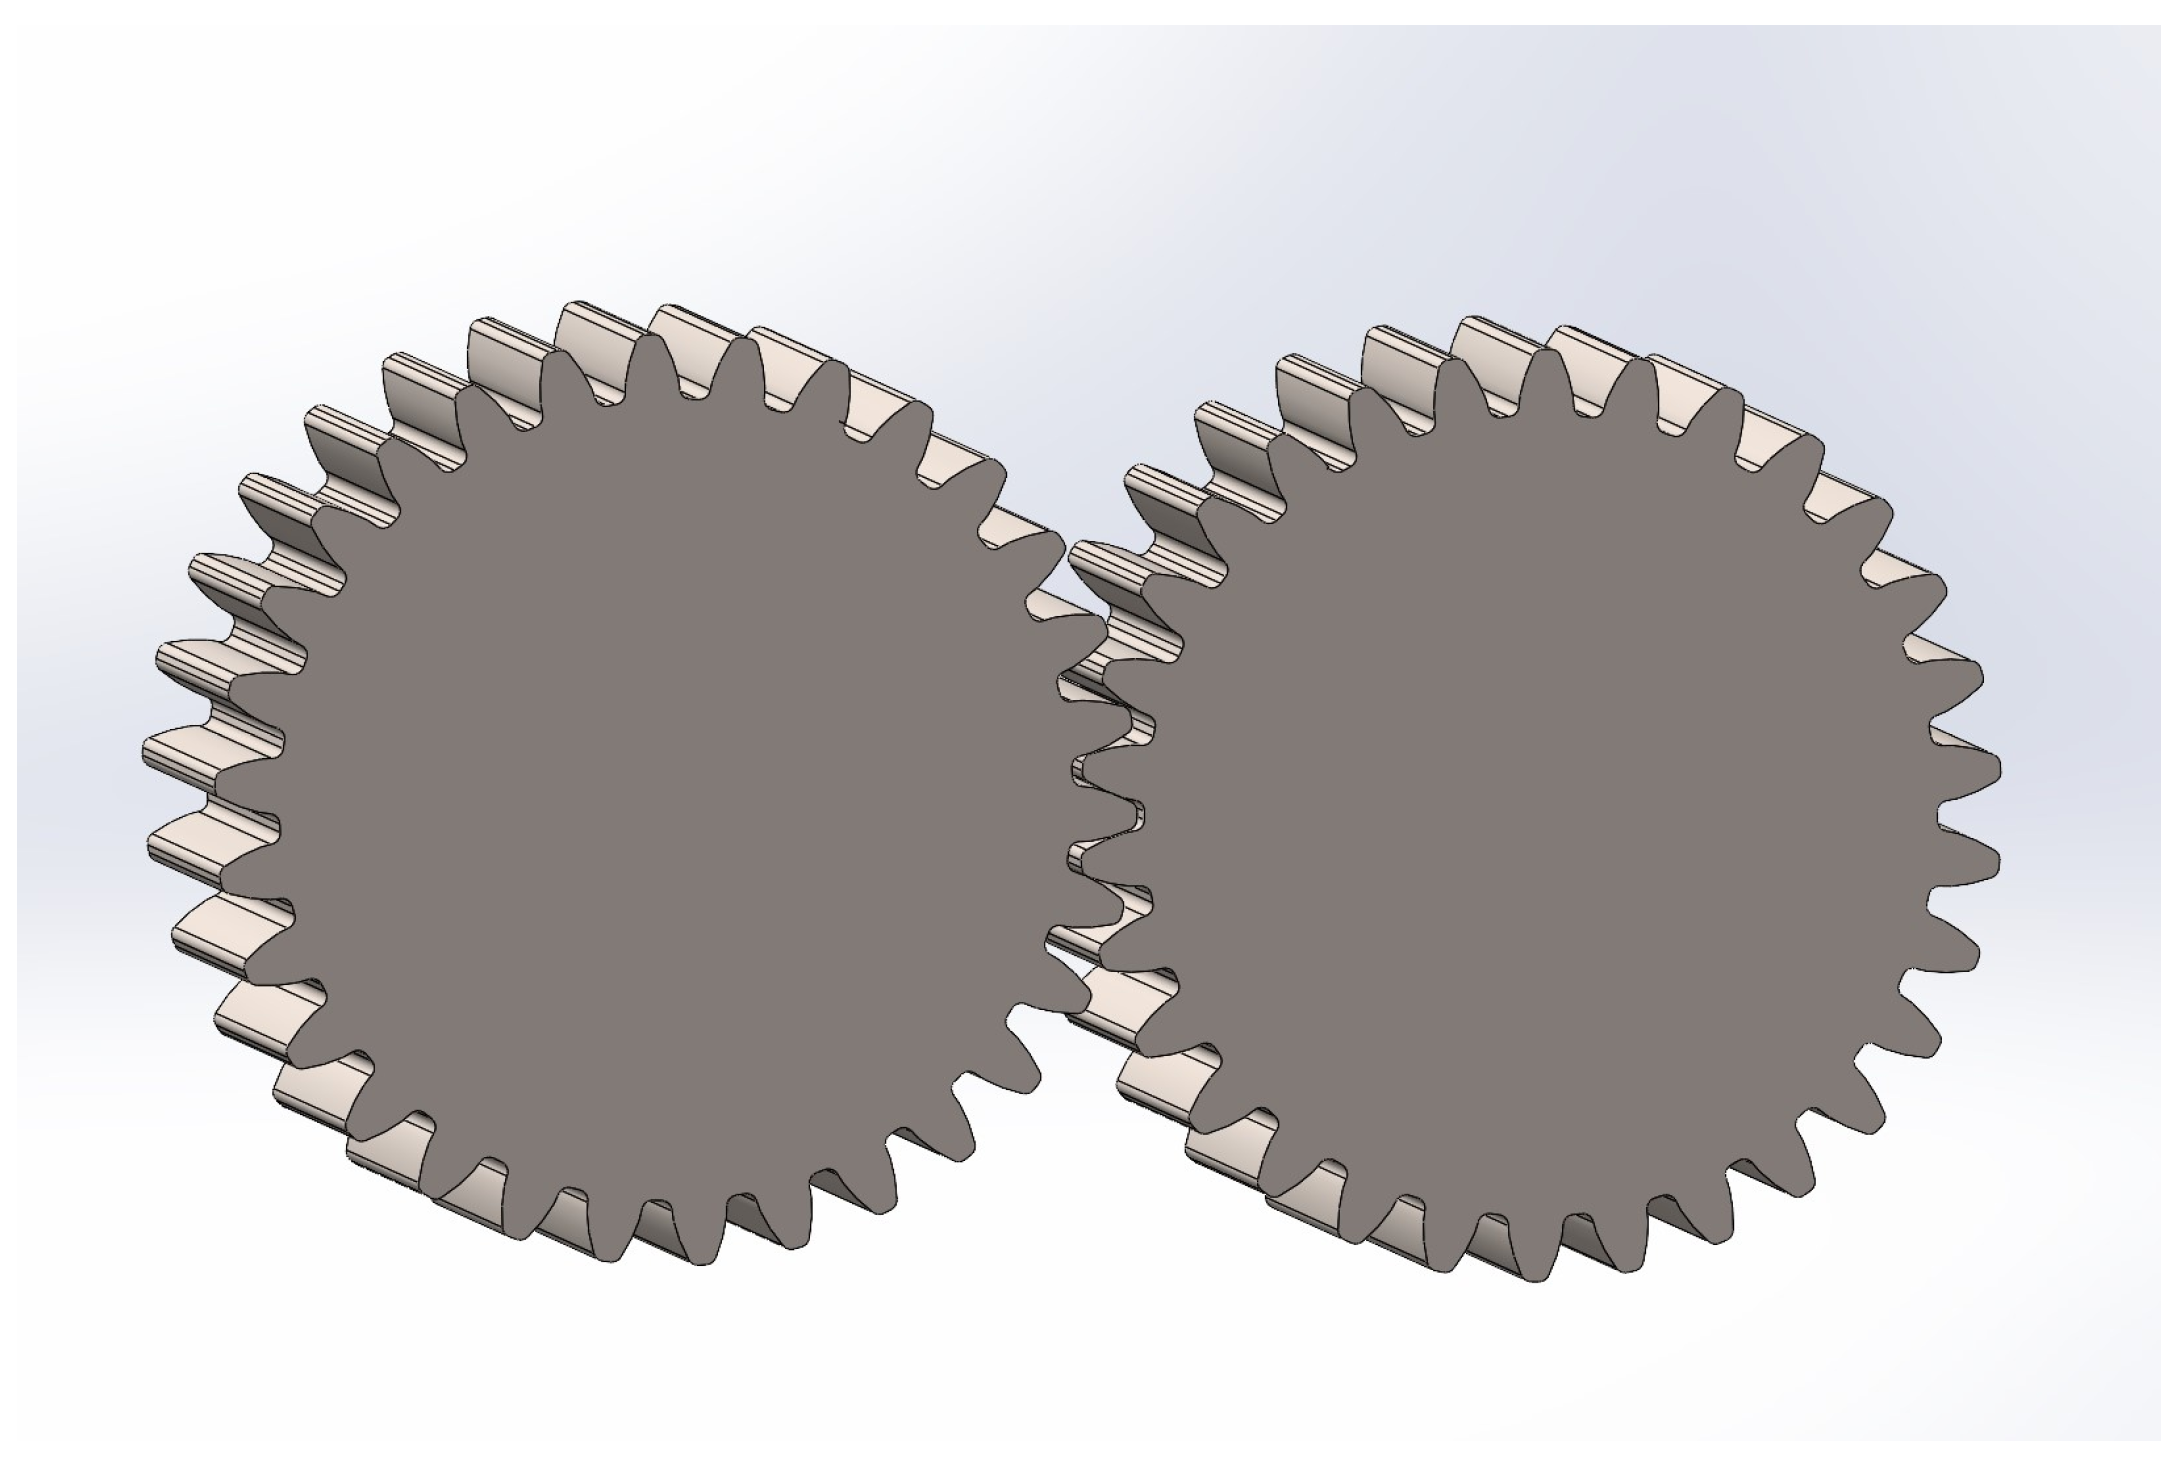
This study focuses on the transmission gear, which consists of a driving wheel and a driven wheel. This is considering that an overly complex model has a great impact on computer memory and running speed, so as to reduce the calculation cost, and the various structures of the transmission gear are appropriately simplified, as shown in Figure 2. The main parameters of the meshing gear pair are shown in Table 1.

3.1.2. Crack Gear

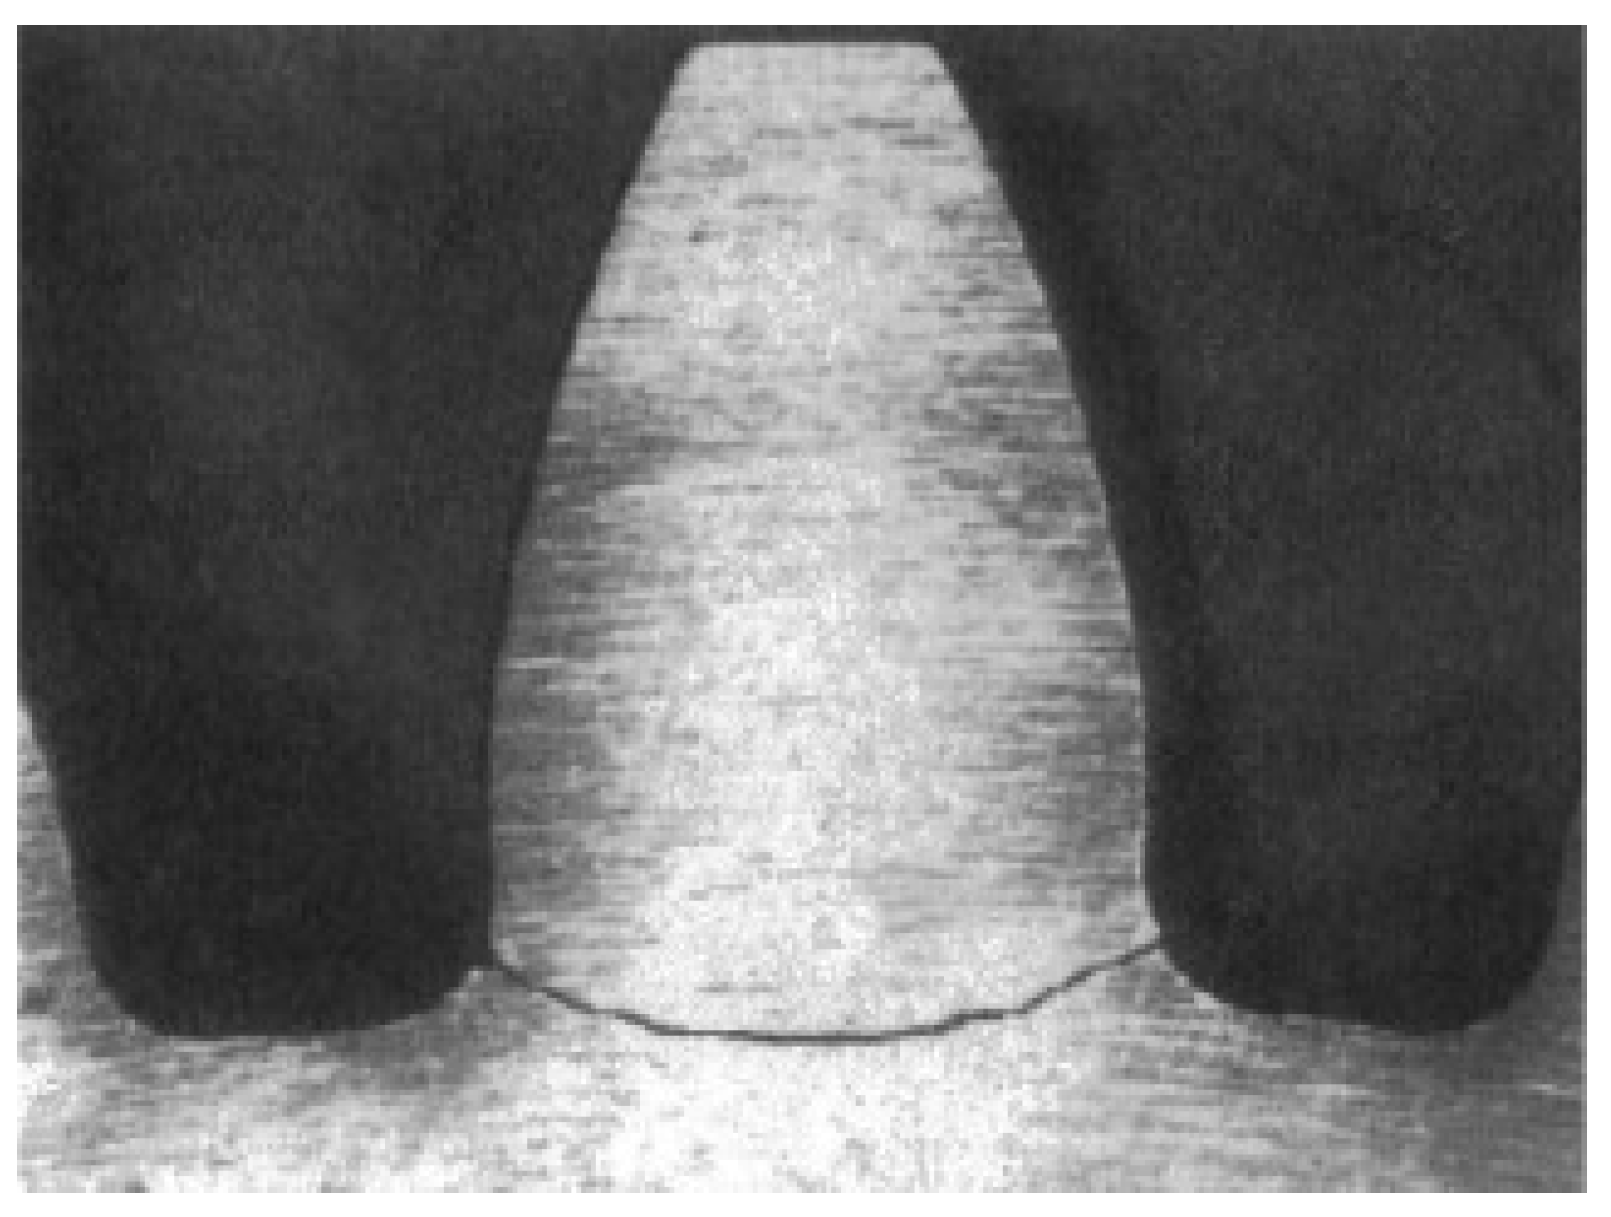
Multiple factors including stress concentration magnitude, material tensile strength, and the load conditions collectively dictate gear crack propagation directions. In the cracked gear model, a straight crack is used instead of a curved crack. In order to compare the difference in calculation results between a straight crack and a curved crack model which is closer to reality, Ma et al. [3] established a straight crack path and a curved crack path crack model and compared the results, and a systematic FEA verification process established the high degree of concordance in stiffness calculations. Therefore, the crack model can be simplified by assuming that the crack path is a straight line. The crack propagation path is shown in Figure 3 [4].
Three different depths of cracks were selected: 10% (0.40 mm), 30% (1.33 mm), and 50% (2.0 mm). Figure 4 is a partial enlarged view of the crack, corresponding to the above three degrees of cracks.

3.1.3. Pitting Gear

Gear pitting is a common form of fatigue damage on the gear surface, usually caused by repeated high contact stress between gear tooth surfaces. The authors of [5] obtained the pitting corrosion expansion under different loads through experiments.
Considering that this paper only needs to simulate the expansion of pitting in the early or middle stages, the amount of calculation and computer performance was decided. This paper uses circular pitting to simulate the pitting condition of gears. The pitting is set at the pitch line position, expands along the tooth top direction and simulates different degrees of pitting failure by increasing the number of pitting. Three different degrees of pitting models are selected respectively. A partial enlarged view of the pitting gear model, as shown in Figure 5:
1. Mild pitting: about 30% coverage area, according to the tooth width parameters and the practice in the literature [6], the tooth surface pitting shape is determined to be a cylinder with a diameter of 1 mm and a depth of 1 mm, the number of pits is 5, and it is evenly distributed on the pitch line.
2. Medium pitting: about 50% coverage area, the tooth surface contains five standardized pit defects: ϕ2.0 ± 0.1 mm (diameter) × 1.0 ± 0.05 mm (depth), and it is also evenly distributed on the pitch line.
3. Severe pitting: about 70% coverage area, the tooth surface pitting shape is determined to be cylindrical with a diameter of 1 mm and a depth of 1 mm. The number of pits is 30, evenly distributed on the pitch line and increasing towards the tooth top.
Figure 5. Local enlarged view of the pitted gear model: (a) Slight pitting, (b) moderate pitting, (c) severe pitting.
Engproc 111 00003 g005

3.2. Adams Simulation to Obtain Data

3.2.1. Transmission Gear Model Establishment
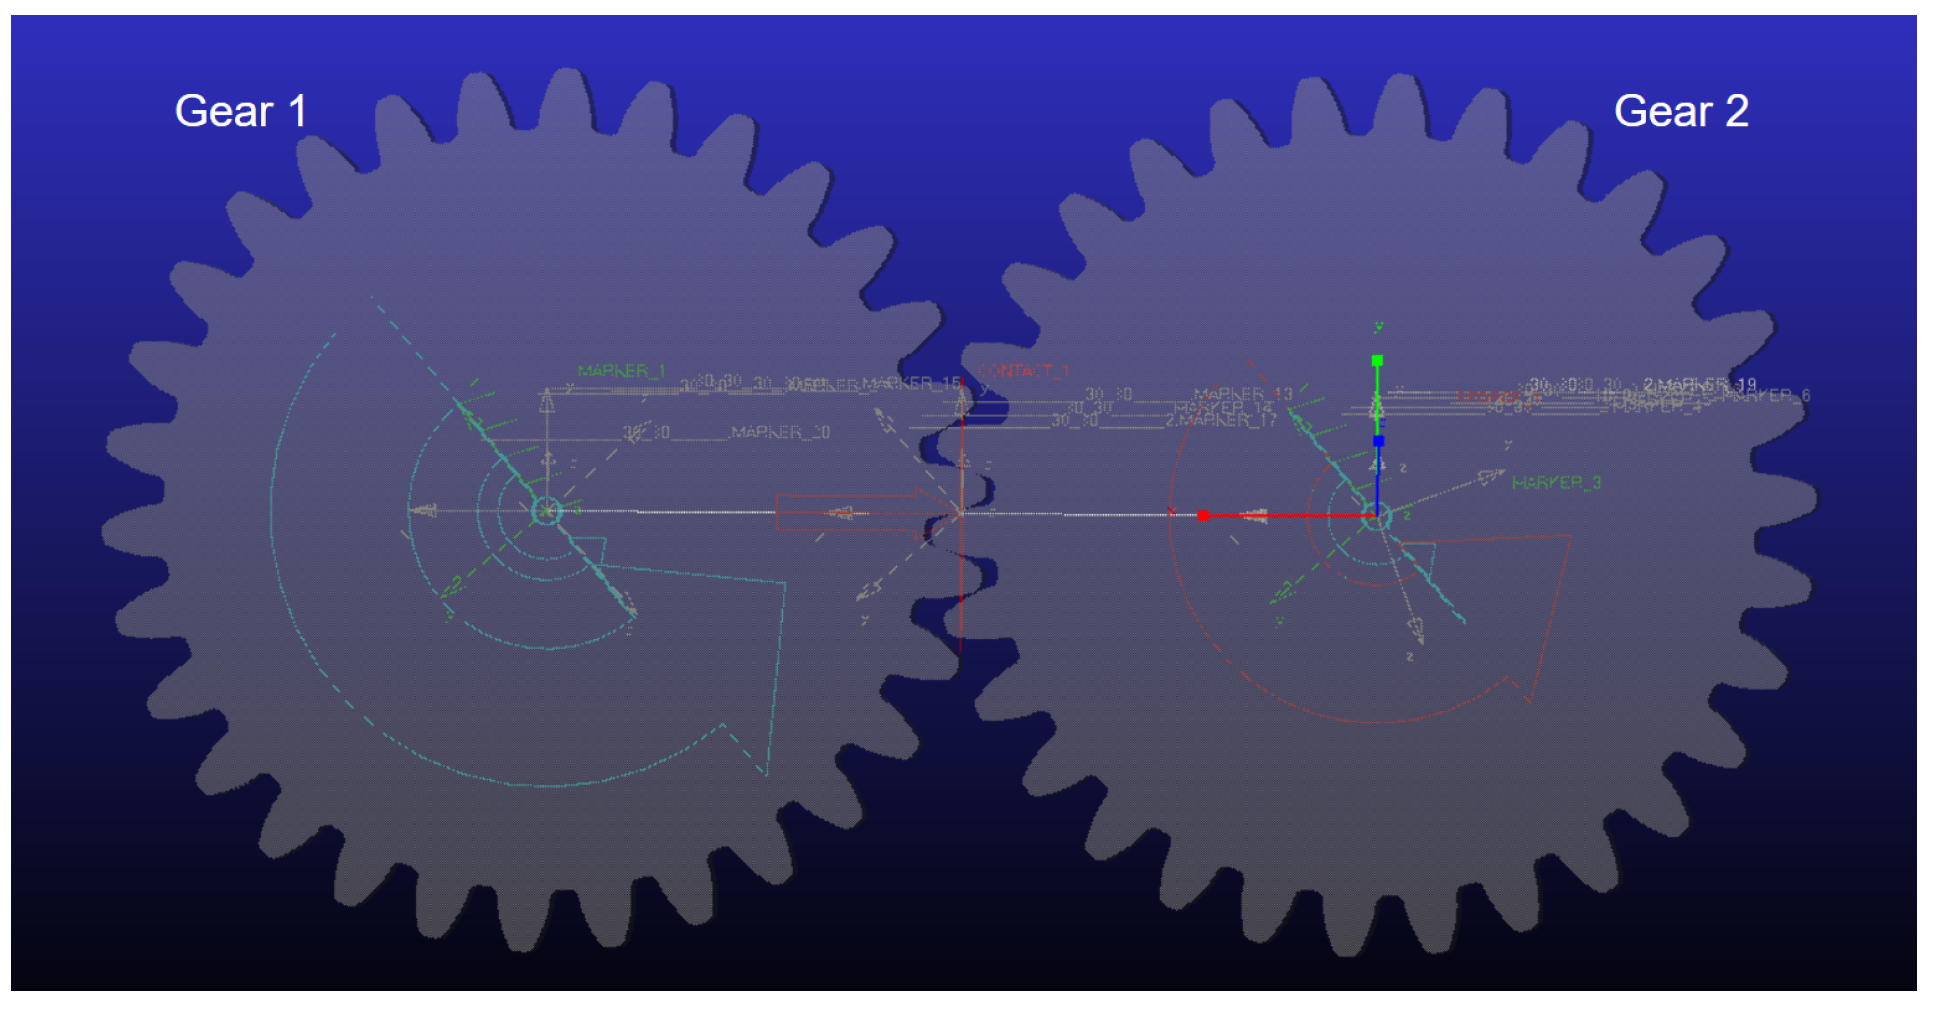
The model data from SolidWorks was imported into Adams for dynamic simulation. To ensure the proper operation of the transmission gears and make the simulation more realistic, constraint relationships were defined for the gear models within the Adams environment. Additionally, contact parameters for collisions, initial simulation settings, and material properties were appropriately selected. The transmission gear assembly diagram is shown in Figure 6.
Figure 6. Assembly diagram of the transmission gear.
Engproc 111 00003 g006
(1) Initial settings were no gravity, single MMKS-mm, kg, s, and deg. Constraint settings are shown in Table 2.
(2) Gear 1 is the driving wheel, the driving direction is set to rotation, and the time function is 1.08 × 10⁴ d * time. Gear 2 is the driven wheel and the torque is set to 3000 as the load.
(3) In gear transmission, collision contact occurs between tooth surfaces, generating contact force at the contact point. In the Adams gear meshing simulation, this can be replaced by setting the contact force between gears. The collision contact-related parameters refer to reference [2] and are mainly determined by the following formula:
K = 4 3 π h 1 h 2 R 1 R 2 R 1 + R 2 1 2
h 1 , h 2 are material coefficients, and represent the radius of curvature of a pair of meshing gears, which can be calculated by Formula (2).
h i = 1 u i 2 π E i , R i = m n Z i 2 sin α , i = 1 , 2
u i , E i are the Poisson’s ratio and elastic modulus of the gear material; m n , Z i , α are the gear module, number of teeth and pressure angle.
h i = 1 u i 2 π E i , R i = m n Z i 2 sin α , i = 1 , 2
where d m a x is the embedment depth at maximum damping. V represents the gear meshing collision velocity, which can be approximately calculated using the node linear velocity, V = ω 1 r 1 + ω 2 r 2 cos α . m represents the total mass of the cylinder corresponding to the curvature radius of the two gears.
C max = 3 K 1 e 2 4 V d max       α
where C max represents the maximum contact damping at maximum depth, e represents the collision recovery coefficient, e = 2.08 ( V / V y ) 1 4 . V y = 5.052 ( Y ρ E 4 ) 1 2 , Y represents the yield strength of the material, and ρ represents the density of the material.
(4) The parameters related to friction force are set by selecting from the table in reference [7].
(5) The simulation time determines the time span of the analysis, while the step size affects the simulation accuracy and calculation speed. In order to obtain sufficient and accurate data from the simulation, the simulation time is set to 10 s and the step size is set to 10−4.
Table 2. Constraints between components.
Type of JointFirst ComponentSecond Component
Rotational jointGear 1, Gear 2Ground
contactGear 1Gear 2

3.2.2. Simulation Calculation

According to the gear dynamic transmission error formula (DTE) Formula (5), measurements are established on Adams for the driving and driven wheels respectively, and the rotation angles of each gear is measured. The DTE is calculated from the base circle radius and rotation angles. Normal gears and the transmission gears with different crack depths and different pitting degrees are all operated under the same conditions. Under the conditions of n = 1800 r/min and T = 3000 N·m, the simulation time is set to 10 s and the step size is 0.0001 s.
D T E = y p + R p θ p + R g θ g y g
Let y p and y g denote the vertical vibration displacements of the driving and driven wheels respectively, with R p and R g representing their base circle radii. The corresponding rotational angles are designated as θ p and θ g . The dynamic transmission error characteristics for a 30% cracked gear are presented in Figure 7, while Figure 8 illustrates the corresponding meshing force behavior.

3.3. Fault Diagnosis Using 1DCNN Model

This paper selects one-dimensional convolutional neural network (1DCNN) as the main model. 1DCNN extracts time domain features through local sliding of the convolution kernel. It has strong local feature extraction capability, is suitable for capturing short-time impact signals (pitting, cracks, broken teeth), and has a relatively fast calculation speed. Based on lightweight considerations and after a large amount of experimental comparative analyses, the model parameters are finally determined as shown in Table 3.
The activation function and optimizer are Rectified Linear Units (ReLU) and Adaptive Moment Estimation (Adam), respectively. The model configuration adopts the following hyperparameters: Learning rate: 1 × 10⁻⁴, Mini-batch size: 64, Training epochs: 50; Regularization strategies include: Dropout (p = 0.1), L2 penalty (λ = 0.001).
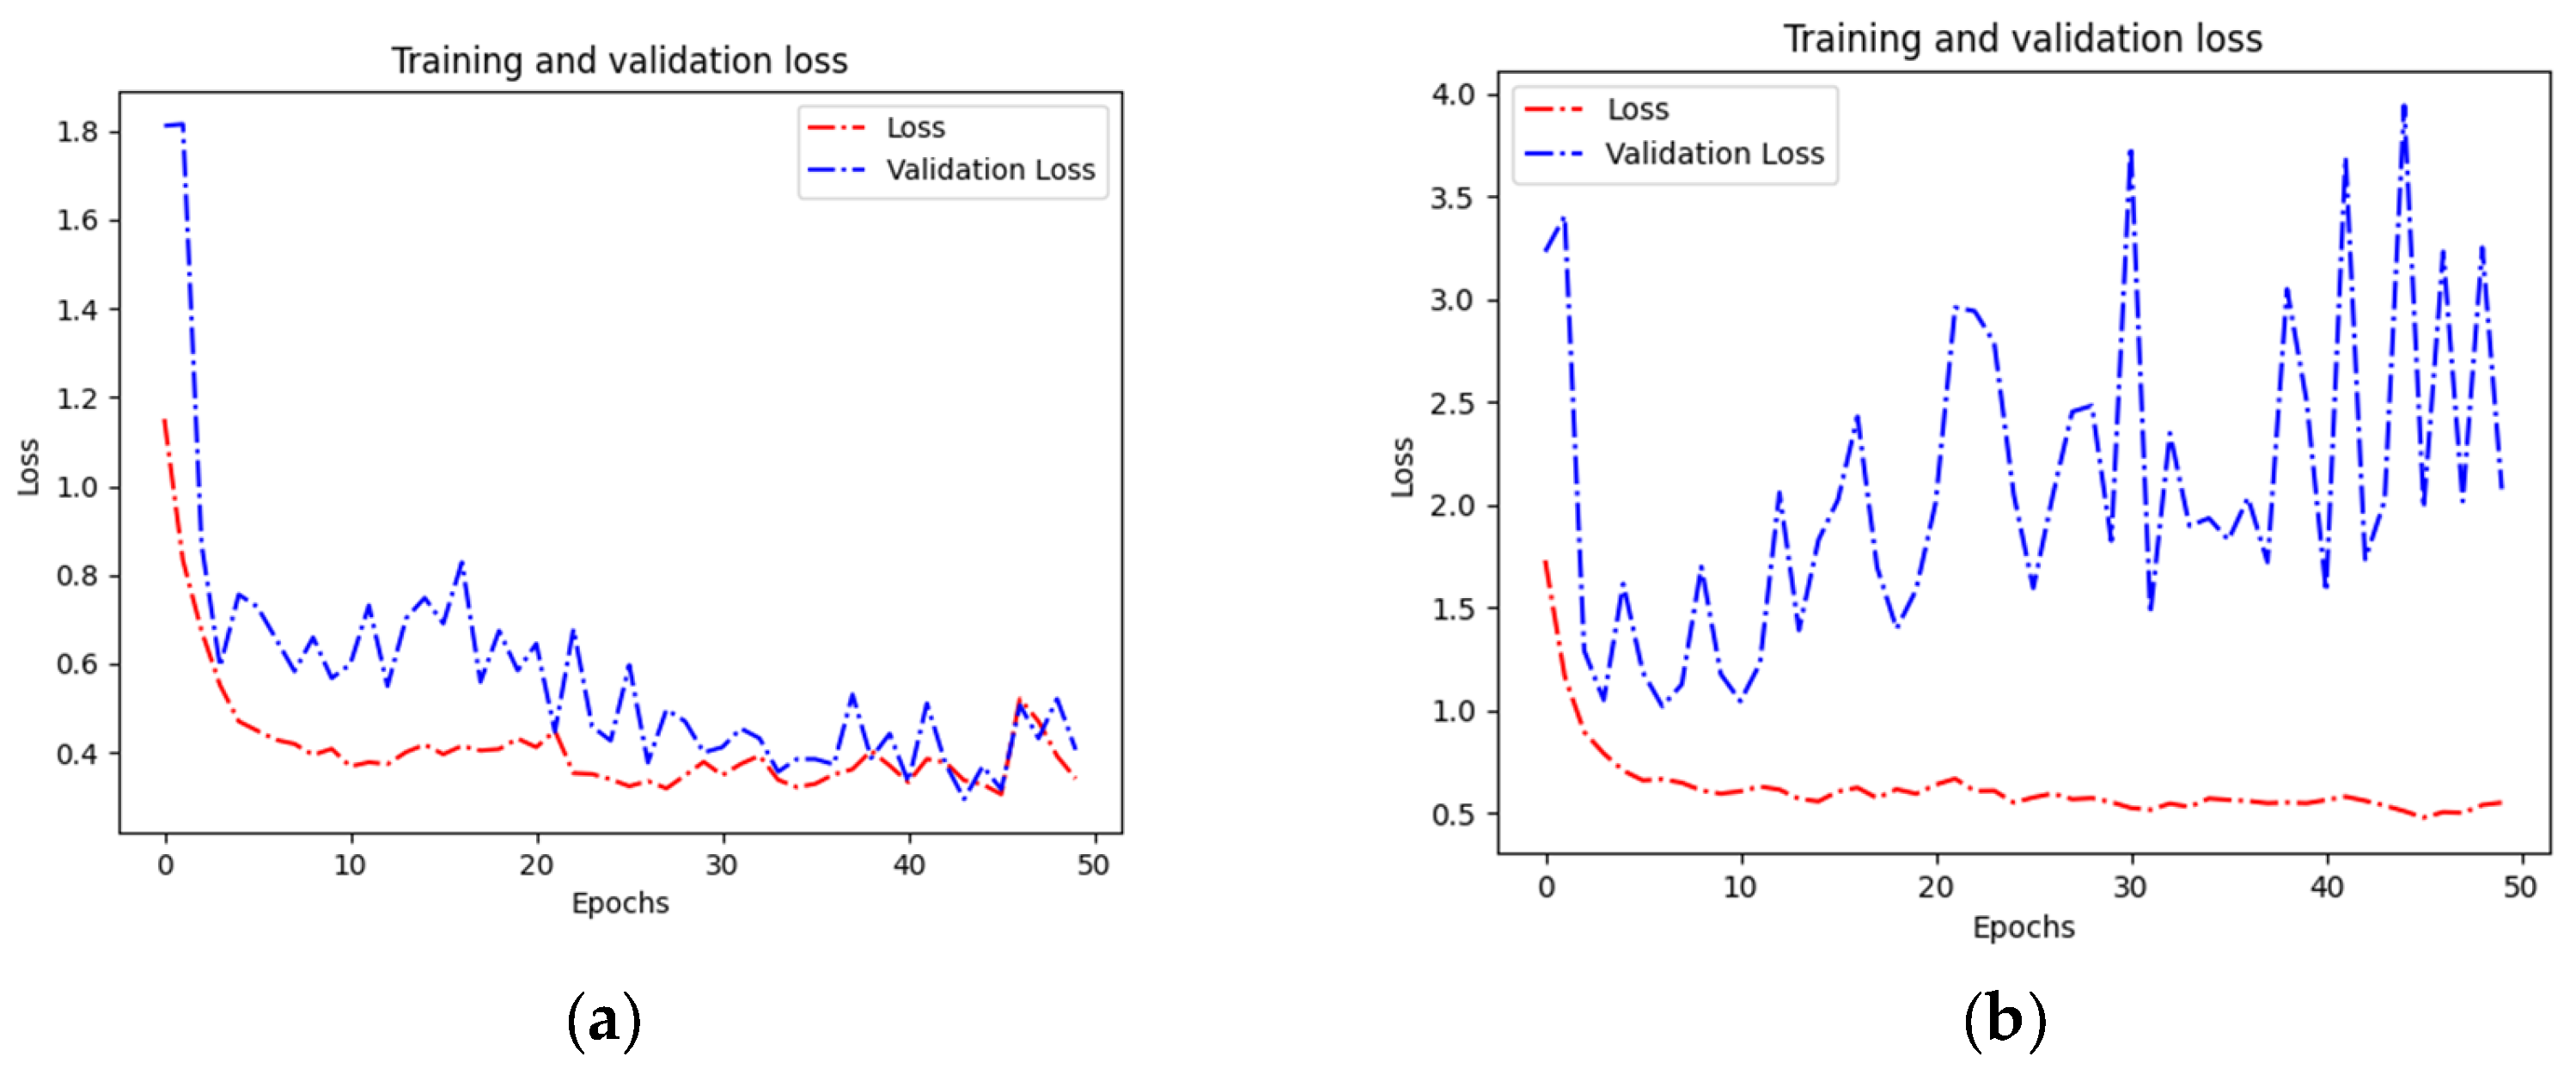
The number of samples in each category is 6000, the sample length is 12,000, and the step length is 150. The dataset is partitioned into training, validation, and test subsets with a proportional split of 50%, 30%, and 20% respectively. The labels of crack, normal, and wear are 0, 1, and 2 respectively, under the same conditions. In Figure 9, (a) is the accuracy curve obtained by using the dynamic transmission error signal for fault diagnosis, and (b) is the accuracy curve obtained by using the meshing force as the data set for fault diagnosis. The loss value variation curve obtained by fault diagnosis using DTE signal and meshing force as data sets is shown in Figure 10a,b. The confusion matrix is plotted for the diagnostic results of the test set, and the visualization result of the confusion matrix is shown in Figure 11.
Utilizing the DTE signal, our method attains 99.09% fault identification accuracy on test data. The accuracy and loss value of the validation set fluctuated slightly, and some data may be overfitted. However, the overall effect is still good. The accuracy finally stabilized above 98, and the loss value remained below 0.6. It has a good diagnostic effect.
The test set accuracy obtained by using meshing force as the data set for fault diagnosis is 73.60%. As can be seen from Figure (b) in Figure 9 and Figure 10, by comparing the accuracy and loss value change curves, the accuracy of the validation set is generally lower than 80%, and the loss value fluctuates greatly. Compared with the general gear meshing force as input data, the dynamic transmission error proposed in this paper as input data has a higher comprehensive diagnostic efficiency than the comparison method.
By observing the confusion matrix of the two signals, the crack fault diagnosis accuracy with 0 labels is the lowest, especially when the meshing signal is used for fault diagnosis; its F1-score is only 0.4169, Precision 0.7707, and Recall 0.2857. The pitting fault diagnosis accuracy with two labels is relatively low, with an F1-score of only 0.7696, Precision 0.9417, and Recall 0.6506.

4. Patents

The use of vibration signals for gear transmission fault diagnosis is easily affected by environmental noise, while it is hard to measure the gear meshing force. This paper proposes to use the influence of meshing stiffness on dynamic transmission error in the gear transmission process to diagnose and identify typical gear tooth faults. Compared with vibration signals or meshing force signals, dynamic transmission error only needs to measure the rotation angle of two gears. The measurement cost of the encoder is lower, the measurement is relatively convenient, and the rotation angle signal is less susceptible to noise interference. The gear meshing dynamic transmission error is calculated using the rotation angle output by Adams dynamic simulation. Finally, the obtained data is used for fault diagnosis and identification using the same neural network model, and a diagnostic accuracy rate of 99.09% is obtained, which is about 27% higher than the fault identification accuracy rate using meshing force signals. The feasibility of using dynamic transmission error as a data set for fault diagnosis is further verified. However, the data of this study is mainly based on simulation, and the persuasiveness in real scenarios is not significant enough. Building a gear transmission experimental platform and actually collecting various fault data (broken teeth, peeling, multiple cracks) for analysis and diagnosis will be the main direction of future research. In terms of fault diagnosis, this research method can also be compared with the latest research methods such as those based on wavelet transform or integrated methods to observe the advantages and disadvantages of the comparison, and provide new ideas for future fault diagnosis.

Author Contributions

Conceptualization, S.W. and J.W.; methodology, S.W. and J.W.; software, S.W. and H.R.; validation, S.W.; writing and editing, S.W.; visualization, S.W. and H.R.; supervision, S.W.; funding acquisition, J.W. All authors have read and agreed to the published version of the manuscript.

Funding

Basic scientific research project of Wenzhou City (G2023066), NSFC (12202318).

Institutional Review Board Statement

Not applicable.

Informed Consent Statement

Not applicable.

Data Availability Statement

The data are available from the corresponding author upon request.

Conflicts of Interest

The authors declare no conflicts of interest.

References

  1. Ji, N. Research on Gearbox Fault Diagnosis Technology Based on Vibration Signals. Master’s Thesis, North China University of Water Resources and Electric Power, Zhengzhou, China, 2020. (In Chinese). [Google Scholar] [CrossRef]
  2. Tang, Y. Simulation Study of Gear Fault in Metallurgical Crane Reducer Based on ADAMS. Master’s Thesis, Anhui University of Technology, Ma’anshan, China, 2021. (In Chinese). [Google Scholar] [CrossRef]
  3. Ma, H.; Song, R.Z.; Pang, X.; Wen, B. Time-varying mesh stiffness calculation of cracked spur gears. Eng. Fail. Anal. 2014, 44, 179–194. [Google Scholar] [CrossRef]
  4. Lewicki, D.G.; Ballarini, R. Effect of Rim Thickness on Gear Crack Propagation Path. J. Mech. Des. 1997, 119, 107229. [Google Scholar] [CrossRef]
  5. Tan, C.K.; Irving, P.; Mba, D. A comparative experimental study on the diagnostic and prognostic capabilities of acoustics emission, vibration and spectrometric oil analysis for spur gears. Mech. Syst. Signal Process. 2007, 21, 208–233. [Google Scholar] [CrossRef]
  6. Liang, X.H.; Zhang, H.S.; Liu, L.B.; Zuo, M.J. The influence of tooth pitting on the mesh stiffness of a pair of external spur gears. Mech. Mach. Theory 2016, 106, 1–15. [Google Scholar] [CrossRef]
  7. Ahmad, I.; Siddique, B.; Islam, M.A.; Haq, Z.U.; Niu, Z.; Waqas, M.M.; Yang, Q.; Qiu, Z. Development and evaluation of digital twin model for rack and pinion drive vegetable seedling transmission device using Adams/MATLAB co-simulation. Simul. Model. Pract. Theory 2025, 142, 103132. [Google Scholar] [CrossRef]
Figure 1. Overall flow chart.
Engproc 111 00003 g001
Figure 2. Normal spur gear meshing gear pair.
Engproc 111 00003 g002
Figure 3. Gear crack propagation path.
Engproc 111 00003 g003
Figure 4. Local enlarged view of the cracked gear model: (a) 10% crack, (b) 30% crack, (c) 50% crack.
Engproc 111 00003 g004
Figure 7. The 30% crack depth gear dynamic transmission error signal.
Engproc 111 00003 g007
Figure 8. The 30% crack depth gear meshing force signal.
Engproc 111 00003 g008
Figure 9. (a) The accuracy curve obtained by using the dynamic transmission error signal for fault diagnosis; (b) accuracy curve obtained by using meshing force as data set for fault diagnosis.
Engproc 111 00003 g009
Figure 10. (a) Dynamically transmitted error signal as loss value change curve of input data; (b) curve of loss value of meshing force as input data.
Engproc 111 00003 g010
Figure 11. (a) Confusion matrix of the dynamically transmitted error signal as input data; (b) Confusion matrix of the meshing force loss value as input data.
Engproc 111 00003 g011
Table 1. Main parameters of the spur gear meshing gear pair.
Driving GearDriven Gear
Modulus (mm)22
Pressure angle (°)2020
Head clearance coefficient0.250.25
Addendum coefficient11
Number of teeth3030
Tooth width (mm)3030
Table 3. Model parameter table.
Network LayerKernel SizeStrideChannelsData Size
Input Layer---12,000 × 1
Conv131412,000 × 4
MaxPool132-6000 × 4
Conv23186000 × 8
MaxPool222-300 × 8
Flatten---24,000
Dense---32
SoftMax---3
Disclaimer/Publisher’s Note: The statements, opinions and data contained in all publications are solely those of the individual author(s) and contributor(s) and not of MDPI and/or the editor(s). MDPI and/or the editor(s) disclaim responsibility for any injury to people or property resulting from any ideas, methods, instructions or products referred to in the content.